
ABSTRACT
Falling in the older population occurs frequently. Prospective and cohort studies have investigated the cause of such falls and have attempted to predict fall risk in the older population based on their performance during gait in daily life or during gait and simple tasks in the lab. However, most falls do not occur during steady gait but occur due to challenging centre of mass displacements or environmental hazards resulting in slipping, tripping or falls on stairs. The objective of this systematic review is to identify motion analysis parameters measured during challenging locomotion tasks which can predict fall risk in the older population. A systematic review was conducted in the databases of Pubmed, Scopus and IEEEexplore. Articles studying motion analysis parameters of healthy older and young adults during stair climbing, perturbed walking, and obstacle crossing were included. Study characteristics were extracted, and level of evidence assessed. In total 36 articles were included: 13 on stair climbing, 8 on perturbed walking and 15 on obstacle crossing. No prospective and 5 retrospective studies were included. Risk of bias was low in 7 articles, moderate in 24 articles and serious in 5 articles. Outcome measures included spatiotemporal, dynamic stability, force plate, joint kinematic and kinetic, as well as success rate and step accuracy outcomes. Significant differences between low and high fall risks groups were reported for: foot (toe) clearance during stair ascent; foot contact during stair descent; stair climbing velocity: double stance phase and lower extremity joint force moments in stair climbing, obstacle crossing; and step width variability in all three tasks. Several other motion analysis parameters were significantly difference between young and older adults. There was a large variety in parameter assessment methods, so a meta-analysis was not possible. Future studies on challenging locomotion tasks should focus on long-term follow-up fall risk assessment including an initial assessment of mental and physical characteristics of the older participants. In addition, a consensus on candidate prognostic fall risk parameters and their corresponding assessment method is needed. First recommendations were made based on the findings in this review.
1 Introduction
Falls in the elderly are frequent, a major cause of impairment with a significant consequence for quality of life and cause a high socioeconomic cost. Fall incidence in older adults ranges between 20 to 50% each year, depending on age and frailty level (Sattin et al., 1990; Speechley and Tinetti, 1991; Kannus et al., 2005). Thirty percent of community-dwelling adults aged 65 years and older fall each year, and this increases to 50% for those aged 75 years and older (Tinetti et al., 1988; Speechley and Tinetti, 1991; Steinweg, 1997). Among individuals aged 65 years and older, the relative falling rates increase by approximately 5% per year (Anstey et al., 2008). Such falls result in injury in 15 to 45% of the cases (Mackenzie et al., 2002; Kannus et al., 2005), including lower and upper extremity fractures, open wounds, intracranial injuries, and other impairments, according to the type of fall (Tinetti et al., 1988; Sattin et al., 1990; Mackenzie et al., 2002; Sartini et al., 2010; Phelan et al., 2021). The fall-related injuries result in a high economic burden for acute health care and rehabilitation. Around the world, the mean costs per fall victim, fall and fall-related hospitalization ranged from the equivalent of US $1,000 to US $44,000 (Heinrich et al., 2010). Furthermore, falls lead to disability and nursing home admissions (Gill et al., 2013). In conclusion, falls among the older population are frequent, a major cause of impairment with a significant consequence for quality of life and cause a high socioeconomic cost.
To effectively prevent falls, prospective and cohort studies have investigated the cause of falls. From these studies, fall risk has been related to physiological characteristics such as decreased foot or trunk muscle strength (Mickle et al., 2009; Granacher et al., 2014), cognitive and flexibility impairments (Tinetti et al., 1988; Speechley and Tinetti, 1991), as well as performance parameters extracted from kinematic and kinetic data recorded during locomotion tasks such as walking, Timed-up-and-Go (TUG) or one limb stance (Tinetti et al., 1988; Swanenburg et al., 2010; Ihlen et al., 2018). Another line of research has attempted to identify individuals at higher fall risk using prediction models. Generally, machine learning techniques are applied to derive fall risk prediction models, which are based on multiple so-called candidate prognostic factors (Ihlen et al., 2016; Greene et al., 2017; Hua et al., 2018; Rehman et al., 2020; Van Schooten et al., 2015; Gietzelt et al., 2014; Rehman et al., 2020a; Silva et al., 2017). So far, these candidate prognostic factors have been assessed from accelerometer signals recorded in the lab (in gait or TUG) or in daily life (10-20 second gait bouts). However, the success rate for fall risk prediction varies with high disparate levels of reported sensitivity (55-100%), specificity (15-100%) and accuracy (62-100%) and locomotion task (Howcroft et al., 2013; Van Schooten et al., 2016; Montesinos et al., 2018; Rehman et al., 2020a; Tunca et al., 2020).
The relatively poor performance of these fall risk prediction models raises the question as to whether fall risk in real life can be predicted from performance during cyclic and controlled locomotion tasks. Prospective studies on older fallers report that such falls often occur in the presence of a hazard (30- 50%) or during more challenging centre of mass (CoM) displacing actions (60%) (Tinetti et al., 1988; Speechley and Tinetti, 1991; Luukinen et al., 2000; Mackenzie et al., 2002; Sartini et al., 2010). Environmental hazards result in slipping, tripping, falls from an upper level (a height) or falls on stairs. Tasks with a challenging CoM displacement include weight transfers, standing up or sitting down, bending over, or may have an extrinsic reason such as a push or a pull. In addition, fall risk is correlated with the experienced level of difficulty of such activities, i.e., stair climbing, walking more than 400 m, carrying a 5 kg shopping bag for 10 m and bending over to pick up an object (Wijlhuizen et al., 2010). Furthermore, with unexpected perturbations during walking, older participants demonstrated a higher variability of assessed stability parameters, which has been related to increased fall risk (Madehkhaksar et al., 2018; Gerards et al., 2021). Lastly, falls during locomotion tasks with a higher energy demand such as falls on stairs, falls from an upper level or falls due to extrinsic reasons are related to the highest risk of severe injury i.e., fractures (Luukinen et al., 2000).
Fall risk prediction might be improved by including challenging locomotion tasks. Indeed, we suggest that the prediction of fall risk in older adults may be better assessed by including their ability to negotiate stairs and obstacles, or to counteract external perturbations during walking. Besides the choice of task, appropriate task performance parameters need to be identified. The objective of our systematic review is to determine which performance parameters assessed during challenging locomotion tasks (including obstacle crossing, perturbations, and stair climbing) are best related to falling in the older adult population.
2 Method
2.1 Literature Search
Factors related to fall risk are ideally studied in a prospective study with older adults. As prospective studies are time-consuming, they are limited in number. Thus, retrospective and cross-sectional observational studies were also included in this review. Relevant articles should study the association between fall risk and motion analysis outcome parameters (cross-sectional studies) or identify so-called candidate prognostic factors from the outcome parameters for fall risk (prospective or retrospective studies (Mueller et al., 2018; Riley et al., 2019; Kent et al., 2020). Motion analysis outcome parameters should include kinematic, kinetic, or spatial-temporal parameters, which are assessed from challenging walking tasks such as obstacle crossing, stair climbing or perturbed gait. The literature search was performed using the PubMed, Scopus, and IEEExplore databases.
A Boolean combination of the following terms was used to search the aforementioned databases on February 2021: (((fall) OR (fall risk)) AND ((obstacle) OR (stair) OR (perturbation)) AND ((age) OR (older) OR (elderly)) NOT ((diabetes[Title/Abstract]) OR (rheumatoid arthritis[Title/Abstract]) OR (Parkinson[Title/Abstract]) OR (stroke[Title/Abstract]))). A restriction to the “Source title” was given when searching in Scopus. The following journals were searched in Scopus: Gait and Posture, Journal of Biomechanics, Archives of Physical Medicine and Rehabilitation, Clinical Biomechanics, Human Movement Science. Furthermore, all articles were published in English and no period restriction was given as a filter.
For article extraction, three reviewers screened through the titles and abstracts. Two reviewers screened the titles, abstracts, and full text. When two reviewers had opposite opinions about the inclusion of an article, a third reviewer made the final decision. The inclusion criteria were: 1) the article examined the group (healthy young and or healthy and frail older adults) differences in features such as kinematic, kinetic and spatiotemporal parameters when performing a challenging locomotion task; 2) the locomotion task should include stair climbing, walking with perturbation or obstacle crossing; and 3) all of the participants were healthy, i.e., they should not suffer from any neurological, musculoskeletal disorder, or other conditions related to cognitive disorders and visual impairment. Exclusion criteria were: 1) the article examined the group performance differences in EMG or EEG signal outcomes; 2) the study compared the difference between a control group and a specific diseased or sensory impaired group; 3) the study design included an intervention and examined the change after the intervention; 4) dual-task studies.
2.2 Level of evidence
Since multiple types of studies were included, guidelines for systematic reviews of prognostic studies (Riley et al., 2019), observational studies (Mueller et al., 2018; Dekkers et al., 2019), and non- randomised controlled trials (Sterne et al., 2016) were followed. Within these guidelines, required data extraction is similar and includes a description of the study design, participant and sample size, the experiment (a challenging locomotion related task), analysis method, the outcome measures, and corresponding significant findings (effect estimates).
In the above-mentioned guidelines, bias assessment includes confounding factors and covers selection and information bias, where the signalling questions to determine the bias differ per study type. Bias assessment in prognostic studies can be performed using the bias domains and corresponding signalling questions suggested in QUIPS (Hayden et al., 2013). However, these signalling questions do not cover all selection biases that may occur in observational studies, such as participant group allocation, which is better represented e.g., in the selection bias assessment of the ROBINS-I guideline. For observational studies, however, there is no agreed-upon bias assessment guideline (Mueller et al., 2018; Ma et al., 2020). To ensure the identification of all bias risks in this review, we followed the four crucial steps suggested by (Dekkers et al., 2019) and recommendations made by (Dekkers et al., 2019; Riley et al., 2019). First, a team of reviewers with experience in the field of fall risk, (para-)medical therapy, older adults, machine learning, and systematic reviews was initiated. Second, our target trial (gold standard) was defined as a prospective observational study of adults including an assessment of a challenging locomotion task (experiment/observation) followed by a long term and repeated evaluation of the occurrence of a fall (event). Related to the research question of this review, the aim of the target trial would be to study the relationship between the occurrence of a fall and the task performance outcome measures. The assumption would be that motion analysis outcome parameters with an observed strong relationship with fall occurrence, are candidate predicting factors for the event of a fall. Third, the effect of interest is defined as the allocation of participants to a group representing fallers (high fall risk) or non-fallers (low fall risk) and how this may influence or bias the outcome parameters.
In the fourth step, the confounding factors and bias domains were discussed and determined, and corresponding signalling questions were defined. In total, seven bias domains were defined, and they relate to potential bias issues occurring before (domain 1, 2), during (domain 3) and after (domain 4, 5, 6, 7) the effect of interest, i.e., allocation of the participants to the fall (risk) group. The first three bias domains include bias distinct from the target trial, such as bias due to confounding, bias due to selection of participants, and bias in the assessment and classification of fall risk. The confounding factors are related to both fall risk group assessment and outcome parameter: i.e., age, gender, mental and physical fitness, frailty, and fall history. Selection bias occurs when participants do not adequately represent the target population. Bias in classification occurs when participants are allocated to the wrong fall risk group, e.g., due to errors in recall or non-valid fall risk assessment methods. For articles comparing older adults at high and low risk of falling, if fall risk was assessed based on fall history, this was considered as a low risk of bias. If fall risk was assessed in another way (typically clinical tests or questionnaires), this was considered a moderate or serious risk of bias, depending on the method used. For articles comparing younger and older adults, the classification bias was considered “not applicable”, and the results from these articles are presented separately.Selection and classification bias only refers to factors related to fall risk (internal validity), not to factors related to generalizability or applicability of the study (external validity).
The other 4 bias domains are independent of the study type and refer to the observation, i.e., the experiment and data handling, and include: bias due to deviations from the intended experiment, bias in the measurement of outcome parameters, bias due to missing data, and bias in the selection of the reported result. Bias from deviations from the intended experiment includes systematic differences between the care and or instructions provided to participants with high fall risk and comparator groups and to proper adherence to the experiment by the participant. Such factors may significantly influence the participant’s experiment performance. The motion analysis outcome parameters may be biased if assessors are aware of group status, if different methods (or intensities of observation) are used to assess outcomes in the different groups or if measurement errors are related to group status. Some of the biases from domains 4 (intended experiment) and 5 (outcome parameters) may typically be avoided using blinding. Regarding missing data, enough data should be presented in both groups to be confident of the findings and the missing data should not be group dependent. Bias in reporting the results can occur due to reporting of selective results, analysis, or sub-groups.
To make the scoring repeatable, signalling questions, corresponding sub-questions and bias examples were used (Appendix A, Table A.1). The questions were answered with: ‘no’, ‘probably not’, ‘yes’ or ‘probably yes’. If (probably) no bias was assumed for the signalling question, we moved on to the next signalling question. If bias was assumed, for some domains, corresponding sub-questions were answered. If the signalling and sub-question could not be answered due to the lack of information in the article, the question was scored as ‘no information’. Lastly, for each included article and each bias domain, each bias issue was described, scored qualitatively (low, moderate, serious, no information).
The bias scoring into low, moderate, or serious bias was followed as described in QUIPS and ROBINS-I, and detailed in Appendix A, Table A.2. Bias levels were discussed and decided upon, keeping in mind to which extent and in which direction a bias factor might influence the estimated effect compared to the true effect (where the effect is the difference in outcome parameters between groups). The complete risk of bias assessment for all reviewed papers is provided in Appendix B.
In summary, for each included article the study design, included population and sample size, the experiment, the analysis method, the motion analysis outcome parameters, and effect estimates were reported. Sequentially, the seven bias domains were evaluated as described above: The method of participant inclusion, group allocation and the potential corresponding bias it could have on the outcome parameters, is analysed; Furthermore, those factors that might have influenced the outcome due to handling of the experiment and outcome parameters, regardless of the study type, were analysed. All relevant information is listed as results in table 1.
Abbreviations: years old: y; male: m; female: f.
Shading:  not reported Study type:
Retrospective study: comparison of older adults who did and did not fall during a period preceding the measurement
Cross-sectional study - Older adults: comparison of older adults with higher and lower fall risk, based on a fall risk assessment which is neither prospective nor retrospective fall history
Cross-sectional study: comparison of younger and older adults
Risk of bias: Low,
Low,  Moderate,
  Serious
Fall risk assessment:
Fall history:
o ✓ if fall history preceding the measurement was assessed
o ✗ if fall history was assessed and fallers excluded from the study Medicine usage
✓ if participants took medication during the measurement period
✗ if participants did not take medication during the measurement period
Measurement devices: if force platforms or infrared cameras were used, but their number was not reported, this is indicated by ✓
Task description:
Expected:
o ✗ if unexpected changes in the task occurred from trial to trail (for example: if various obstacles or stairs were used and these were presented in random order, or if perturbations occurred at random times)
o ✓ otherwise
External support:
o ✓ if external support was provided
o ✗ if external support was not provided
2.3 Effect size
The effect sizes reported by the studies were used or we calculated Cohen’s D for each significant finding where effect size was not reported in the article. Cohen’s D was assessed from the deviation of the mean from each group divided by the pooled standard deviation. The equation of Cohen’s D equation is given below (Equation 2):

In addition, significant outcome parameters found by at least 4 different articles (>10% of total articles), were reported in detail in the results section. Significant findings reported by more than 8 articles were presented in forest plots (MicrosoftⓇ Excel) to improve visibility for comparison of and possible consensus within the findings. The forest plots include the significant outcome values, effect estimates and the overall bias estimate. A meta-analysis however was not possible, due to the many differences within the experiments as well as in the calculation methods of the outcome parameters in the articles.
3 Results
3.1 Article extraction
In total, 1552 articles were extracted from the three databases. First, 323 duplicates were removed. Another 1174 articles were removed based on their titles and abstracts. After reading the full text, further 19 articles were removed for the following reasons: 17 articles focused on dual-tasks, static balance tasks or walking tests, one article included a systematic review, and one article lacked the description of the participants. An overview of the systematic article extraction is given in figure 1.
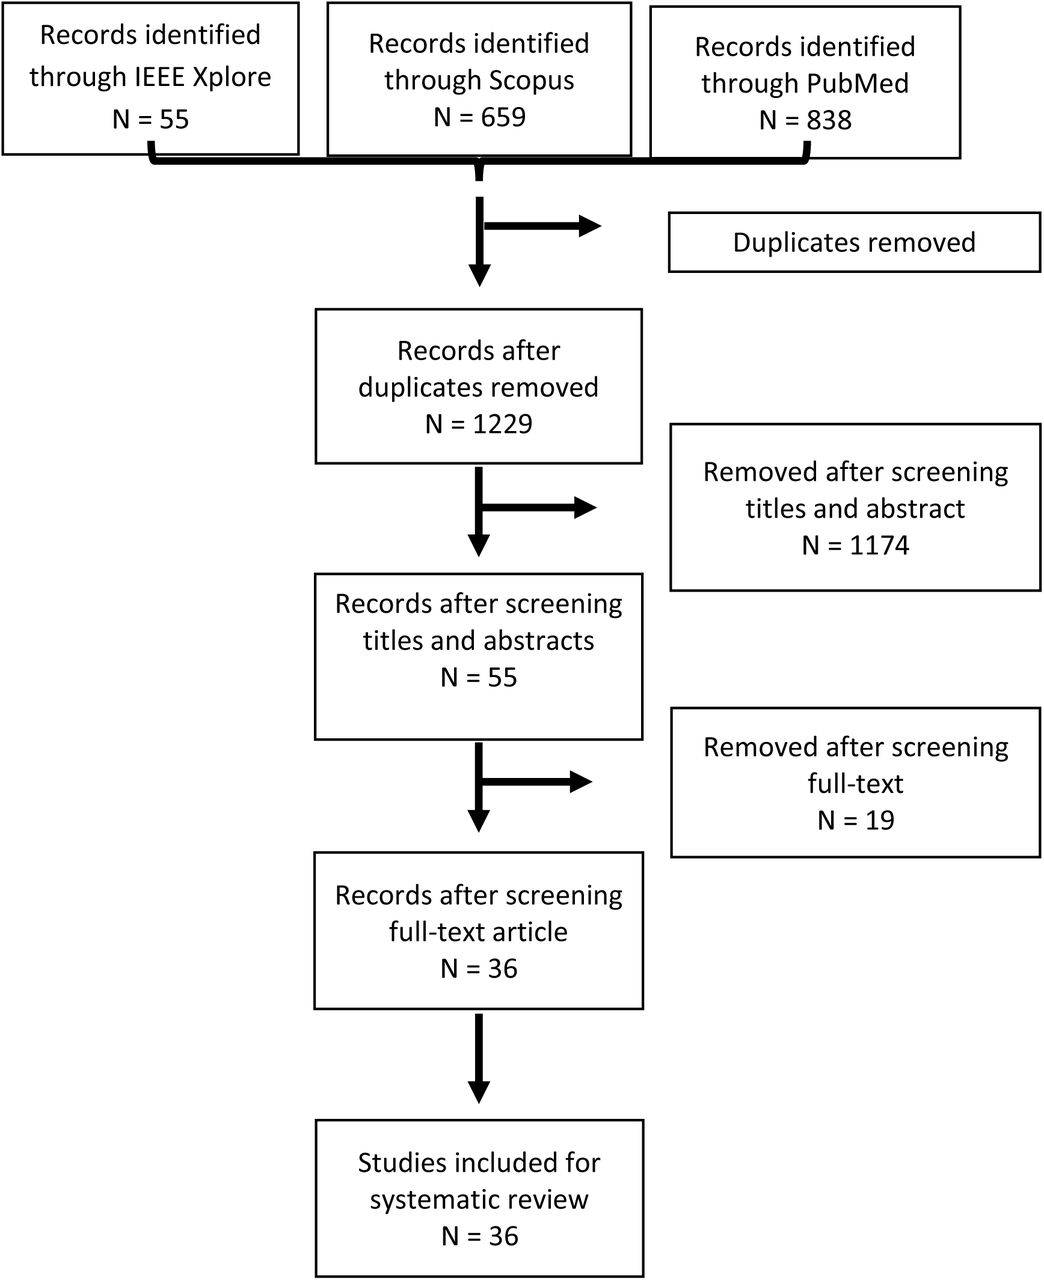
Overview systematic article extraction
In the end, 36 articles were included in this review. Of these, 13 studied stair climbing, 8 studied perturbations and 15 studied obstacle crossing. An overview of the articles’ study design, description of included population and sample size, and description of the experiment is given in table 1. Details on the analysis method, the motion analysis outcome parameters, and effect estimates are reported in Appendix C. The most frequently reported outcome parameters are presented in paragraph 3.4.
3.2 Level of evidence
No article described a prospective study with long term follow-up of fall history. In six articles fall history was assessed retrospectively. Five of these articles compared older adults with a high fall risk versus low fall risk based on their recall of fall history (Uemura et al., 2011; Zietz et al., 2011; Pieruccini-Faria and Montero-Odasso, 2019; Guadagnin et al., 2020; Oh-Park et al., 2011), and one compared young adults to older adults with a high fall risk (Weerdesteyn et al., 2005). Of the 30 other studies, only 5 focussed on the difference between older adults with a high fall risk compared to low fall risk, which was solely based on physical capacity (Pijnappels et al., 2005; de Carli et al., 2014; Pan et al., 2016; Ackermans et al., 2019 ; Oh-Park et al., 2012). Often sample sizes were small: in 10 articles sample size per group was 10 or less, in another 13 articles sample size per group was between 10 and 20 participants.
An overview of the bias risk for each domain and article are given in Appendix B. Based on the seven bias risk domains, we classified 7 studies with low risk of bias, 24 studies with moderate risk of bias and 5 studies with serious risk of bias. Typical biases among the articles included in the seven domains were:
Confounding factors: Confounding due to a difference in the gender ratio between groups (3 articles).
Participant selection: the health status of the participants (physical health, mental health or fall history) was used an exclusion criterion (17 articles); the study population had an unbalanced gender ratio (13 articles, including 4 which included only females).
Group allocation: fall risk was assessed based on clinical tests or questionnaires rather than fall history
Intended experiment: handrail usage by insecure older participants (1 article)
Outcome parameters: Invalid assessment of CoM location (3 articles)
Missing data: Missing data due to differences or errors in task performance resulting in unbalanced groups for analysis (5 articles)
Result reporting: Small sample size (i.e., N = 6) enabling only descriptive statistics (1 article)
3.3 Sample characteristics
The 36 reviewed articles included 432 younger adults (age: 20∼37 years old) and 1710 older adults (age: 56∼88 years old). Of these, 25 articles focused on the difference between healthy old adults and healthy young adults and two articles focused on females only. Furthermore, ten articles compared fallers and non-fallers for the experiments and most of these fallers suffered from reoccurring falls before the experiment. In these ten articles, 91 fallers and 212 non-fallers were included, and one article only focused on females. Lastly, only two long-term follow-up studies were found and included 351 older males and 533 older females. In accordance with our exclusion criteria, the participants in the reviewed articles did not suffer from any neuromuscular, musculoskeletal, or cardiovascular disease.
3.4 Motion analysis outcome parameters
Traditional motion analysis systems were used including force plates and infra-red cameras and all experiments took place in a laboratory setting. Most of the articles (72%) reported spatiotemporal outcomes. Other outcome measures included dynamic stability outcomes, force plate outcomes, joint kinematic and kinetic outcomes as well as success-rate and stepping accuracy outcomes. An overview of the reported outcome parameters and corresponding studies reporting their (non-)significant findings is given in table 2.
Overview of the reported outcome parameters and corresponding articles reporting either significant or non-significant findings. Articles comparing elderly adults with higher and lower fall risk are indicated in bold, whereas articles comparing younger and older adults are not in bold. Sign., significant; N.S. non-significant.
3.4.1 Spatiotemporal outcome
Stance-swing phase duration (18 articles), step or stride length (18 articles), Foot clearance (11 articles), walking, approaching and avoidance speed (11 articles) and step width (8 articles) were the most common assessed spatiotemporal outcome parameters.
3.4.1.1 Phase durations
Eighteen articles reported on gait phase durations. Of these, thirteen articles reported significant findings for stance, swing, initiation, reaction, recovery, or compensatory duration (fig. 2). Regardless of the task, the double stance phase and stance durations are longer for older adults compared to young adults and even longer for older adults with a higher fall risk (Pijnappels et al., 2005; Novak and Brouwer, 2011; de Carli et al., 2014; Joana et al., 2016). Swing duration is smaller for older adults compared to young adults but becomes significantly larger for older adults compared to young adults with increasing task difficulty (Kim and Brunt, 2013; Shulman et al., 2019). Step or stride duration has inconsistent findings (Begg and Sparrow, 2000; Sterne et al., 2016; Chien et al., 2018; Pieruccini-Faria and Montero-Odasso, 2019).

Forest plot of stance, swing or recovery time, below the reaction time. Circles: open blue– younger adults, yellow closed– older adults with low fall risk, red closed – older adults with high fall risk, brown closed– older adults with unspecified fall risk. Ntot is the total number of participants.
The reaction time and posture adjustment times were longer for older compared to young adults and increased with fall risk (Uemura et al., 2011; Martelli et al., 2017; Nachmani et al., 2020).
3.4.1.2 Step or stride length
Eighteen articles reported group difference in step or stride length. Ten articles (55%) reported significant differences in step or stride length between or within the age groups (fig. 3). In general, older adults have a smaller step length than young adults, but there is no significant difference in step length between older adults with a high fall risk compared to low fall risk.

Forest plot of step or ½·stride length. Circles: open blue– younger adults, yellow closed– older adults with low fall risk, red closed – older adults with high fall risk, brown closed– older adults with unspecified fall risk.Ntot is the total number of participants.
In unperturbed walking, older adults showed smaller step and stride lengths than young adults, and this difference becomes larger with increasing task difficulty like stair walking (Begg and Sparrow, 2000; Chiu et al., 2015), forward perturbations (Shulman et al., 2019) or obstacle crossing (Pijnappels et al., 2005; Joana et al., 2016; Pieruccini-Faria and Montero-Odasso, 2019). During stair climbing, age group differences of about 20 cm were reported for stride length during stair to floor or floor to stair transitions. Age group differences in step length of about 10 cm in unperturbed gait and of 5-12 cm in obstacle crossing were reported. Furthermore, the previous preparatory step before the obstacle crossing was significantly smaller with about 15 cm for older participants compared to young participants (Joana et al., 2016).
The two studies comparing high and low fall risk older adults did not find a significant difference in step or stride length between older fallers and non-fallers (Pijnappels et al., 2005; Pieruccini-Faria and Montero-Odasso, 2019). Pieruccini reported significant differences between step length variability. After tripping, older fallers showed a smaller recovery stride length, resulting in the recovery (front) limb being positioned posterior to their CoM, usually leading to a fall, since then the recovery limb needs to compensate for the continued fall motion (Pijnappels et al., 2005).
3.4.1.3 Foot clearance
Foot clearance between the participant and the stair or the obstacle were defined in many ways (fig. 4). Some studies reported foot clearance, while others reported heel clearance and or toe clearance. These clearances were reported as a vertical distance or as a horizontal distance between participant and stair or obstacle while the foot is in the air. Furthermore, clearance of the leading leg and the trailing leg were reported. No study reported the difference in foot clearance during walking with perturbation.

Foot clearance definitions from different studies
Statistically significant differences were found in foot clearance in eight of the eleven articles reporting foot clearance (fig. 5): all four articles on stair climbing reporting foot clearance found a significant difference. In general, older participants showed a larger foot clearance compared to younger participants for both the stair task (5 to 15 mm) and obstacle crossing task (10 to 45 mm, depending on obstacle shape). However, there is no consensus on the difference in foot clearance between high and low fall risk older participants, which findings are based on studies with small sample sizes, i.e., 10 individuals or less per group: In the studies by (Ackermans et al., 2019) and (Pan et al., 2016) the high fall risk older participant groups showed even more foot clearance than their age group with low fall risk. This higher fall risk was based on self-reported falls in last 12 months (Francksen et al., 2020)) or a score lower than 36 points on Tinetti Balance and Gait Subscale of the Performance Oriented Mobility Assessment (Pan et al., 2016). On the contrary, in a study by (Zietz et al., 2011) where the more prone older adults were identified based on their Berg Balance Scale, Modified Falls Efficacy Scale and Stair Self Efficacy Questionnaire, these older adults demonstrated less foot clearance (Zietz et al., 2011). Besides, foot clearance in older female fallers did not differ significantly from that of older female non-fallers in obstacle crossing (Guadagnin et al., 2020). Studies with larger sample sizes unfortunately did not report on foot clearance (Uemura et al., 2011; de Carli et al., 2014; Pieruccini-Faria and Montero-Odasso, 2019).
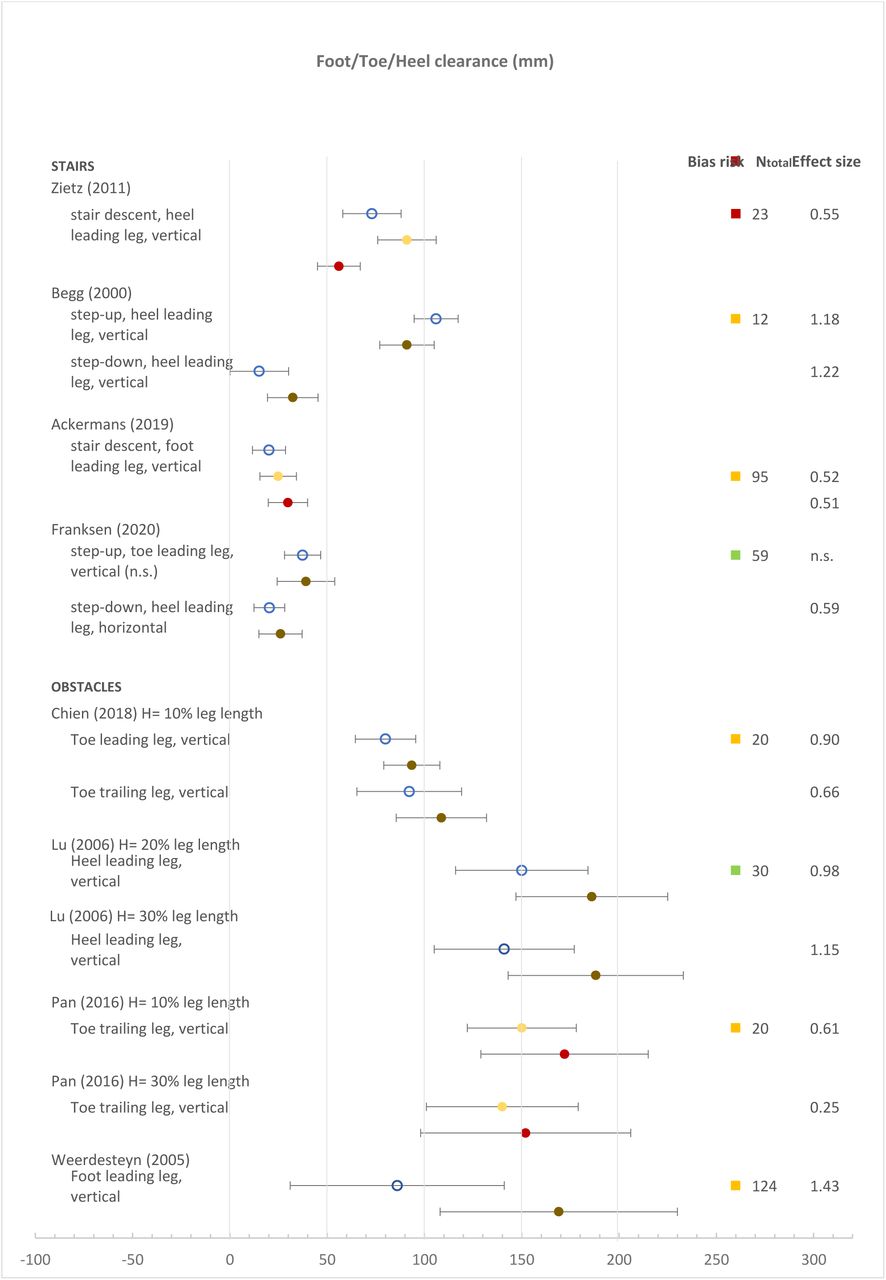
Forest plot of heel/foot/toe clearance. Circles: open blue– younger adults, yellow closed– older adults with low fall risk, red closed – older adults with high fall risk, brown closed– older adults with unspecified fall risk. Ntot is the total number of participants.
The individual foot clearance variability increased with age and fall risk: one study reported variance values of 37, 48 and 68 for young, low and high fall risk older adults, respectively (Ackermans et al., 2019); whereas another study reported variability values of 9 mm and 12 mm for young and older adults, respectively (Zietz et al., 2011).
3.4.1.4 Walking and approaching speed
Eleven articles reported walking and approaching speed, six of these reported a significant difference (fig. 6).

Forest plot of Velocity. Circles: open blue– younger adults, yellow closed– older adults with low fall risk, red closed – older adults with high fall risk, brown closed– older adults with unspecified fall risk. For Oh-Park (2012): older adults whose functional score improved / stayed the same / deteriorated after a year are indicated in green / yellow / red. CoM, centre of mass; HC, heel contact; min., minimum; ML, medial-lateral; MoS, margin of stability; n.s., not significant. Ntot is the total number of participants.
In unperturbed gait, older participants walked significantly slower than young participants. The high and low fall risk older participants walked at similar unperturbed speeds. In general, stair climbing occurs at lower velocities (< 1 m/s) than unperturbed gait and obstacle crossing (>1 m/s). More fragile older adults walk stairs even 0.05 m/s to 0.10 m/s slower than better performing older adults (Zietz et al., 2011; Oh-Park et al., 2012). However, no significant difference in either stair ascent or stair descent time was found between elderly subjects with and without a retrospective fall history (Oh-Park et al., 2011).
The walking velocity after a perturbation was influenced by the walking velocity before the perturbation (Shulman et al., 2019). For example, if the heel slip velocity is larger than the walking velocity, the participant will step backwards with the swinging limb and not forwards.
In obstacle crossing, only two of the six articles reported significant findings. There were no significant differences between older adults with a high and low fall risk (Pan et al., 2016; Pieruccini-Faria and Montero-Odasso, 2019; Guadagnin et al., 2020). The young adults seem to slow down somewhat before the obstacle and then speed up again when crossing the obstacle. On the contrary, older adults reduced their speed while crossing the obstacle (Chen et al., 1991; Joana et al., 2016). There is no consensus on the older adult obstacle approaching velocity: Caetano reported a slow down before the obstacle, but Chen did not.
3.4.1.5 Step width
Eight articles reported group differences in step width. Step width did not differ consistently between groups, but step width variability was significantly larger for older adults in all three tasks ((Chen et al., 1991; Zietz et al., 2011; Kazanski et al., 2020).
In stair climbing, no significant group differences were reported for step width (Zietz et al., 2011; Chiu et al., 2015). However, a significantly lower step width variability was reported for young (1.56 cm) compared to low (2.35 cm) and high fall risk (2.31 cm) older participants (effect size 0.37) (Zietz et al., 2011). In medio-lateral treadmill gait perturbations young and older participants both showed wider steps when perturbed but were not significantly different between the groups (Roeles et al., 2018; Kazanski et al., 2020). Forward perturbations at gait initiation did result in a significant difference in step width between older and young participants, because the young participants increased their step width (from 0.12 to 0.16 m) in the perturbed situations (Shulman et al., 2019). In obstacle crossing, older adults showed smaller step width and larger variance in step width than young participants, regardless of the obstacle height (Chen et al., 1991). High fall risk older adults showed even smaller step widths than low fall risk older adults (Pan et al., 2016).
3.4.2 Force plate outcome
Force plate outcome parameters were reported by 7 articles: 5 articles focussed on stair walking and 2 on obstacle crossing. The differences in ground reaction force and force rate were reported by 4 articles. For both age groups, vertical peak forces were 20% to 40% larger in stair descent than in overground walking (Christina and Cavanagh, 2002; Hamel et al., 2005). In stair climbing, there were no significant differences in ground reaction forces between age and fall risk groups. However, the vertical force loading rate was higher in older adults compared to young adults (Christina and Cavanagh, 2002; Hamel et al., 2005), and also higher for older adults with high fall risk compared to low fall risk (de Carli et al., 2014). For obstacle crossing, older adults had a smaller amplitude of antero-posterior ground reaction force compared to younger adults when crossing the obstacle (Kim and Brunt, 2013).
3.4.3 Dynamic stability outcome
Eight articles reported dynamic stability outcomes. With exception of Pan et al, all studies compared young to older adults. The Margin of Stability (MoS) was the most common dynamic stability outcome parameter being reported (5 articles) (fig. 7). In stair climbing and perturbations the anterior-posterior Margin of Stability (AP-MoS) was significantly reduced with age (Bosse et al., 2012; Martelli et al., 2017), but one study reported an increased AP-MoS with age in stair descent (Novak et al., 2016). Medio- lateral (ML) MoS was only studied in perturbations and inconsistent findings with small effect sizes were reported (Sun et al., 2017; Roeles et al., 2018). The 5 articles reporting MoS did not study the effect of fall risk or obstacle crossing task. Therefore, more research is required before a recommendation can be made on assessment of MoS.

Forest plot of Margin of Stability. Circles: open blue– younger adults, yellow closed– older adults with low fall risk, red closed – older adults with high fall risk, brown closed– older adults with unspecified fall risk. A negative MoS indicates the Xcom exceeds the base of support. AP, anterior-posterior; comp. time, compensatory time; HC, heel contact; min., minimum; ML, medial-lateral; MoS, margin of stability; n.s., not significant; Xcom = extrapolated centre of mass. Ntot is the total number of participants.
3.4.4 Joint Kinematic or kinetic outcome
Seven articles investigated joint kinematic and kinetic outcome parameters and six reported significant findings. Most articles studied knee (4) and hip (4) joint motion and joint moment (3) during stair climbing (2 articles) and obstacle crossing (5 articles). In stair climbing (Bosse et al., 2012) and in obstacle crossing, the ankle, knee or hip joint angles significantly reduced with age and fall risk (Chen et al., 1991; Pijnappels et al., 2005; Lu et al., 2006; Chien et al., 2018), but other studies did not report significant findings for all three joints (Chen et al., 1991; Lu et al., 2006). Also, active joint motion variability was not reported.
During stair climbing, healthy older adults had a smaller knee flexion of the leading leg at the initiation of the single support phase compared to young adults with effect size 1.28 (Bosse et al., 2012). Older adults had a significantly smaller hip joint flexion angle by 7 degrees (Lu et al., 2006; Chien et al., 2018), (Lu et al., 2006) and knee flexion angle by 5 degrees (Chien et al., 2018) when crossing an obstacle, with effect size from 0.71 to 1.29. While Chen et al. reported that older adults had significantly smaller maximum active range of motion of their hip and knee compared to younger adults, this did not limit their range of motion during obstacle crossing, where about 65-90% of maximum range of motion was used, like that of young participants (Chen et al., 1991). Though reduced active joint motion may explain the cause of tripping, a parameter such as foot clearance might to be a more directly related to fall risk.
3.4.5 Performance errors
Seven articles on obstacle crossing reported performance errors. All found statistically significant differences between age and fall risk groups with effect size from 0.2 to 0.8. In obstacle crossing, older adults showed a lower success rate than younger adults (93% versus 97-99%), and this difference became more apparent for reaction times below 350 ms (53-54% versus 86%) (Chen et al., 1994; Weerdesteyn et al., 2005; Kim and Brunt, 2013; Joana et al., 2016; Guadagnin et al., 2020). In a tripping study, none of the young subjects fell, but seven of the eleven older subjects fell the first one or two times they were tripped (Pijnappels et al., 2005). Sun and colleagues did not find significant group differences in their perturbation study (Sun et al., 2017).
4 Discussion
Falling is a significant problem for the older adult population. While many studies investigated fall risk in steady gait, this task is not comparable to the majority of falling situations of older people in daily life.
This is the first systematic review of the performance of young and older adults with high and low fall risk during challenging locomotion tasks, such as stair climbing, walking with perturbation and obstacle crossing. The aim was to gain insight in motion analysis outcome parameters which indicate a possibly higher fall risk for older people. Based on our search terms, 36 articles were included in this review: 13 on stair climbing, 8 on perturbations, and 15 on obstacle crossing. We identified several motion analysis performance parameters assessed during challenging locomotion tasks which may be possible candidates to predict risk of falling in the older population.
4.1 Motion analysis parameters in challenging walking tasks
Most of the articles identified by our search strategy did not actually compare high and low fall risk older adult populations, but simply compared healthy younger to healthy older adults (25 articles). Further, 5 cross-sectional studies compared high and low fall risk older adult populations (Pijnappels et al., 2005; Oh-Park et al., 2012; de Carli et al., 2014; Pan et al., 2016; Ackermans et al., 2019). Findings from these studies, though insightful, remain as tentative hypothetical relationships between fall risk and motion analysis parameters and cannot be used yet as candidate prognostic factors for fall risk (Kent et al., 2020). In other words, a parameter which discriminates between young and older adults, or which is assessed at same time point as the fall risk assessment, does not necessarily discriminate between high and low fall risk older adults. E.g., we found a significant difference in step length and foot clearance between age groups but not between fall risk groups.
Only 5 studies assessed fall risk based on retrospective fall history (Oh-Park et al., 2011; Uemura et al., 2011; Zietz et al., 2011; Pieruccini-Faria and Montero-Odasso, 2019; Guadagnin et al., 2020). From these studies candidate prognostic factors for fall risk such as reduction of stair climbing speed (Zietz et al., 2011), an increased variability of anterior-posterior CoM acceleration (Zietz et al., 2011) and longer anticipatory postural adjustment phase (Uemura et al., 2011) could be identified. We found no studies of perturbed walking which compared high and low fall risk older adults. Only in a recently published retrospective study, Gerards and colleagues reported that the low fall risk group significantly reduced their number of recovery steps needed across perturbed trials (Gerards et al., 2021). This learning effect was not observed in the high fall risk group. In real life, perturbations occur frequently and are frequent reasons for falls (Luukinen et al., 2000; Mackenzie et al., 2002; Robinovitch et al., 2013). Hence, in future, more pro- and retrospective studies into the effects of perturbation on motion analysis parameters and their relation to fall risk are necessary.
In the included articles, the experiments were recorded with traditional motion capture systems as infra-red cameras and force plates in a laboratory setting. However, preferably, people should be observed and measured ambulatory in their natural environment, as also other factors such as ambient lighting, physical or mental fatigue, and stair, obstacle or perturbation type can play a role in increasing fall risk (Startzell et al., 2000; Jacobs, 2016). Inertial Measurement Units (IMU’s) enable ambulant measurements and can identify different locomotion tasks. Hence, the above-mentioned change of stair walking speed and variability in CoM acceleration could be detected with continuous ambulatory monitoring of stair climbing, e.g., by using one IMU sensor on the sacrum (Bolink et al., 2016; Jacobs, 2016; Bartlett and Goldfarb, 2018). Changes in gait initiation can also be detected in ambulatory settings using IMUs (Mancini et al., 2016; King et al., 2017). Such ambulatory measured parameters during challenging locomotion tasks could then be incorporated into current fall risk prediction models to improve accuracy, sensitivity, and specificity of fall predictions (Montesinos et al., 2018).
Most articles focused on spatiotemporal outcome parameters, of which foot clearance and its corresponding variability may indicate a risk of tripping, and a lower walking speed or swing time may indicate higher risk of loss of balance. Only a limited number of studies tried to relate these parameters to other underlying fall risk mechanisms such as Margin of Stability, knee joint motion and moment, or body tilt. Such outcome parameters require assessment of external forces and full-body kinematics with more advanced measurement technologies such as load or pressure plates and 3-dimensional movement capture systems. Also, mental and physical characteristics such as limitations of knee joint range of motion or leg strength, were not assessed in the included articles. While spatiotemporal parameters are relatively easy to assess, for fall prevention, a better understanding of which underlying mechanisms relate to poor performance in challenging locomotion tasks is required.
4.2 Recommendations
To determine candidate prognostic factors assessed from motion analysis of challenging locomotion tasks, long-term follow-up studies of good quality are necessary to avoid bias: i.e., prospective studies with older adults including assessments of mental and physical fitness levels, well described locomotion tasks (also including randomisation and fatigue avoiding strategies) and long-term recording of fall history. Alternatively, retrospective studies could be performed with participants representing the variation within the older population living in the community in terms of fall risk, gender, and fitness level. Furthermore, group sample sizes need to be sufficiently large to ensure statistical power. To be able to compare studies in a meta-analysis, relevant motion analysis parameters should be assessed in a uniform way in future. Based on the findings, the following outcome parameters are suggested:
- Assessment of foot clearance: During stair ascent mainly tripping occurs, while during stair descent loss of control of CoM or slipping are main causes for falls (Ackermans et al., 2021). The included stair climbing studies reported significantly increased foot clearance with age and significantly increased foot clearance variability with age and fall risk (Begg and Sparrow, 2000; Zietz et al., 2011; Ackermans et al., 2019; Francksen et al., 2020). In stair descent older adults ascended with reduced foot contact on the shorter step, which may cause an increased slip risk (Ackermans et al., 2019, 2021; Francksen et al., 2022). Therefore, the percentage of foot length on the stair should be assessed. In obstacle crossing, foot clearance had inconsistent findings.
- Assessment of locomotion phase: In stair climbing and obstacle crossing, stance and double support duration significantly increased with age and fall risk, whereas total step time did not. In obstacle crossing, swing time may indicate task difficulty (Kim and Brunt, 2013). Therefore, preferably phase parameters such as double stance phase (stair climbing, obstacles) and swing duration (obstacles) should be assessed, but not step or stride duration. In perturbations, findings in stance durations are inconsistent. However, in perturbations, postural reaction times significantly increased with age (Martelli et al., 2017; Nachmani et al., 2020) and in obstacle crossings postural reaction times significantly increased with fall risk (Uemura et al., 2011). Therefore, postural reaction time to sudden perturbations or obstacles should be assessed.
- Assessment of velocity: Stair climbing velocity significantly reduced with age and fall risk in both stair ascent and descent (Zietz et al., 2011; Oh-Park et al., 2012; Chiu et al., 2015). Assessment of total stair climbing time, is not recommended since it does not allow for comparison between studies with different stair characteristics. In obstacle crossing, it is not recommended to assess velocity, since no significant difference in walking or crossing speed with fall risk were reported (Pan et al., 2016; Pieruccini-Faria and Montero-Odasso, 2019; Guadagnin et al., 2020).
- Step width and variability: In obstacle crossing, step width significantly reduced with age and fall risk. Step width variability significantly increased with age or fall risk in stair climbing, perturbations, and obstacle crossing (Chen et al., 1991; Zietz et al., 2011; Kazanski et al., 2020). Therefore, assessment of step width and variability should be recommended.
- Assessment of joint angle moment: Joint moments were significantly reduced with age and fall risk for stair climbing and obstacle crossing (Pijnappels et al., 2005; Wang et al., 2010; Novak and Brouwer, 2011), but were not reported for perturbations. Therefore, if ground reaction forces can be assessed, assessment of joint force moments should be recommended.
- Assessment of success rate: Success rate in terms of stepping error, accuracy or success in obstacle crossing significantly reduced with age (Chen et al., 1994; Weerdesteyn et al., 2005; Kim and Brunt, 2013; Caetano et al., 2016), and fall risk (Pijnappels et al., 2005; Guadagnin et al., 2020). Therefore, in situations where success rate can be measured, it should be assessed.
5 Conclusion
We investigated the relationship between fall risk among the older population and their performance during challenging locomotion tasks including stair climbing, perturbations and obstacle crossing. The results from the 36 included articles indicated several candidate motion analysis factors for fall risk prediction, which could also be assessed ambulatory in a more natural environment. Unfortunately, the large variation in assessed outcome parameters resulted in mostly a limited number of studies reporting any given parameter. Furthermore, only 7 perturbation studies were included and only 11 articles studied the effect of fall risk. Therefore, study design recommendations for future fall risk assessment studies and suggestions to promote relevant and uniform motion analysis parameters have been made.
Data Availability
The study is a systematic review reporting results from only previously published scientific papers.
References
- 1.↵
- 2.↵
- 3.↵
- 4.↵
- 5.↵
- 6.↵
- 7.↵
- 8.↵
- 9.↵
- 10.↵
- 11.↵
- 12.↵
- 13.↵
- 14.↵
- 15.↵
- 16.↵
- 17.↵
- 18.↵
- 19.↵
- 20.↵
- 21.↵
- 22.↵
- 23.↵
- 24.↵
- 25.↵
- 26.↵
- 27.↵
- 28.↵
- 29.↵
- 30.↵
- 31.↵
- 32.↵
- 33.↵
- 34.↵
- 35.↵
- 36.↵
- 37.↵
- 38.↵
- 39.↵
- 40.↵
- 41.↵
- 42.↵
- 43.↵
- 44.↵
- 45.↵
- 46.↵
- 47.↵
- 48.↵
- 49.↵
- 50.↵
- 51.↵
- 52.↵
- 53.↵
- 54.↵
- 55.↵
- 56.↵
- 57.↵
- 58.
- 59.↵
- 60.↵
- 61.↵
- 62.↵
- 63.↵
- 64.↵
- 65.↵
- 66.↵
- 67.↵
- 68.↵
- 69.↵
- 70.↵
- 71.↵
- 72.↵
- 73.↵
- 74.↵
- 75.↵
- 76.↵
- 77.↵
- 78.↵
- 79.↵
- 80.↵


