
Abstract
The emergence of SARS-CoV-2 variants has prompted the need for near real-time genomic surveillance to inform public health interventions. In response to this need, the global scientific community, through unprecedented effort, has sequenced over 7 million genomes as of December 2021. The extraordinarily high sampling rate provides a unique opportunity to track the evolution of the virus in near real-time. Here, we present outbreak.info, a platform that can be used to track over 40 million combinations of PANGO lineages and individual mutations, across over 7,000 locations, to provide insights for researchers, public health officials, and the general public. We describe the data pipelines that enable the scalable ingestion and standardization of heterogeneous data on SARS-CoV-2 variants, the server infrastructure that enables the dissemination of the processed data, and the client-side applications that provide intuitive visualizations of the underlying data.
Introduction
In December 2019, a series of cases of pneumonia of unknown origin appeared in Wuhan, China, and on 7 January 2020, the virus responsible for the diseases was identified as a novel coronavirus, SARS-CoV-2 [1]. The first SARS-CoV-2 genome was made publicly available on 10 January 2020 [2]. Since then, the global scientific community, through an unprecedented effort, has sequenced over 7 million genomes as of December 2021 [3]. To keep track of the evolving genetic diversity of SARS-CoV-2, Rambaut et al. developed a dynamic phylogeny-informed nomenclature (PANGO) to classify SARS-CoV-2 lineages [4]. As of January 2022, over 1,800 lineages have been designated and this has enabled public health agencies such as Public Health England (PHE), the Centers for Disease Control (CDC), and the World Health Organization (WHO) to identify Variants of Concern (VOC), Variants of Interest (VOI/VUI), and Variants Under Monitoring (VUM/VBM) based on the phenotypical characterization of these lineages. Currently, there are five designated VOCs: B.1.1.7 (Alpha) lineage resulting in increased transmissibility [5], B.1.351 (Beta) lineage exhibiting immune evasion [6], the P.1 (Gamma) lineage exhibiting immune evasion [7], the B.1.617.2 lineage exhibiting increased transmissibility due to the P681R mutation in the Spike gene [8], and most recently, the B.1.1.529 (Omicron) lineage exhibiting very rapid growth and the ability to substantially avoid antibody neutralization [9,10].
The emergence of SARS-CoV-2 variants has prompted the need for near real-time genomic surveillance to inform public health interventions. In response to this need, thousands of academic, non-academic and public health labs have been depositing sequences on platforms such as GISAID [11]. The extraordinarily high sampling rate provides a unique opportunity to track the evolution of the virus in near real-time. For example, in December 2021, over a million new genomes were submitted to GISAID [12]. Traditionally, phylodynamic approaches have been employed to retrospectively characterize lineage dynamics during outbreaks of viruses such as Zika [13–15], West Nile [16] and Ebola viruses [17,18]. Existing tools like NextStrain [19] and frameworks such as Microreact [20] primarily rely on a phylogeny to elucidate transmission chains and monitor the evolution of the virus. However, these tools were not designed to track thousands of new genomes per day, and given that building phylogenies for large sets of genomes is computationally intensive and time consuming, obtaining timely insights from the data is often problematic [21]. However, the high sampling rate of the virus has opened up the possibility of tracking the pandemic using the available near real-time genomic data without the need for computationally intensive modeling.
Here, we present outbreak.info, a platform that can be used to track over 40 million combinations of PANGO lineages and individual mutations, across over 7,000 locations, to provide insights for researchers, public health officials, and the general public. In the following sections, we describe the data pipelines that enable the scalable ingestion and standardization of heterogeneous data on SARS-CoV-2 variants, the server infrastructure that enables the dissemination of the processed data, and the client-side applications that provide intuitive visualizations of the underlying data.
Results
The growth rate of a given lineage is a function of epidemiology and its intrinsic biological properties (Figure 1A). For example, the B.1.177 lineage, characterized by an A222V mutation in the spike gene, increased in prevalence in Europe during the summer of 2020 [22]. While initially thought to be more transmissible, it was eventually shown that the increase in prevalence was due to a resurgence in travel and not due to increased transmissibility. In contrast, a few months later the B.1.1.7 lineage was shown to be 40-60% more transmissible than previously circulating lineages and this intrinsic biological property led to the rapid growth in its prevalence worldwide [23,24]. Epidemiological factors such as mobility [25,26], mask usage [27], and public health interventions [28] vary over time and across geographies worldwide while biological properties are a function of the mutations that are found in given lineage (Figure 1A). Hence, to maximize the utility of genomic data for surveillance, we built outbreak.info to enable the exploration of genomic data across three dimensions: geography, time, and lineages/mutations. We use the PANGO nomenclature to estimate the prevalence of SARS-CoV-2 lineages over time and at varying geographic scales. Using a phylogenetically-informed nomenclature allows us to determine genetic features such as the “characteristic mutations” of a lineage without directly building a global phylogeny. By not building a global phylogeny, we can update our databases daily using the continuously growing number of SARS-CoV-2 genomes. In addition, we closely track reports from agencies such as the PHE, the CDC and the WHO that designate VOC/VOI/VUMs based on epidemiological analyses. In addition to genomic data, the server also ingests two other types of data: (1) epidemiological data curated by Johns Hopkins University [29], and (2) public literature, clinical trial, protocol, and dataset metadata from sources such as bioRxiv, medRxiv, and LitCovid [30]. Here, we describe how each of these data sources can be used in cohesion to assist in genomic surveillance.

A) Growth rate of a lineage is a function of epidemiology and intrinsic biological properties of a lineage. Further, epidemiology varies over time and by geography while intrinsic biological properties are determined by the mutations present in a given lineage. B) Genomic data is ingested from GISAID, processed using the custom-built data pipeline, Bjorn, and stored on a server which can be accessed via an Application Programming Interface (API). The API is consumed by two clients: A JavaScript based web client and an R package that provides programmatic access by authenticating against GISAID credentials. C) The web interface contains three tools that allow exploration of genomic data across three different dimensions: lineage/mutation, time, and geography.

A) Search and filter options for Lineage/Variant of Concern tracker. B) Prevalence of S:Y145H + S:A222V mutations across different lineages globally. C) Prevalence of AY.4 in the United Kingdom. D) Mutation map showing the characteristic mutations of AY.4. E) Summary statistics of AY.4 lineage. F) Geographic distribution of the cumulative prevalence of AY.4 lineage globally. G) Cumulative prevalence of B.1.1.7 in each country globally. H) Research articles, and datasets related to B.1.1.7.

A) Relative prevalence of all lineages over time in San Diego, California. Total number of sequenced samples collected per day are shown in the bar chart below. B) Relative cumulative prevalence of all lineages over the last 60 days in San Diego. C) Mutation prevalence across the most prevalent lineages in San Diego over the last 60 days. D) Comparison of the prevalence of VOCs grouped by WHO classification: Alpha, Beta, Gamma, and Delta over time in San Diego. E) Daily reported cases in San Diego are shown in the line chart below.
The overall workflow of genomic data is shown in Figure 1B. Genomic data is ingested from the GISAID Initiative, processed via a custom-built data pipeline, Bjorn, and stored on a server which can be accessed via an Application Programming Interface (API). We built two client-side applications, a web interface and an R package which consume this API (Figure 1B). The web interface consists of three main tools focussing on different facets of the underlying genomic data: (1) Lineage and/or Mutation Tracker, (2) Location Tracker, and (3) Lineage Comparison Tool. We designed an opinionated interface for each tool that focuses on one primary dimension of the genomic data with additional customizability of one or more secondary dimensions (Figure 1C). The Lineage and/or Mutation Tracker focus on a specific lineage, mutation or a combination of these. The Location Tracker focuses on a given location and provides a snapshot of currently circulating lineages. Finally, the Lineage Comparison Tool can be used to explore the prevalence of mutations across different lineages. In addition to the web interface, we have built an R package that authenticates against GISAID credentials and allows programmatic access to the processed data for downstream analyses.
Lineage and/or Mutation Tracker
A fundamental part of genomic surveillance is tracking the growth of a lineage over time. Given the geographic variation in epidemiological, social, and economic factors, it is important to estimate variant prevalence at varying geographic scales. The Lineage/Mutation Tracker can be used to dynamically query the temporal and geographic variation in the prevalence of a (i) VOC/VOI and its sublineages (e.g., Delta and its sublineages), (ii) a lineage (e.g., B.1.1.7), (iii) a lineage and one or more mutations (e.g., B.1.1.7 with S:E484K), (iv) a mutation (e.g., S:E484K), or (iv) a group of mutations (e.g., S:E484K and S:N501Y) (Figure 1A). In addition, users can specify various location scales, such as a country, state, or county (or their local equivalents), to estimate the prevalence of a given lineage and/or mutations. To provide meaningful insights from these prevalence estimates, we designed an opinionated interface to address a specific set of questions listed in Table 1.
Location Tracker
Some VOCs have only been regionally dominant. For example, Beta and Gamma were dominant in South Africa [6] and Brazil [33] respectively. Similarly, B.1.621 [34] was only dominant in Columbia, A.2.5 was only dominant in Panama, and B.1.177 exhibited a high growth rate only in European countries due to a resurgence of travel in the summer of 2020 [22,35]. Factors such as the attack rate, population immunity due to previous infectio or vaccination, and social mobility vary from one region to the next and have a significant impact on the growth rates exhibited by a given lineage. To account for such localized factors, it is important to have the ability to track the growth of lineages at different geographic scales. We built the Location Tracker on outbreak.info to facilitate the surveillance of SARS-CoV-2 lineages at a country, state/province, or county/city level. The Location Tracker provides a snapshot of circulating lineages with a focus on the last 60 days, and allows users to compare the prevalence of a customizable set of lineages/mutations over time in that location. Furthermore, the tracker also integrates reported cases over time to provide insights on the impact of growth of various lineages on caseloads in the region. As with the Lineage/Mutation Tracker, we designed the user interface to answer a set of specific questions as shown in Table 2.
Case Study: Outbreak.info as a hypothesis generation tool to investigate geographic variation in lineage dynamics of VOCs
As the pandemic has continued to progress we have seen the emergence of VOCs with significant fitness advantages that were able to outcompete previously circulating lineages. As of January 2022, there have been five designated VOCs: Alpha (B.1.1.7 + sublineages, indicated by *), Beta (B.1.351*), Gamma (P.1*), Delta (B.1.617.2*), and Omicron (B.1.1.529*). Of these, Alpha, Beta and Gamma were estimated to have emerged between September and December 2020 [7,36,37] and were subsequently outcompeted globally by the Delta variant that was first detected in December 2020 [38]. The Omicron lineage, first detected in November 2021 [9], was able to outcompete Delta and grew much more rapidly relative to previous VOCs during their emergence (Figure 4A). Whereas Delta and Omicron variants exhibited high growth rates with little variation globally, Alpha continued to circulate in low prevalence in Brazil and South Africa where Gamma and Beta variants were dominant respectively (Figure 4B, 5C). Additionally, there is geographic variation in the prevalence of sublineages within Delta and Omicron variants. The Location Tracker on outbreak.info can be used to track the growth of VOCs within a given location, thus facilitating the comparison of lineage growth rates across locations. The Location Tracker can also be used to track the relative prevalence of sublineages within these VOCs, shedding light on any geographic variation in these dynamics. Here, we examine trends in the prevalence of the five VOCs globally and we highlight the geographic variation in growth rates of Alpha, Beta, Gamma, Delta, and Omicron variants.

Prevalence of Variants of Concern: Alpha, Beta, Gamma, and Delta lineages over time in the A) Worldwide, B) Brazil, C) South Africa, and D) United States. Relative prevalence of sublineages within Delta variant over time in E) United Kingdom, and F) United States. Relative prevalence of sublineages within the Omicron variant over time in G) United States, H) Denmark, I) Singapore, and J) India.
The earliest samples of the Alpha variant were sequenced in Southern England in late September 2020 [36]. There were multiple introductions of the lineage into the U.S. as early as late November. The Alpha variant showed a transmission advantage of 40-50% in the U.S. [24], in line with observations in the United Kingdom and the Netherlands. In the United States, Alpha was able to outcompete previously circulating lineages and continued to increase in prevalence until the introduction of the Delta variant around April 2021 (Figure 4D). In contrast to the U.S., the Alpha variant circulated at very low prevalence in Brazil, while the Gamma variant remained dominant in the country[7] until the introduction of the Delta variant around April 2021 (Figure 4B). Similarly, in South Africa, the Beta variant continued to spread until the emergence of the Delta variant and the Alpha variant never became dominant (Figure 4C). Whereas the Beta and Gamma variants were able to outcompete Alpha in South Africa and Brazil respectively, Gamma only reached a maximum prevalence of 8% in the U.S. in May 2020, and Beta circulated at a prevalence of <1% (Figure 4D). The growth of a lineage is determined by epidemiological factors such as number of introductions, travel between locations, and by intrinsic biological properties such as transmission advantage or immune evasion. Both Beta and Gamma variants show varying degrees of immune evasion [39]. Regions of Brazil had attack rates as high as 75% in October 2020 [40], indicating that immune evasion was the primary reason for the rapid growth of the P.1 lineage in Brazil. In contrast, states in the U.S. had an estimated attack rate between 0.1% and 16% in June 2020 [41]. Given this difference in attack rates, we can hypothesize that the intrinsic transmission advantage of the Alpha variant was able to outcompete the advantage conferred by immune evasion of Gamma in the U.S., but the opposite was true in Brazil and South Africa. In all three countries, the introduction of the Delta lineage displaced previously circulating Alpha, Beta, and/or Gamma lineages in the summer 2021.
The Delta variant of SARS-CoV-2 was first detected in Maharashtra, India in December 2020 [38], has been shown to be 40%-60% more transmissible than Alpha [42,43], and causes a reduction in vaccine efficacy relative to previously circulating lineages [44]. Vaccination campaigns against COVID-19 started in December 2020 and despite the progress of these campaigns [45], the Delta variant continued to cause a renewed surge in infections globally. The Delta variant report, which can be accessed directly on the landing page of the lineage reports view, can be used to understand the dynamics of its sublineages. Figure 4A shows the global prevalence of the Delta variant over time. The growth reflects the transmission advantage that Delta has over previously circulating lineages including VOCs Alpha, Beta, and Gamma. As the Delta variant continued to spread, its genetic diversity increased and as of January 2022, over 200 sublineages of Delta have been designated [46]. Importantly, the prevalence of these sublineages varies geographically. For example, the most prevalent sublineage of Delta in the United Kingdom was AY.4 (Figure 4E) while in the United States most of the transmission was caused by B.1.617.2 (Figure 4F). There was a steady increase in the prevalence of the AY.4.2 lineage in the United Kingdom [47] (Figure 4E) which led to the close monitoring of this lineage until the recently discovered Omicron variant rapidly displaced the Delta variant globally.
The Omicron variant was first detected in November 2021 by genomic surveillance teams in South Africa and Botswana. This variant was associated with a rapid resurgence of infections in Gauteng Province, South Africa and was designated a VOC by the WHO within 3 days of uploading the first genome [9]. The variant grew in prevalence very rapidly and within three weeks, the variant was detected in 87 countries and as of January 2022, Omicron has a prevalence of over 95% globally (Figure 4A). While increased transmissibility confers a bigger fitness advantage compared to immune evasion when population immunity is low, the opposite is true as population immunity increases either due to vaccination or previous infection [48]. The Omicron variant was found to have a five fold higher chance of reinfection compared to Delta [49] and Omicron infections presented with a higher viral load than wild type but still lower than Delta [50]. As viral load is one of the determinants of transmissibility, this indicates that Omiron is intrinsically not as transmissible as Delta, but it exhibits better immune evasion. This combination gave Omicron a large fitness advantage over Delta as evidenced by its rapid growth rate worldwide (Figure 4A). With the continued spread of the variant, geographic variation in the relative prevalence of its sublineages have emerged. While BA.1 continues to be the dominant sublineage within Omicron globally and in countries such as the United States (Figure 4G), we see the growth of the BA.2 sublineage in Denmark, Singapore, and India (Figure 4H, I, J). While there are no known phenotypic differences between BA.1 and BA.2, it remains to be seen if BA.2 will continue to grow in relative prevalence within Omicron globally.
This case study illustrates how outbreak.info can be used to not only track and compare the prevalence of lineages across locations but to also derive and support hypotheses regarding the complex interplay between epidemiology and the intrinsic phenotypic characteristics of emerging SARS-CoV-2 lineages as the virus continues to spread.
Discussion
We developed a platform, outbreak.info, for the continuous monitoring of SARS-CoV-2 variants, based on the integration of three main types of data: genomic data, epidemiological data, and metadata from publicly available resources. For each of these data types, we built pipelines to ingest data from their primary source(s): Bjorn, to ingest genomic data from GISAID [12] via their API feed, EpiData pipeline to ingest epidemiological data from Johns Hopkins University [29], and individual parsers to ingest metadata on published literature, clinical trials, and datasets from many data repositories such as LitCovid [51], bioRxiv [52], medRxiv [53], Protein Data Bank [54], and clinicaltrials.gov [55]. In addition, we use the data pipelines to standardize quantities such as dates, and geographics identifiers, to enable cross-linking data across different sources.
We designed outbreak.info keeping four goals in mind: Scalability of the application programming interface (API) as existing data sources increase in size and new data sources are incorporated, Interactivity via responsive User interface (UI) elements powered by a high performance API, Interpretability via intuitive visualization of data, and Reusability by providing access to the underlying data through an R package (Figure 5). To scale with the increasing size of existing data sources and the heterogeneity of newly emerging data sources, we used the BioThings [56] framework that leverages the powerful search capabilities of Elasticsearch [57] Python-based toolkit to easily generate high performance APIs from a number of data sources. We developed customized D3.js [58] visualizations to answer specific questions of interest to epidemiologists, researchers, and public health officials based on user interviews with these audiences followed by iteration guided by usability studies. These visualizations are all interactive and customizable, allowing users to create specific reports for particular locations, variants, and time windows.

Software infrastructure of outbreak.info. The infrastructure can be broadly divided into (1) Data ingestion pipelines, (2) Server side hosting the database and API server, and (3) Client-side applications tha use the API from the server.
Genomic sampling varies globally with the vast majority of sequences coming from high income countries; even within well sampled regions, there is geographic and temporal variation [11]. To communicate the increased uncertainty due to low sampling, we calculate confidence intervals of estimates wherever applicable, provide histograms of sampling density, and mask data when there are very few data points available. Furthermore, sampling can be selective as samples of the Alpha variant and BA.1 lineage (sublineage of Omicron) show S gene target failure when using a widely used qPCR assay ref. Such sampling biases impact the insights that can be derived from quantities such as the prevalence of a lineage/mutation. We have tried to communicate these limitations through a dedicated “caveats” page with warnings regarding the interpretation of data interspersed throughout the interface. Lastly, to maximize the accessibility of the processed data, we also built an R package which can be used to authenticate against GISAID credentials and programmatically access the API, enabling researchers to access the data within R scripts for downstream analyses.
Conclusion
The Omicron variant which was first detected in late November has outcompeted Delta and is currently the most dominant lineage globally. However, it is important to note that regardless of how prevalent previously circulating VOCs were, all five VOCs emerged independent of each other. Hence, continued surveillance of all currently circulating lineages is of utmost importance to public health globally - particularly as SARS-CoV-2 continues to spread and evolve worldwide. We developed outbreak.info as a platform to track the evolving mutational landscape of SARS-CoV-2 at varying temporal and geographic scales. Outbreak.info offers a high degree of customizability, allowing users to interrogate the underlying data to answer specific biological questions and use the platform as a hypothesis generation tool. The user interface has been designed to maximize interpretability by researchers, epidemiologists, and public health officials. The high-performance API in outbreak.info, available through an R package, increases the accessibility of the underlying data for downstream modeling analyses. The platform has been developed to ensure scalability with growing size of primary data sources and interoperability between different types of primary data, thus, allowing users to track the pandemic comprehensively under a unified framework.
Methods
Ingestion of genomic data
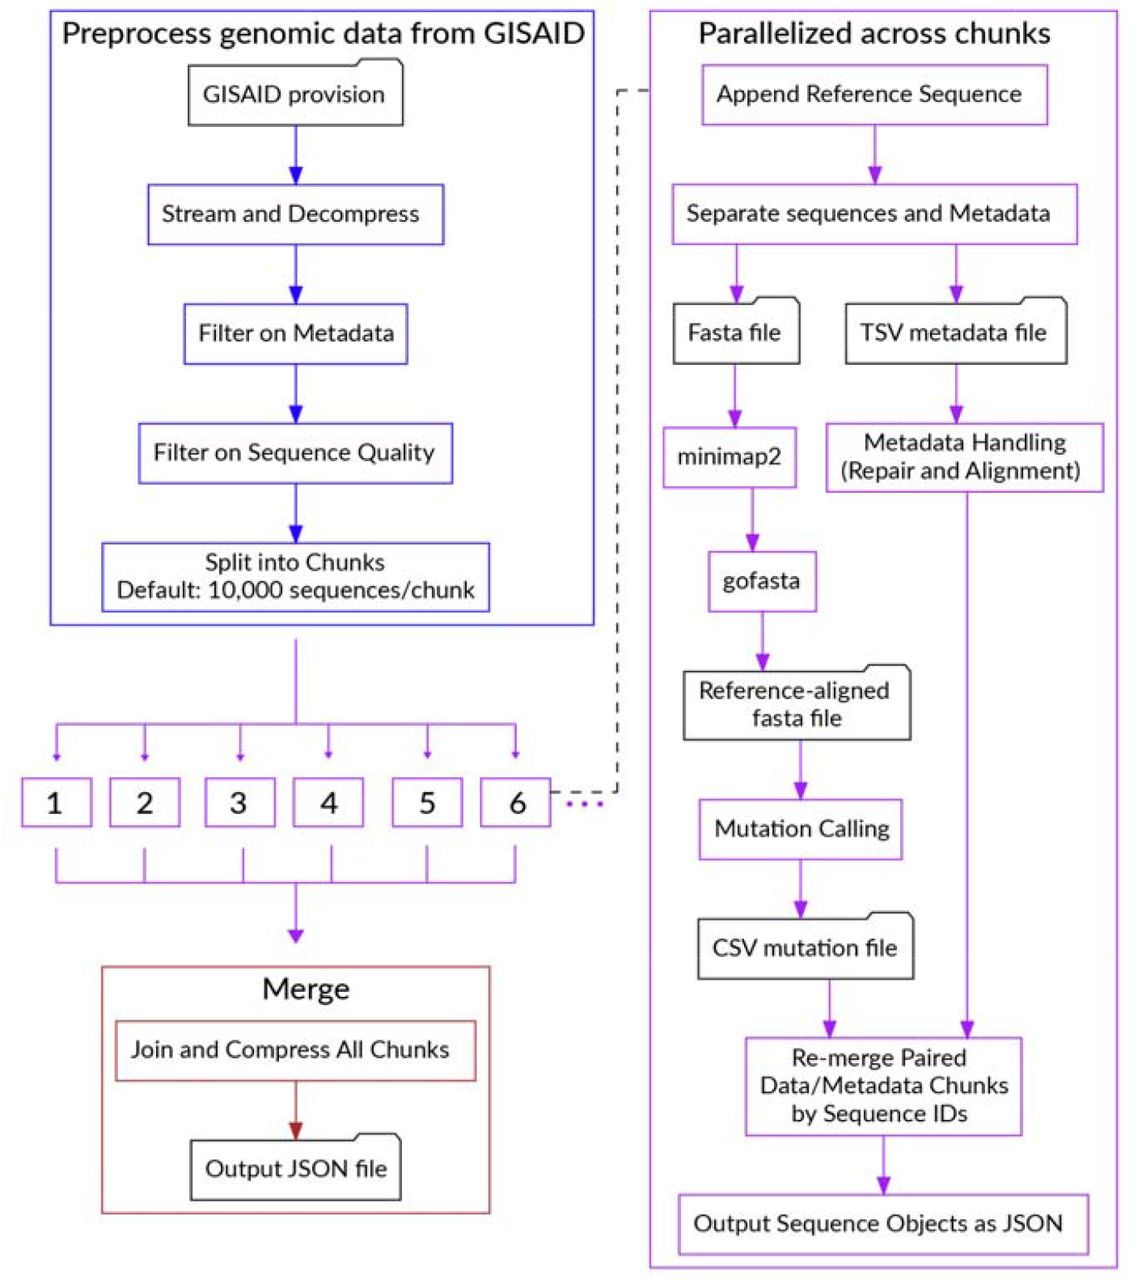
We built a data pipeline, Bjorn, to count mutations from a given set of genomes in a scalable manner daily (Figure 6). The pipeline consists of the following steps: (1) Download SARS-CoV-2 genomes from GISAID API; (2) Divide sequences into chunks of 10,000; (3) Align these sequences using minimap2 [59]; (4) Convert the alignment into a FASTA file using gofasta (https://github.com/virus-evolution/gofasta); (5) count mutations and deletions from this alignment; (6) standardize and filter the metadata: country, division, location, pangolin lineage, date of collection, and date of submission and (7) combine results from all chunks and convert to a JSON object. We standardized geographic identifiers using shapefiles from GADM [60]. The final JSON object is loaded into an Elasticsearch index within the BioThings framework [57]. The code for Bjorn is available at https://github.com/andersen-lab/bjorn.

Flowchart describing the steps in Bjorn.
Ingestion of epidemiological data
We built the EpiData pipeline to ingest reported global cases, and deaths from Johns Hopkins University [29]. We used shapefiles from Natural Earth [61] to standardize geographic identifiers, and obtain populations for countries and states outside the U.S. For the U.S., we used the county level shapefiles and population estimates from the 2019 Census to standardize geographic identifiers and get population estimates. We standardized reported date formats, and geographic identifiers across the two resources. The code for the EpiData pipeline is available at https://github.com/outbreak-info/biothings_covid19.
Calculation of confidence intervals on prevalence
Most estimates of prevalence on outbreak.info are binomial proportions. We calculate 95% confidence intervals for these estimates using Jeffrey’s Interval, the 2.5 and 97.5 quantiles of β(□ + 0.5, □ - □ + 0.5) where x is the number of successes and n is the number of trials.
Creation of outbreak.info API
In order to scale with the increasing size of existing data sources and the heterogeneity of newly emerging data sources, we used the BioThings [56] framework [57]. The JSON outputs of our data pipelines are ingested by the BioThings framework and the processed data is stored in individual Elasticsearch indices. A Tornado server is used to create API endpoints that leverage the search capabilities of Elasticsearch to perform complex aggregations of the underlying data. These API endpoints allow the client-side applications to query the underlying data within reasonable query times while accounting for the scale of the ingested data. The BioThings Hub maintains historical data by default, allowing us to roll back to previous data backups if issues are discovered with new data after they are deployed. The code for the server-side application is available at https://github.com/outbreak-info/outbreak.api.
outbreak.info web application
The web application was built using Vue.js [62], a model–view–viewmodel JavaScript framework which enables the two-way binding of user interface elements and the underlying data allowing the user interface to reflect any changes in underlying data and vice versa. The client-side application uses the high-performance API to interactively perform operations on the database. Customized data visualizations on the client were built using D3.js [58], giving us the ability to develop novel, and intuitive visual elements as part of the user interface. We designed these visualizations to answer specific questions of interest to epidemiologists, researchers, and public health officials. We further added functionality to enable the 1-click copy or download of every chart in the interface as a png or svg. The code for the client-side application is available at https://github.com/outbreak-info/outbreak.info.
R package
We developed an R package for outbreak.info to allow researchers and other individuals to easily access the data via the API for downstream analyses and visualizations. The R package is composed of three parts: functions that allow the user to access genomic data, functions to access the epidemiological data, and functions to access the Research Library metadata. They all consist of a base function that contains arguments for all possible parameters that can be used to query the API. While users can utilize this base function directly to access data, several wrapper functions are available that inherit the arguments from the base function in addition to pre-specified parameters to simplify the process of querying the API. For example, while getGenomicData() can be used directly to access data regarding the daily global prevalence of a specified lineage, doing so would require a user to be familiar with the name of the endpoint as specified in the API URL (in this case, global-prevalence). Therefore, these wrapper functions allow users to easily and quickly obtain the data they need.
In addition, as the API queries location by ISO3 code, rather than by location name, two functions have been created that allow users to forgo the step of searching for the ISO3 code themselves: getISO3Code() and getISO3Code_genomic(). The latter function uses the genomics API endpoint to obtain the ISO3 code for a given location. The ISO3 code can be obtained with either a full or incomplete location name; in the latter case, the user will be provided a list of matching locations and must specify the location they are interested in. This function is embedded in the parent getGenomicData() function, and is therefore inherited in all wrapper functions. Therefore, searching for data by location in the R package replicates the experience on the client side web application. Documentation is available at https://outbreak-info.github.io/R-outbreak-info with vignettes located at https://outbreak-info.github.io/R-outbreak-info/articles/index.html, and the R package can be downloaded using the devtools function install_github(“outbreak-info/R-outbreak-info”).
Data Availability
All data produced are available online at https://outbreak.info/
Acknowledgements
We thank the technical team, sequence curators, and administrators of the GISAID database for helping us with this project and supporting rapid and transparent sharing of genomic data during the COVID-19 pandemic. We thank our colleagues for sharing genomic data on GISAID. This work was supported by the National Institute for Allergy and Infectious Diseases (5 U19 AI135995-02, 5 U19 AI135995-03S2, 5 U19 AI135995-04S3, R01 AI162611, R01 AI153044), National Center For Advancing Translational Sciences (5 U24 TR002306), and Centers for Disease Control and Prevention (75D30120C09795).
References


