
Summary
Currently, obesity treatment rests on the “calories-in, calories-out” (CICO) rule, formally named the energy balance theory (EBT). It maintains that body weight (BW) increases as food calories are greater than expended calories but decreases when the opposite occurs; hence, weight stability is expected at energy balance meaning that over time energy-in equals energy-out.1 It follows that dietary regimens with identical energy content should evoke similar amounts of weight and fat loss with only minor differences that follow from diet’s macronutrient composition7, e.g., diet-induced glycogen depletion and water excretion. A vast collection of evidence shows, however, that low-carbohydrate diets typically result in much greater weight and fat loss than isocaloric low-fat diets.7, 8, 9, 10, 11, 12 Furthermore, our recent mathematical analysis demonstrated that weight stability coincides with a persistent energy imbalance and not otherwise.4 As an alternative, the mass balance model (MBM) was proposed that fitted weight loss data and explained the often superior weight loss evoked by low-carbohydrate diets versus low-fat diets.4 Here, we expand on these observations by computationally contrasting the predictions of both models in two scenarios described in the literature3, 16: altering the diet’s macronutrient composition while energy intake is kept at weight maintenance level; and the weight loss response as diet composition is changed under untreated type 1 diabetes. Our results indicate that MBM predictions are remarkably accurate while those of the EBT are clearly erroneous. These findings may represent the beginning of a paradigm shift in obesity research.
Introduction
“Four stages of acceptance: 1) this is worthless nonsense; 2) this is an interesting, but perverse, point of view; 3) this is true, but quite unimportant; 4) I always said so.” -- JBS Haldane
Macronutrients – proteins, fats and carbohydrates – are an important part of a diet, and as such, have been the subject of a great deal of discussion and controversy, especially among obesity researchers. According to the energy balance theory (EBT), “[a] fundamental principle of nutrition and metabolism is that body weight change is associated with an imbalance between the energy content of food eaten and energy expended by the body to maintain life and to perform physical work.”1 Many current approaches to obesity treatment are based on the EBT; however, neither behavioral prevention nor behavioral treatment is generally successful in practice. Furthermore, this theory has major limitations for explaining obesity, as reviewed by Wells and Siervo.2 Weight stable obese individuals, for example, may experience substantial changes in body weight as a reaction to isocaloric modifications in diet. In many instances these body mass alterations are far greater than those expected from the macronutrient-induced changes in total body water.3 Thus, the EBT is rendered inadequate in these circumstances.
Arencibia-Albite4 has recently used mathematical methods to investigate EBT’s central claim:
As energy balance approaches zero body weight becomes stable.
The conclusion of this paper is highly polemical – to put it mildly – and possibly represents the beginning of a paradigm shift:
Body weight stability coincides with a persistent energy imbalance which is negative under low-fat diets but positive under low-carbohydrate diets.
This signifies, then, that the EBT is an incorrect theory, and also explains why in numerous well-controlled studies negative energy balance measurements are frequently observed under a “normal diet” in weight stable populations.5, 6 These findings do not represent a violation of the First Law of Thermodynamics, as it allows for any open system to express a positive or negative energy balance under a null mass change (see Figure 1 in Arencibia-Albite4). As an alternative to the EBT, the mass balance model (MBM) of obesity was proposed. It maintains in qualitative terms that body weight fluctuations are ultimately dependent on the difference between daily nutrient mass intake and daily mass excretion (e.g., elimination of macronutrient oxidation products) and NOT on energy imbalance. In its mathematical form the MBM fitted weight loss data from dietary interventions of low-carbohydrate diets (LCDs) versus isocaloric low-fat diets (LFDs) leading to a simple and convincing explanation for the often superior weight loss evoked by LCDs over LFDs (Figure 1).4 The current work compares the MBM predictions against those derived from the EBT; and it is convincingly demonstrated that in the experimental settings where the EBT makes erroneous forecasts the MBM results in remarkably accurate predictions.

A. Two hypothetical overweight 90kg adult males with identical body composition and weight maintenance energy intakes (2 750 kcal/day; 35% fat (F), 50% carbohydrate (C), 15% protein (P)) initiate two distinct isocaloric diets (2 000 kcal/day): a low-fat diet (LFD; 20% F, 65% C, 15% P) vs. a low-carbohydrate diet (LFD; 20% F, 65% C, 15% P). Consistent with published feeding data7, 8, 9, 10, 11, 12, the MBM predicts that the LCD results in greater weight loss in contrast to the LFD. Model parameters are as follows: BW0 = 90kg, FM0 = 22.5kg, nEPM = 1.41kg, Floss= 0.030833, PAL = 1.5, VO2 = 4.32 L/[kg × day] B. The figure depicts the body fat (BF) percentage changes that correspond to panel A. C. As shown, the LCD mass intake (min) is small relative to the eliminated mass (mout) and so the net daily mass loss is large (i.e., |min – mout|). In the LFD the net daily mass loss is, however, not as efficient since min cancels out a substantial fraction of mout decelerating weight loss. LCDs are thus more effective in maximizing the net daily mass loss relative to LFDs and consequently the former manifest a substantially larger cumulative weight loss than the latter. D. Daily energy expenditure (EE) data from panel A. The horizontal line represents the daily energy intake. According to the EBT, this graph suggests that the subject in the LFD should lose more weight than the one in the LCD, which is not the case as illustrated in panel A. Energy imbalance is, therefore, not predicting the weight loss outcome in this intervention.
Materials and Methods
Mass Balance Model (MBM)
For model derivation and details consult Arencibia-Albite4 but, briefly, daily body weight (BW, in kg) fluctuations are given by:
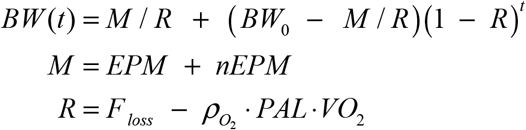 where t is time in days; M is the average daily mass intake defined as the sum of the energy-providing mass (EPM; e.g., F, C and P) plus the non-energy-providing mass (nEPM; i.e., water, insoluble fiber, vitamins and minerals); R is the average relative daily rate of mass excretion free of total daily O2 uptake; BW0 is the initial body weight; Floss is the average relative daily rate of mass excretion that includes of total daily O2 uptake;
  is O2 density in kg/L at 270 C and 1 ATM; PAL is a dimensionless number that represents the physical activity level computed as the ratio of total daily O2 uptake over the total daily resting O2 consumption; and VO2 is the specific daily resting O2 uptake in L/(kg × day).
The EMP parameter is adjusted according to:
 where EI is the energy intake; 0 ≤ xi ≤ 1 is the energy fraction from i = C, F, P; and ρi is the energy density of i with ρC = 4.2 kcal / g, ρF = 9.4 kcal / g, ρC = 4.7 kcal / g. To simulate pancreatic β-cell death xC = 0 as the bulk of ingested glucose is lost through urination.
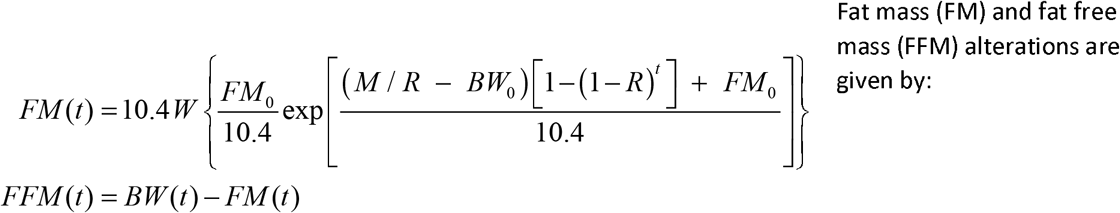 where FM0 is the initial fat mass and W is the lambert W function.
In MBM simulations daily energy expenditure (EE) can be estimated by

The first term at the right-hand side can approximated with the diet’s macronutrient composition and the following Weir formula13

Energy Balance Theory (EBT)
The quantitative form of the EBT use in this study is that of the United States National Institute of Health (NIH) Body Weight Planner developed by Hall et al.14 A succinct model description is given below.
Glycogen (G), extracellular fluid (ECF), body fat (Fb), lean tissue (L) and adaptive thermogenesis (AT) are modeled by following system of equations:
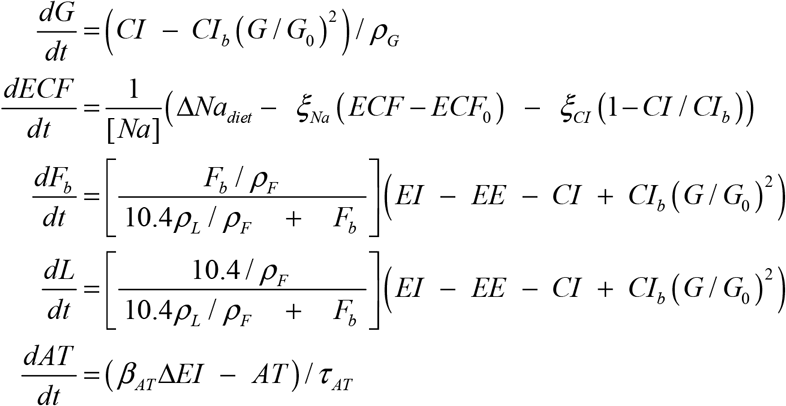 where CIb is the carbohydrate energy intake (CI) at energy balance; G0 is the initial body glycogen amount; ρG is the glycogen energy density (4.2 kcal/g); [Na] is the extracellular Na concentration (3.22 mg/ml); ξNa is a ECF Na excretion constant (3 000 mg/[ml × day]); ξCI CI dependent Na excretion constant (4 000 mg/[ml × day]); ρL Is the energy density of lean tissue (1.815kcal/g); τ AT is the AT time constant (14 days); and βAT = 0.14 is the AT coefficient.
EE is defined as
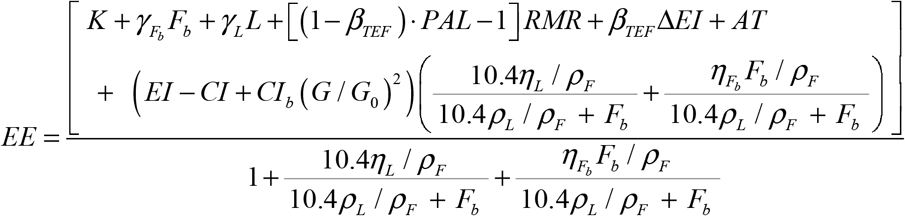 where K is arbitrary constant determined to achieved energy balance at BW0;
 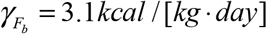 is the specific body fat metabolic rate coefficient; γ L = 21.99 kcal / [kg · day] is the specific lean tissue metabolic rate coefficient; βTEF = 0.1is the thermic effect of feeding coefficient; RMR = 19.7(BW − Fb) + 413 is Mifflin et al. 15 resting metabolic rate formula; ηL = 229.446 kcal / kgz lean tissue synthesis efficacy; and
 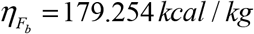 fat tissue synthesis efficacy. The body weight at time t is obtained by the following sum

To simulate pancreatic β-cell death CI = 0, as majority of the ingested glucose is lost through urination. The system of differential equations was solved using the fourth order Runge-Kutta method with a time step of 1 day.
Results
The Figure 2 A uses the MBM to simulate the effect of exchanging a high-carbohydrate diet (HCD) for an isocaloric very-low-carbohydrate diet (VLCD) in a weight-stable 70kg individual. Under the HCD (day 150-400), body weight gradually increases to 73kg. However, after beginning the isocaloric VLCD (day 400), body weight decreases towards a steady value of 67.5kg. Figure 2 B repeats the simulation in panel A, but with the Hall et al.14 model of the EBT. This model indicates, in general, that isocaloric perturbations only elicit non-significant alterations in body weight that are mostly a consequence of changes in extracellular fluid (ECF) and stored glycogen (Gly, Figure 2 C1). In such cases, therefore, changes in body composition are expected to be nearly undetectable (Figure 2 C2). For further details, see the figure legend.

A. MBM response to exchanging a HCD for an isocaloric VLCD. BW is stable at 70 kg with EI = 2 000 kcal during 150 days (control: 50% F, 35% C, 15% P). The daily carbohydrate mass intake (CMI) is 167g. At day 150 EI = 2 000 kcal but CMI has increased by 143g as the control diet is exchange for a HCD (20% F, 65% C, 15% P). On day 400, EI = 2 000 kcal but the diet is exchange again but for a VLCD (75% F, 10% C, 15% P). Here CMI decreases by 262g. Model parameters are as follows: BW0 = 70kg, FM0 = 14kg, nEPM = 1.5kg, Floss = 0.034942857, PAL = 1.5, VO2 = 4.464 L/[kg × day]. B. EBT response to the same perturbations as in panel A. Initial conditions are as follows: K = 547.2925, BW(0) = 70kg, Fb(0) = 14kg, L(0) = 36.012kg, ECF(0)=19.486kg, AT(0) = 0, G(0) = 0.5kg, PAL =1.5 C1. According to the EBT, majority of the weight change under an isocaloric perturbations result from changes in extracellular fluid (ECF) and stored glycogen (Gly) that stabilizes within few days. C2. MBM predicts that BF evolves in parallel to the weight change direction. In contrast, the EBT predicts that, under isocaloric perturbations, BF evolves according to the amount of fat intake (FI). D1. MBM predicts that the weight loss magnitude evoked by pancreatic β-cell death is dependent on the diet’s macronutrient composition. Model parameters are as in A. D2. The EBT predicts that changes in the diet’s macronutrient distribution will elicit measurable changes in the rate and magnitude of weight loss after β-cell death but not as potent as those predicted by the MBM. Initial conditions are as in B.
Another interesting aspect of the MBM is its capacity to account for the degree of weight loss observed at the onset of type 1 diabetes (T1D). Before the discovery of insulin, a common dietary treatment of T1D was a very-low-carbohydrate diet/high-fat diet which slowed down and reduced the excessive weight loss while alleviating the classical symptoms of polyuria, polyphagia and polydipsia [16]. The Figure 2 D1 shows that the MBM explains the weight loss associated with the onset of T1D and also makes predictions consistent with the diabetes treatment during the pre-insulin era. The EBT, however, predicts a substantial weight loss at T1D onset even if the pre-onset diet is a VLCD (Figure 2 D2). For further details, see the figure legend.
Kong et al.3 have recently published a well-controlled feeding study that allows to the test the validity of the predictions made by the MBM and EBT. Their young female subjects (age: 21± standard deviation [SD]: 3.7 years, weight: 65.5 ± SD: 7.7 kg, body mass index: 24.9 ± SD: 2.7 kg/m2) were weight-stable for 4 weeks under a normal diet (ND: 1 967kacl ± SD: 362kcal; F 44% ± SD: 7.6%, C 39.6% ± SD: 5.8%, 15.4%± SD: 3.3%) and then switched to an isocaloric ketogenic diet (KD 1 817kacl ± SD: 285kcal; F 69% ± SD: 5.4%, C 9.2% ± SD: 4.8%, 21.9%± SD: 3.4%) for another 4 weeks leading to a substantial reduced body weight (– 2.9 kg) and body fat percentage (– 2.0%).
Figure 3 A1, A2 and A3 simulate Kong et al.3 data using the Hall et al.14 model of the EBT. Here the KD decreases body weight by 1.71Kg (Figure 3 A1) which is mainly a result of changes in ECF and stored glycogen (Figure 3 A2). In such case, the EBT predicts a slight increase in body fat percentage (Figure 3 A2). Figure 3 B1 simulates Kong et al.3 data using the MBM. As illustrated, this model predicts a much larger drop in body weight (–3.05kg) under KD than the EBT. Contrary to the EBT, however, the MBM predicts a drop in body fat percentage of about 1.6%. This signifies, therefore, that at the MBM leads to more accurate predictions in than those made by the EBT.

A1. The figure utilizes the EBT to simulate Kong et al.3 data. During the ND period (days 0-30) energy balance (EB, red curve) is zero. After day 30 EB becomes negative under the KD resulting in a cumulative weight loss of 1.71kg at day 60. Initial conditions are as follows: K = 892.7146, BW(0) = 65.5kg, Fb(0) = 22.925kg, L(0) = 25.698kg, ECF(0) = 16.375kg, AT(0) = 0, G(0) = 0.5kg, PAL =1.5. A2. The EBT predicts that – although the KD results in weight loss – BF increases since FI has been augmented by 41g. A3. During the ND total glycogen is 500g but after the KD this amount has dropped by 280.25g. ECF has also decreased by 1.076kg. These quantities add to 1.35525kg = 0.28025kg + 1.076kg. Consequently, of the 1.71kg weight loss in A1, 0.35475kg = 1.71kg – 1.35525kg are from other mass sources (0.2436 kg fat mass + 0.11115 kg fat-free mass = 0.35475kg). According to the EBT, fat mass has in fact decreased; however, only by slight amount since FI has been augmented during the KD. Consequently, as the decline in fat-free mass is much larger than that of fat mass, BF increases as in A2. B1. The figure utilizes the MBM to simulate Kong et al.3 data. During the ND period (days 0-30) mass balance (MB, red curve) is zero. After day 30 MB becomes negative under the KD resulting in a cumulative weight loss of 3.05kg at day 60. Model parameters are as follows: BW0 = 65.5kg, FM0 = 22.925kg, nEPMND = 1kg, nEPMKD =0.96kg, Floss= 0.029078, PAL = 1.5, VO2 = 4.32 L/[kg × day] B2. According to the MBM, of the 3.05kg of weight loss 2.07kg came from fat and 0.98kg from fat-free mass. Even though FI has increased the decline in fat-free mass is much smaller than that of fat mass and thus BF decreases as shown.
Discussion
According to the EBT, at energy balance, changes in macronutrient composition elicit non-substantial changes in body weight. These alterations are assumed to be secondary to changes in ECF and glycogen that follow from adjustments in the diet’s natrium (Na) content and carbohydrate intake.1, 7 The EBT also claims that body composition alterations, under these circumstances, are expected to be small but to occur in parallel to the amount of dietary fat intake (see Figure 2 C2). Consequently, from the EBT perspective, the MBM simulations (see Figure 2 A and C2) are unrealistic, as body weight and body fat alterations are much greater than those predicted when energy balance is assumed to be present. If such an argument is definitive, then the accuracy of EBT predictions should always exceed those made by the MBM. Figure 3 illustrates, however, that this is clearly not the case.
Moreover, the EBT implicitly asserts that blood leptin concentration should be minimally affected when arbitrary subject switches from a weight-maintenance standard diet to an isocaloric ketogenic diet since, as argue by this theory, under such conditions fat mass decline is insignificant (see Figure 3 A2). In contrast, the MBM predicts a substantial drop in leptin levels since this model indicates that this type of isocaloric exchange results in a substantial drop in fat mass. Indeed, a recent well-controlled feeding trial by Kong et al.3 showed that the interchange of a weight-preserving normal diet for an isocaloric ketogenic diet evokes a significant reduction in leptin levels.
In addition, the MBM simulations on pancreatic β-cell death are consistent with a review of case histories from the pre-insulin era illustrating that VLCDs could result in some weight gain after the onset of T1D.16 Elliot Proctor Joslin, for example, was the first United States medical doctor that specialized in diabetes treatment during this era. Although anecdotal, one of his diabetic patients, Mary H., reportedly gained nearly 3kg of body weight while consuming a diet containing solely protein and fat. The EBT simulations, in contrast, do not predict such therapeutic effect.
Numerous examples in the weight management literature show that the amount of weight loss is far greater in low-carbohydrate diets (LCDs) compared to isocaloric low-fat diets (LFDs). 7, 8, 9, 10, 11, 12 According to the EBT, this can only occur if the energy expenditure under LCDs is larger than that in LFDs. However, in many of these dietary interventions non-significant differences are found between the energy expenditures of these diets.7, 12, 17, 18, 19 Researchers that subscribe to the EBT, therefore, argue that in such cases the most likely explanation of the observed superior weight loss is the result of energy intake underreporting by low-fat dieters.12 This claim has encountered minimal opposition since it is widely accepted that the majority of the energy intake recording devices (e.g., self-reported food records) are biased toward underestimation.5, 6 Two alternative models, however, may explain the apparent weight loss advantage of LCDs over isocaloric LFDs: the carbohydrate-insulin model (CIM) of obesity20 and the MBM4.
The CIM postulates that high-carbohydrate intake elevates insulin levels leading to the activation of complex neuroendocrine responses that drive body fat deposition, increase appetite and decrease energy expenditure17; which, according to the EBT, explains the persistent weight gain over time observed in obese subjects. Conversely, LCDs, by significantly decreasing circulating insulin levels, should increase energy expenditure by augmenting fat oxidation, which – as argued by CIM advocates – accounts for the greater and faster weight loss observed in feeding trails of LCDs vs. isocaloric LFDs. The above claims are open to discussion, however, as evidence shows that obese individuals manifest a highly elevated energy expenditure relative to normal weight subjects21, plus, as already mentioned, the predominant evidence indicates that no significant energy expenditures differences exist between diets. 7, 12, 17, 18, 19 A recent meta-analysis by Ludwig et al.22 suggests that an adaptation period of at least 14 days may be required in order to LCDs to elevate energy expenditure. If this is the case, then one would expect a slow decay of the respiratory quotient (RQ) toward 0.71 since this would reflect the gradual metabolic dependence on fat as the main energy fuel. In ketogenic diets, however, the RQ reaches a steady state within the first week and continuous to be stable for at least three more weeks.17 Taken together, it seems that the LCDs enhanced weight loss is unlikely to be a consequence of an augmented energy expenditure as proposed by the CIM.
In contrast, the MBM describes body weight fluctuations as a mass imbalance problem. Specifically, when macronutrient mass intake exceeds the excretion of macronutrient oxidation products body weight increases and – obviously – vice versa. Body weight stability is, hence, expected as over time the average consumed mass equals the average eliminated mass. Our model arrives from the following long-standing observations:
1. The physiological/biochemical activity that decreases body weight is the excretion of oxidation products and not energy expenditure.23
This is exemplified in the oxidation of a “general” triglyceride molecule

The mass entering this reaction is (in g/mol)
 whereas mass exiting the reaction is only present in the reaction products
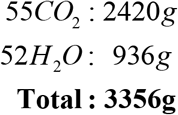 and not in the dissipated heat (i.e., Calories). Therefore, body mass decreases as the body excretes or eliminates oxidation products but not as consequence of the heat content in the energy expenditure.
2. The food property that has the capacity to increases body weight is its mass and not its potential nutritional energy
For instance, the absorption and retention within body cells of 1 gram of fat, carbohydrate or protein will increase body mass by exactly 1 gram. This observation is independent of the potential caloric content ascribe to the macronutrient; according to the Law of Conservation of Mass, the absorbed macronutrient mass cannot be destroyed and, thus, it will contribute to total body mass as long as it remains within the body. Such contribution ends, however, when the macronutrient is eliminated from the body either as products of metabolic oxidation (e.g., H2O and CO2) or in other forms (e.g., shedding of dead skin cells fill with keratin protein).
3. By points 1 and 2 it follows that body weight fluctuations can be described by the difference between daily mass intake and daily mass excretion
Although at first sight this statement may seem not to have far-reaching consequences, Arencibia-Albite4 has shown that when translated into mathematical form it fits body weight and fat mass data from isocaloric diet trails of LCDs vs. LFDs, and also results in predictions that are not evident from the qualitative inspection of points 1, 2 and 3. The current work further substantiates such predictions and demonstrates that MBM-based simulations result in highly realistic forecasts in settings where the EBT-based simulations collapse.
Conclusions
In summary, our model (MBM), by its razor-sharp yet simple logic, seems to be perfectly able to account for the deferential weight loss among isocaloric diets. The obesity community is trying to explain such “surprising” findings by invoking complex signaling pathways that completely ignore the fundamental rule in science: the Occam’s razor (novacula Occami), i.e., the simplest explanation is usually the right one. More specifically, “entities should not be multiplied without necessity”, a notion attributed to English Franciscan friar William of Ockham. Nevertheless, we are certainly not claiming that our model is definitive, or downplaying the emergent and promising therapeutic value of LCDs, but rather to stimulate researchers around the world to acknowledge that the widely accepted EBT is incorrect.
The daily intake of macronutrient mass is, obviously, influenced by the ever-present interplay between the environment and genes; thus, it is important to realize that the MBM makes no claims regarding the behavioral aspects of obesity. Certainly, food processing, distribution, marketing, education, etc. plays a big role in current obesity epidemics.
Data Availability
N/A.
Authors contribution
Study concept and designing: Manninen, Arencibia-Albite
Acquisition of data: Manninen, Arencibia-Albite
Statistical analysis and interpretation of data: Manninen, Arencibia-Albite
Drafting the manuscript: Manninen, Arencibia-Albite
Critical revision of the manuscript for important intellectual content: Manninen, Arencibia-Albite
Administrative, technical or material support: Manninen, Arencibia-Albite.
Study supervision: N/A.
Funding sources
This research did not receive any specific grant from funding agencies in the public, commercial, or not-for-profit sectors.
Declaration of competing interests
The authors declare that they have no competing interests.
List of abbreviations
- MBM
- mass balance model
- MB
- mass balance
- EBT
- energy balance theory
- FFM
- fat-free mass
- FM
- fat mass
- CIM
- carbohydrate-insulin model
- EPM
- energy-providing mass
- VLCD
- very-low-carbohydrate diet
- KD
- ketogenic diet
- HCD
- high-carbohydrate diet
- ND
- “normal diet”
- BW
- body weight
- BF
- body fat
- EI
- energy intake
- EE
- energy expenditure
- T1D
- type 1 diabetes
- ECF
- extra cellular fluid
- Gly
- glycogen
- nEPM
- non-energy-providing mass
- AT
- adaptive thermogenesis
- PAL
- physical activity level
- RQ
- respiratory quotient
References


