
Abstract
Purpose Circulating tumor cells (CTCs) have a tremendous potential for diagnosis and treatment of breast cancer patients. Here, we performed a unique analysis of all atypical circulating cells isolated with a filtration-based technology from metastatic breast cancer (mBC) patients.
Patients and methods The PERMED-01 study enrolled patients with mBC, refractory to systemic therapy, and with an accessible lesion to biopsy. We analyzed atypical circulating cells isolated from patients’ blood at the time of inclusion using Screencell® Cyto device. For 23 out of 91 analyzed patients, this was completed by advanced immunofluorescence staining of atypical circulating cells. Subsets cut-offs were established using a two-component Gaussian finite Mixture Model, and evaluated for correlation with clinico-pathological data, including progression-free survival (PFS) and overall survival (OS).
Results Three subsets of atypical circulating cells, absent from controls (n=7), were observed in cancer patients (n=91): isolated (iCTCs), Clusters (CTM), and Giant CTCs (gCTCs). CTCs’ median number was 8.33 per mL. Co-expression of stem and drug resistance markers was associated with intermediate epithelial to mesenchymal transition phenotype in CTM and gCTCs, but not in iCTCs. Presence of gCTC was associated with shorter PFS and OS. Concerning PFS, assigning an immunofluorescence-based Epithelial to Mesenchymal status improved their prognostic value.
Conclusion This study brings to light the diversity of CTCs in mBC patients and their specific molecular profiles regarding epithelial to mesenchymal transition, stemness and drug resistance status. It also highlights the involvement of an atypical circulating cell subset, the gCTCs, as a prognostic factor for PFS and OS.
INTRODUCTION
Metastases are responsible for more than 90% of cancer-associated mortality (1). Therefore, anticipating and understanding their evolution using simple and reliable biomarkers is paramount. Metastases arise from malignant cells issued from a tumor (primary or metastasis) that have acquired an invasive phenotype and, most often, resistance to the first-line treatment. A few tumor cells can enter the blood circulation and, in this circumstance, are specifically called “Circulating Tumor Cells” (CTCs). Some of them, fit enough to survive to the drastic conditions encountered in the blood flow (anoikis, sheer stress, immune defense…), will eventually spread to other organs and then initiate, after a variable period of dormancy, novel malignant foyers (2). CTCs represent a unique access to biological characteristics from distant primary and metastatic lesions endowed with shedding properties (i.e. releasing tumor cells). In addition, CTCs’ analysis is potentially a powerful approach to study the metastatic process and to determine the tumor response on a real-time basis as therapy proceeds. Finally, because CTCs can be obtained after a simple blood draw of less than 10 milliliters, their sampling is minimally invasive and can be repeated on demand (3).
CTCs enumeration at diagnosis of metastasis is recognized as an independent predictor of overall and progression-free survival (PFS) in metastatic solid tumors such as breast, colon and prostate cancers (4-8). CTCs counts evolution during chemotherapy in metastatic breast cancer patients is clinically predictive for disease progression and survival on a real-time basis as therapy proceeds (8,9). Nonetheless, CTCs prognostic value has a poor added clinical utility in metastatic patients and remains unproven in non-metastatic patients (4,10,11). The current hypothesis is that a mere numerical count of CTCs does not reveal their true nature, especially their role during the metastatic process (12). Indeed, not much is known about critical biological aspects, such as CTC heterogeneity (cytological, phenotypical…), and their relationship with prognosis. However, unbiased and precise cellular characterization is difficult to establish on rare cells. Major efforts have thus been put into the development of new technologies that are both more sensitive and less biased than the CellSearch™ technology (only FDA-approved test for CTCs identification and enumeration so far) (Janssen Diagnostics, LLC, Raritan, NJ). The Screencell® Cyto system (ScreenCell™, France) is one of the promising technologies allowing to isolate all types of atypical circulating cells, provided that they are bigger and less deformable than leukocytes (13,14). Cytological criteria allow the identification of potential CTCs after the staining of immobilized cells on the filter. Multiple trials studying CTCs from several solid malignancies have been launched using this technology or equivalent (15-18), and the analysis of cells isolated with this device now permits “high sensitivity” detection (19).
Using filtration-based technologies, fragmented data have reported multiple rare and atypical circulating cells (14,20). For example, isolated circulating tumor cells or iCTCs are single individualized cells that appear epithelial-like by microscopy (i.e., epithelioid) and display malignant cytological criteria. Despite the fact that additional studies might be required to confirm the epithelial and/or tumor origin of these cells, the naming of CTCs is well accepted, mainly because they have mostly been detected in patients with benign or malign conditions, but not in healthy subjects (13). Clusters of CTCs are also long known under the name of circulating tumor micro-emboli (CTM). They share most of the specific malignant cytological criteria used to identify single CTCs and are found in clusters of at least three cells in the blood flow (21). CTM are the most likely harbingers of metastases. They have long been reported as an aggravating prognostic factor when identified in the peri-tumoral or intra-tumoral vessels. Their presence in the blood, at distance from the tumor site, was shown to increase by 23-to 50-fold the risk for metastases compared to an equivalent number of iCTCs (22). A prevailing view is that many single iCTCs die in the circulation, whereas cells from CTM are protected from apoptosis, including immune attack or drug mediated-death (23). Giant Circulating Tumor Cells (gCTCs), also called Cancer Associated Macrophage-Like cells (CAMLs), are easily distinguished by their large size. They were first described by Adams et al. but this population remains puzzling and their denomination highly ambiguous (24). Some of these cells have indeed clear epithelioid cytological and phenotypic features, that might categorize these cells as giant circulating epithelioid cells rather than “macrophages”, while others seems to be poly-nucleated. This population has only been observed in cancer patients but not in healthy controls.
In the current study, we provide an exhaustive and simultaneous view of these rare and atypical circulating cell subsets in metastatic breast cancer patients and describe some of their associated biological features. For this, we used a filtration-based technology allowing their fine characterization. We next looked for correlations between each cell subset proportion and prognosis as well as matched metastasis’ clinical characteristics.
MATERIALS AND METHODS
PERMED-01 sub-study
The PERMED-01 study was a prospective unicentric clinical trial, promoted by and conducted at the Paoli-Calmettes Institute (Marseille, France), and registered as identifier NCT02342158 at the ClinicalTrials.gov platform. This study was proposed to patients with metastatic cancers, including breast cancers, refractory to at least one line of systemic therapy and with an accessible lesion to biopsy. Its primary objective was to evaluate the number of patients for whom identification of actionable molecular genetic alterations (AGAs) in tumor samples could lead to the delivery of a “targeted therapy”. Among secondary objectives, was the analysis of CTCs subsets isolated from the blood of patients at the time of inclusion. The trial was approved by the French National Agency for Medicine and Health Products Safety, a national ethics committee (CPP Sud-Méditerranée), and our Institutional Review Board (IRB). It was conducted in accordance to the Good Clinical Practice guidelines of the International Conference on Harmonization. All patients gave their informed consent for inclusion, biopsy and blood sampling, and molecular analysis. A total of 91 adult female patients with metastatic breast cancer (mBC) were enrolled after disease progression in PERMED-01 between January 2015 and December 2016 and were sampled. In addition, seven healthy adults lacking any known pathology were recruited as controls. For each subject, a blood sample of 5 mL was collected in a Vacutainer® tube containing EDTA K2 as an anticoagulant. The first milliliters of blood were discarded to avoid endothelial cells contamination during the puncture. All samples were shipped to the laboratory, treated and analyzed within 4 hours.
Atypical circulating cells enrichment using ScreenCell® CYTO column
Blood samples were treated within 4 hours. To isolate rare circulating cells from whole blood, we used the Screencell® Cyto device. The samples were processed as described elsewhere (Kulemann, Pitman et al. 2015). In brief, 3 mL of peripheral blood were added to a red blood cell lysis/fixative buffer (ScreenCell® FC buffer) and passed through a filter (filters are dotted with 8-μm pores) with a low-pressure vacuum as per the manufacturer’s instructions. Filters were dried at room temperature for 5 minutes before being used for further analysis (cytological and/or phenotypical staining).
Atypical circulating cells staining with May Grünwald Giemsa
Once dried, the filters were stained successively using three baths: a first bath contained pure May-Grünwald solution (1 minute 30) (Merck Millipore), the second one contained diluted May-Grünwald solution, volume to volume with distilled water (pH 7; 1 minute 30), and finally the third bath contained Giemsa solution, diluted 1:10 in distilled water (6 minutes) (Merck Millipore). After three baths in distilled water, filters were dried at room temperature for 5 minutes. Filters were then read using a Leica™ microsystem light microscope and the NIS NIS-Elements Viewer software (Nikon®).
Atypical circulating cells subsets cytological criteria
Rare circulating cells were analyzed for established characteristics that are similar to the malignancy criteria traditionally used for cytological examination. iCTCs display a nucleus size equal to or greater than 20 µm, high nuclear-to-cytoplasmic (N/C) ratio (≥0.75), a dense hyperchromatic nucleus -not totally opaque- and an irregular nuclear membrane. The nuclear size and the N/C ratio are the most important criteria. When the four criteria are met, malignancy is almost certain. If only two (the two most important) or three out of four criteria are met, malignancy is considered as “uncertain” and additional analyses are required (see below: “Uncertain specimens”) (25). The malignancy criteria of CTM were mainly based on their global appearance in cluster of at least three cells and the appearance of the nuclei, which should be scattered irregularly through the cluster. Anisokaryosis, i.e. nucleus of variable sizes and shapes, is the most important criterion for CTM. gCTCs are individualized very large cells (50-300 µm), with a voluminous cytoplasm (very small N/C ratio), which can be round or oblong. The nucleus is often multilobular or multiple.
Immunofluorescent staining of atypical circulating cells for confocal microscopic analysis
Immunofluorescent staining was done directly on the filter. Briefly, 4% paraformaldehyde was used to fix cells on the filter for 5 minutes (Sigma Aldrich), TBS containing 0.2% Triton X-100 (Sigma Aldrich) was used to permeabilize cells for 5 minutes. After a quick rinse in water, the filter was incubated in blocking buffer containing 3% Bovine Serum Albumin, 1% Donkey serum and 1% Goat serum at room temperature for 30 minutes. Antibodies used are detailed in Supplementary Table 1. Primary antibodies were added in blocking buffer and incubated overnight at 4°C. Following three washes with TBS-0.05% Tween20, the secondary antibody mixture was added for 1 hour in the dark at room temperature. After three washes with TBS-0.05% Tween20, the coupled antibody CD45-A488 was incubated for 1 hour in the dark at room temperature. Finally, after three washes with TBS-0.05% Tween20 and water, the filter was counterstained with Sytox Blue Nucleic Acid Stain for 5 minutes at room temperature in the dark, to stain nuclei (Life Technologies, S11348). Finally, the filter was mounted with Kaiser Solution (Sigma Aldrich, 1092420100) and dried at room temperature a few more hours. Immunofluorescence was analyzed with a c-Plan-Apochromat 40x/1.3 oil objective on a LSM880 confocal with spectral detection from Zeiss equipped with a 405 laser diode, an Argon laser and 561 and 633 lasers. Imaged acquisition and spectra unmixing were done using the Zen Black software.
Clinical data and CTCs status (negative vs positive). The positivity cut-off was defined using a two-component Gaussian finite Mixture Model (GMM)(cf text). Above the cut-off, patients were considered “positive” for this atypical circulating cell subset.
Statistical analysis
Correlations between CTCs subsets and clinico-pathological variables were analyzed using logistic regression (Logit link function). Progression-free survival (PFS) was calculated from the date of inclusion in PERMED-01 until the date of first progression or death from any cause. Overall survival (OS) was calculated from the date of inclusion in PERMED-01 until the date of death from any cause. Follow-up was measured from the date of diagnosis to the date of last news for event-free patients. Survivals were calculated using the Kaplan-Meier method and curves were compared with the log-rank test. Uni- and multivariate prognostic analyses were done using Cox regression analysis (Wald test). The variables submitted to univariate analyses included patients’ age at inclusion, metastasis-to-diagnosis time, pathological type, grade, and molecular subtype of primary tumor, molecular subtype of metastasis biopsied in PERMED-01, (26) nature and number of metastatic sites at inclusion, number of previous lines of chemotherapy at inclusion, and CTC subsets. Multivariate analyses included the variables significant in univariate analysis (p≤0.05). The cell subset discretization was based on the distribution of values, and cut-offs were established using a two-component Gaussian finite Mixture Model (GMM) using maximum likelihood estimation on a per-study basis as previously described (27). The likelihood ratio (LR) tests were used to assess the prognostic information of one variable provided beyond that of another variable, assuming a χ2 distribution. Changes in the LR values (ΔLR-χ2) measured quantitatively the relative amount of information of one model compared with another. All statistical tests were two-sided at the 5% level of significance. Statistical analysis was done using the survival package (version 2.30) in the R software (version 2.9.1; http://www.cran.r-project.org/). We followed the reporting REcommendations for tumor MARKer prognostic studies (REMARK criteria).
RESULTS
Patients’ population
Ninety-one mBC patients enrolled in the PERMED-01 trial and seven controls (i.e. healthy subjects without known cancer) were included in the present study. As shown in Table 1, the patients’ median age at inclusion in PERMED-01 was 55 years (range, 27-79). The median time between diagnosis of metastatic relapse and primary cancer was 3 years (range, 0.5-23). Regarding the primary tumor, the most frequent pathological type was ductal (84%), the most frequent pathological grade was 3 (50%), and the molecular subtypes were mainly HR+/HER2- (56%), then triple-negative (TN) (32%), and HER2+ (12%). The molecular subtype of the PERMED-01 metastatic biopsy, available for 87 out of 91 patients, included more TN cases (46%) than HR+/HER2- (41%) and HER2+ (13%). Nineteen patients (22%) showed discordance between the molecular subtypes observed in the metastatic samples and the primary tumor. The median number of metastatic sites at inclusion in PERMED-01 was 3 (range, 1-8). The most frequent sites were bone (65%), then lymph node (63%) and liver (57%). The median number of lines of systemic chemotherapy received before inclusion was 4 (range, 0-8). With a median follow-up after inclusion of 12 months (range, 1-52), all but one patients showed disease progression and 68 died. The 1-year PFS was 13% (95%CI 8-22), median PFS was 5 months (range, 1-47), 1-year OS was 58% (95%CI 40-70) and median OS was 14 months (range, 1-52).
Three subsets of atypical circulating cells in mBC patients
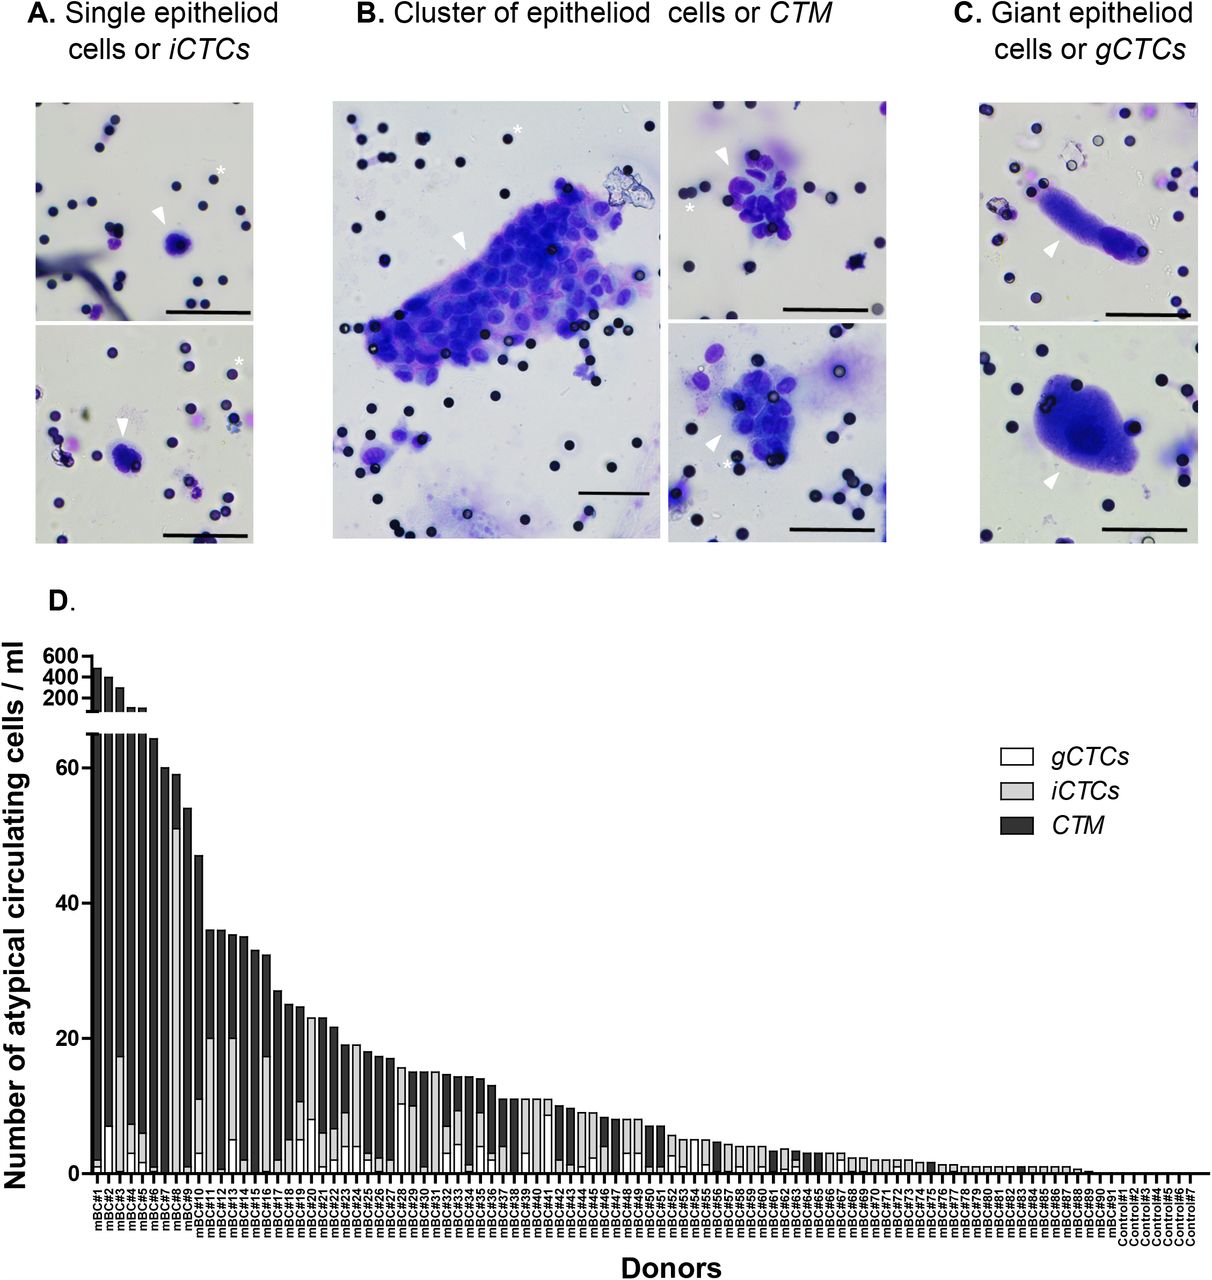
We screened all blood samples for the presence of atypical circulating cells, either individual or in cluster, after MGG coloration of a ScreenCell® Cyto filter. We observed several types of atypical circulating cells, which were classified into three subsets, as already described (14) and based on precise cytological criteria: single/individual epithelioid cells or iCTCs (Figure 1A), clusters of cells or CTM (Figure 1B and Supplementary Figure 1A), and giant epithelioid cells or gCTCs (Figure 1C).

A-C. Cytological staining with May-Grünwald solution of cells isolated from blood samples on a filter. Small black dots are filter pores (for clarity some examples are marked with a white asterix). Scale represents 50µm. Cells of interest are marked with an arrow. The figure shows representative examples of: A. Single epithelioid cells or iCTCs, B. Cluster of epithelioid cells or CTM, C. Giant epithelioid cells or gCTCs. D. Graphic representation of the result of the screening of 91 metastatic cancer patients and 7 cancer-free donors as controls, indicating the number of iCTC, CTM and gCTC per ml in each case.
Of note, large nuclei (greater than 20 µm), with irregular nuclear borders, dense and hyperchromatic, but with no clearly visible cytoplasm could often be observed with high frequency in patients’ samples and referred to as “uncertain” specimens (Supplementary Figure 1B); these are naked nuclei or residual apoptotic bodies. Complementary analysis is required to understand their identity: whether the pressure applied during the filtration blows apart the cytoplasm from the nucleus of fragile cells, or if the cell is undergoing apoptosis in the bloodstream, thereby displaying a retracted cytoplasm, remains to be determined. Because their origin is uncertain, we have not analyzed these events in the present study. Of note, they were not observed in control samples, and at this stage we cannot rule out a potential role in disease progression. Small (<20 µm) and round naked nuclei or residual apoptotic bodies could also occasionally be observed in patients and control samples (Supplementary Figure 1C). These events potentially arise from normal cells.
Quantification of atypical circulating cells in mBC patients
All but four patients (96%) had at least one atypical circulating cell (defined as the sum of iCTCs, CTM, and gCTCs) per mL of blood. The median number of CTCs per mL was 8.33 (range, 0-481.6) and the mean number was 27.17 [+/- 71.8]). The distribution of cell subsets in each atypical circulating cells count is shown in Figure 1D and described in Supplementary Table 2. The number of patients with at least one iCTC per mL was 72 (79%), the median number of iCTCs per mL was 2 (range, 0-51) and the mean number was 4 [+/- 6.7]. The number of patients with at least one CTM per mL was 47 (52%), the median number of CTM per mL was 1.33 (range, 0-479.6) and the mean number was 21.90 [+/- 71.1]). The number of patients with at least one gCTC per mL was 33 (36%), the median number of CTM per mL was 0 (range, 0-10.3) and the mean number was 1.2 [+/- 2.1]). Thus, the distribution of the different cell subsets was variable between patients: iCTCs were more frequently present than CTM, which were more frequently present than gCTCs; when present, the CTM and iCTCs were in larger concentration per mL of blood than were gCTCs.
Univariate and multivariate analysis for PFS and OS
The intermediate EMT status of CTM and gCTCs (but not iCTCs) is associated with the co-expression of stemness and drug resistance markers
To improve their characterization, we looked deeper into the biology of these cell subsets by analyzing specific molecular markers using advanced multicolor confocal analysis. We analyzed 23 samples, which included a total of 2,152 atypical circulating cells. These cells included a majority of CTM (1,742), a minority of gCTCs (74), and 336 iCTCs, in agreement with the distribution observed through the whole series of patients. We set up a 6-color immunofluorescence staining simultaneously targeting leukocytes (CD45), epithelial markers (EPCAM and Pan-cytokeratin: pan-KRT), mesenchymal marker (VIM), stem cell markers (CD133 (28) and/or LGR5 (29)), drug resistance markers (ABCG2 and/or ABCB1/P-GP/MDR1 (efflux pumps)), and SytoxBlue as a DNA labeling dye for nuclei (Figure 2; Supplementary Figure 2). We analyzed this combination of antibodies by spectral confocal microscopy. All cells retained for analysis did not show a neat CD45 ring at the cell surface and did not belong to the leukocyte’s lineage. The staining observed with the combination of these molecular markers allowed to estimate, for each CTC subset, the epithelial-to-mesenchymal transition status, the stemness attributes (30), and the potential ability to resist to drugs based on the expression of efflux pumps (31). The results are shown in Figure 3 A-B, and Supplementary Figure 3.

The blood of a mBC patient was filtered and cells on the filter were immunostained. Blood cells are detected with the expression of CD45 antigen (see SD2 empty arrowheads), whereas CTCs are detected via the expression of epithelial markers (EPCAM and pan-KRT) and mesenchymal marker (VIM). Stem cell marker (Lgr5) and drug resistance marker (PgP) expression are also assessed. Representative image of a CTM with intermediate EMT status and no expression of stemness or drug resistance markers. Scale bar represents 10µm.

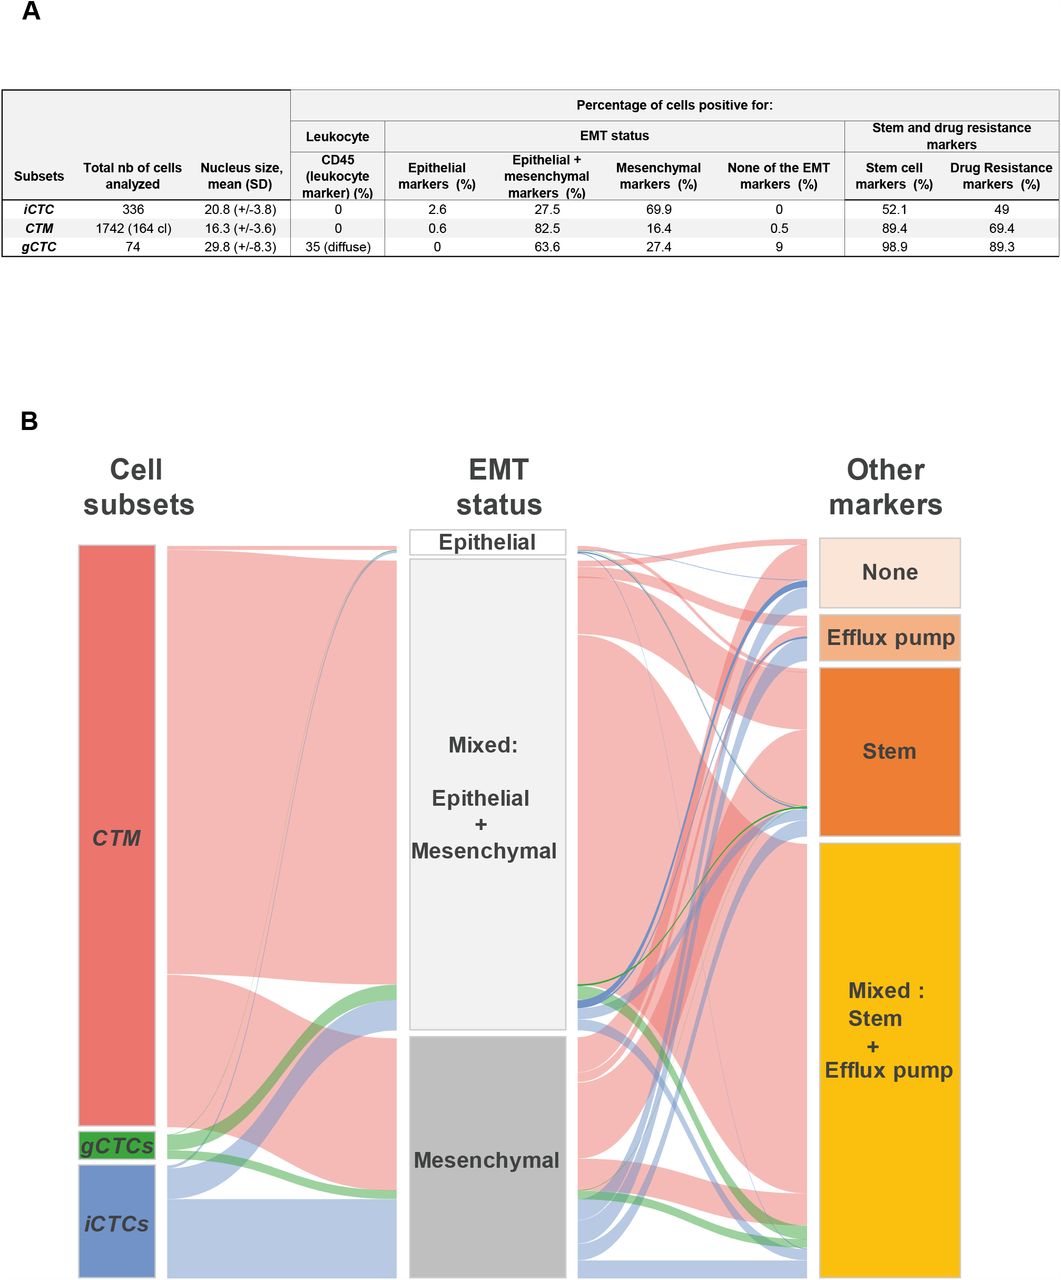
A. Data for the phenotypic markers expressed by atypical circulating cell subsets. B. Alluvial plot representation of the correlations between CTC subsets and molecular markers. The graph shows for the three substets of atypical cells (CTM, gCTCs, and iCTCs) the combined expression of EMT, stemness and efflux pump markers. The height of the blocks represents the size of the population: in the left column, the pink block represents the amount of CTM, the green one of gCTCs, and blue one of iCTCs; in the middle column the white block represents cells with epithelial status, light grey with mixed EMT status, and grey with mesenchymal status; in the right hand side column the light pink block the cells negative for both stemness and efflux pump markers, the light orange block cells expressing the tested efflux pump, the orange block represents the amount of cells expressing stem makers tested, and the yellow block cells expressing both stemness and efflux pump markers. The thickness of a stream represents the amount of cells contained in blocks interconnected by the stream.
A strictly epithelial (EPCAM+ and/or KRT+ but VIM-) status was found on very few circulating cells, independently of their subset (2.5% of iCTCs, 0.6% of CTM, and 0% of gCTCs). The balance between epithelial and mesenchymal markers was otherwise highly variable among the subsets. The phenotype of iCTCs was predominantly strictly mesenchymal at 64.7%, with only 26.3% of them presenting a dual epithelial/mesenchymal phenotype. The majority of cells composing CTM harbored a dual epithelial/mesenchymal phenotype (82.5%), with only 16.4% of them being mesenchymal-only. The gCTCs were also mostly double positive for epithelial and mesenchymal markers (63.6%), whereas 27.4% were strictly mesenchymal. Altogether, these results suggest that displaying a purely epithelial phenotype on atypical circulating cells is probably not favored in the blood flow. This could be because it is a better phenotype to detach from the tumor or because the environment in the blood might favor the survival of cells with a dual epithelial/mesenchymal phenotype or a strict mesenchymal phenotype (Figure 3A).
The LGR5 stem cell marker was expressed in 52% of iCTCs, 89% of CTM, and 99% of gCTCs. CTM and gCTCs seemed to be the subsets endowed with the highest stem potential (Figure 3A). Finally, we evaluated the expression of two efflux pumps, which can be involved in the mechanism of drug resistance, a specific trait from the PERMED-01 patients’ cohort. Efflux pumps were expressed on 49% of iCTCs, 69% of CTM, and 89% of gCTCs, suggesting that the gCTC subset was the most likely to resist to systemic treatments (Figure 3A).
Interestingly, when we looked at the co-expression of all these markers, we observed that the pattern of EMT, stemness and/or drug resistance markers differed on the various cell subsets (Figure 3B; Supplementary Figure 3). The iCTCs were predominantly mesenchymal and displayed variable profiles for stem cells and/or drug resistance markers. The CTM subset, in its majority (83%), simultaneously expressed epithelial and mesenchymal markers. In this population, 60% of the cells also expressed stem cells and drug resistance markers. The expression pattern associated with purely mesenchymal CTM was less evident. The main co-expression was that 13% of mesenchymal CTM co-expressed stem markers. Finally, gCTCs predominantly co-expressed stem and drug resistance markers, independently of their EMT status (56% of the cells with mixed EMT status and 33% of cells with mesenchymal status) (Figure 3B; Supplementary Figure 3).
Altogether, this analysis shows that iCTCs are a very peculiar category of atypical circulating cell with a majority of them being purely mesenchymal with random display of stem and efflux pump markers. Otherwise, CTM and gCTCs associate, in majority, an intermediate EMT state with the expression of stem markers, very often together with efflux markers. This confers specific attributes to those two subsets, which could contribute to their association with poorer prognosis.
Atypical circulating cells subsets and clinico-pathological correlations
We then searched for correlations between all atypical circulating cells or each individual subsets and clinico-pathological features of patients and tumors (logit function test). Before analysis, we defined objectively, for each atypical circulating cells subset, a positivity cut-off using a two-component Gaussian finite Mixture Model. Above the cut-off, patients were considered “positive” for this atypical circulating cell subset. The number of positive patients was 56 (62%) for all atypical circulating cells (cut-off: >4.5 cells/mL), 49 (54%) for iCTCs (cut-off: >1.8 cells/mL), 47 (52%) for CTM (cut-off: >0.9 cells/mL), and 42 (46%) for gCTCs (cut-off: >0.3 cells/mL) (Table 1).
The results of correlation analyses are shown in Figure 4A. Atypical circulating cells in their totality (“all atypical cells”) were associated with the presence of liver metastases (p=3.13E-02) and with the positivity of each cell subset (positivity is attributed to scores of CTCs above the cut-off defined for this subset). The correlations were different according to the subsets. The presence of iCTCs was more frequently associated with the HR+/HER2-subtype of primary cancer (p=1.29E-02) and of metastatic lesion (p=3.22E-02) than with the TN subtype, and with the presence of liver metastases (p=4.56E-02), the absence of skin metastases (p=2.86E-02), and the positivity of gCTCs (p=2.29E-03). The presence of CTM was associated with a shorter time between metastatic relapse and diagnosis of primary cancer (p=4.51E-02) and the TN versus HR+/HER2-subtype of primary cancer (p=3.39E-02). The presence for gCTCs was associated with the existence of peritoneal metastases (p=3.75E-02) and the positivity of iCTCs (p=2.29E-03). None of the atypical circulating cells subsets was associated with patients’ age, number of metastatic sites and number of previous lines of chemotherapy at inclusion, and pathological type and grade of primary tumor

A. Forest plot representation of the correlation between the total number of atypical cells detected, or individual atypical cell subsets (iCTCs, CTM, gCTCs), and clinical data for all 91 patients. Odds ratio are indicated with confidence intervals (horizontal lines). Data statistically significant are in black, data statistically insignificant (crossing 0, vertical line) in grey. TN: triple-negative, HR+: Hormone Receptive-positive, HER2-/+: HER2 negative/positive. The bottom part of the forest plot shows the correlation between the total number of atypical cells and the different subsets. B-C. Kaplan-Meier PFS (B) and OS (C) curves of mBC patients according to the presence of gCTCs (data from table 2).
The gCTCs status is an independent prognostic factor for PFS and OS
We then wondered if the presence and/or the different subsets of atypical circulating cells were associated with patients’ survival. The results of uni- and multivariate analyses (Wald test) are shown in Table 2. In univariate analysis, patients with numbers of atypical circulating cells in their totality above the positivity cut-off (“positive”) displayed shorter PFS than the “negative” (under the cut-off) patients (HR=1.37, 95%CI 0.89-2.10), but the difference was not significant (p=0.158). Such association was also not significant for iCTCs (HR=1.51, 95%CI 0.99-2.29; p=0.056) and for CTM (HR=1.16, 95%CI 0.77-1.76; p=0.478). By contrast, it was significant regarding gCTCs with a HR for PFS event of 1.94 (95%CI 1.24-3.01) in the “positive” patients as compared to the “negative” patients (p=2.98E-03). The 1-year PFS was 5% (95%CI 1-18) in the “gCTC-positive” group versus 20% (95%CI 12-35) in the “gCTC-negative” group (p=2.46E-03, log-rank test; Figure 4B). The other clinico-pathological features associated with PFS in univariate analysis included the patients’ age at inclusion (p=3.34E-02), the pathological type of primary tumor (p=1.76E-02), and the number of previous lines of chemotherapy at inclusion (p=4.20E-02). In multivariate analysis, the gCTC status remained significantly associated with shorter PFS (p=5.09E-03), suggesting independent prognostic value.
Similar results were observed with OS (Table 2). In univariate analysis, the patients’ status for all atypical circulating cells, iCTCs, and CTM was not significantly associated with OS. By contrast, it was significant regarding gCTCs with a HR for death of 2.46 (95%CI 1.47-4.12) in the “positive” patients as compared to the “negative” patients (p=5.84E-04). As shown in Figure 4C, the 1-year OS was 71% (95%CI 59-85) in the “gCTC-negative” group versus 42% (95%CI 29-62) in the “gCTC-positive” group (p=1.06E-04, log-rank test). The other variables associated with OS in univariate analysis included the pathological type of primary tumor (p=1.90E-02), the presence of brain/meningeal metastases (p=1.15E-03), and the number of previous lines of chemotherapy at inclusion (p=8.50E-03). Again, in multivariate analysis, the gCTC status remained significant and associated with shorter OS (p=7.26E-03), suggesting independent prognostic value.
We then explored the prognostic value of additional molecular features of atypical circulating cells in the small subgroup of 23 patients randomly chosen. Before analysis, the molecular status of cell subsets was discretized using a 50% positivity arbitrary cut-off: a patient was considered as positive when more than 50% of cells of this subset were stained for the given molecular marker. In univariate analysis for PFS (Supplementary Table 3), only the epithelial-mesenchymal mixed status was associated with shorter PFS (HR=2.87, 95%CI 1.08-7.68; p=3.53E-02, Wald test). Given the association between this molecular status and gCTCs, both associated with PFS, we tested their prognostic independence in multivariate analysis (Supplementary Table 3): interestingly, and despite the small number of samples, both variables tended towards significance with respective p-values of 0.082 and 0.054, suggesting that both cytological and molecular variables might provide complementary prognostic information. Supplementary Figure 4A shows the PFS of 23 patients according to the presence or not of atypical circulating cells of intermediate EM status and the presence or not of gCTCs. The patients without gCTCs and without atypical circulating cell of intermediate EM status (gCTC 0 + EM 0) displayed 71% 6-months PFS (95%CI 45-100) versus 17% (95%CI 3-100) for patients with both statutes positive (gCTC 1 + EM 1) and 40% (95%CI 19-85) for patients with “hybrid” statutes (gCTC 0 + EM 1 and gCTC 1 + EM0) (p=1.12E-02, log-rank test). Such prognostic complementarity between both variables was tested using the likelihood ratio (LR) test: the gCTC status added prognostic information to that provided by the epithelio-mesenchymal mixed status (ΔLR-χ2=4.08, p=4.34E-02; Supplementary Figure 4B), and conversely, the epithelio-mesenchymal mixed status tended to add prognostic information to that provided by the gCTC status (ΔLR-χ2=2.89, p=0.089). This result suggested that investigating both the molecular phenotype of atypical circulating cells and their cytological aspect could improve the prognostic value of CTCs.
DISCUSSION
It is accepted that circulating epithelial cells, defined on Cellsearch™ criteria as EPCAM+ CD45- circulating cells, represent a new outcome-associated biomarker independent from known prognostic factors in metastatic breast cancers (4,5,32-34). Recent and more sensitive technologies revealed that multiple cell subsets can be found in the blood of patients with solid tumors (14,22,24,35). Single-use filter-based systems provide a high degree of sensitivity to isolate atypical rare circulating cells of “large” size, while letting most erythrocytes and leukocytes pass through (14). This revealed the diversity of CTCs regarding the maintenance of their epithelial status, their size and presentation. With this high sensitivity other atypical, potentially non-malignant cells, might also be trapped on the filters. Those can be endothelial cells which, although not supposedly found in the blood flow, can however be identified in very rare occasions, notably in cancer patients (35). We barely detected any endothelial cells in the analyzed samples. However, we detected large cells that we named gCTCs, not found in blood in healthy situation. They are large cells that were described as CAMLs (cancer-associated macrophage-like cells), reported to come in five morphological variants (amorphous, oblong, spindle-shaped, round, and tadpole-shaped) (24). A recent theory suggests that those cells might be fusion hybrids between tumor-associated macrophages (TAM) and malignant cells (36,37). We found that EPCAM and KRTs were present in the majority of gCTC (as shown in Supplementary Figure 2 and Figure 3A), unmistakably identifying them as cells of epithelial origin. In the other cases, the macrophage origin of gCTCs in our study is probably invalid because gCTCs did not display CD45 at their membrane. It is interesting to note that if gCTCs are the result of cell fusion, their potential polyploidy could enhance their chances to adapt to environmental changes, which would participate in the increased tumorigenic potential compared to other subsets of CTCs. Understanding the nature of those cells could help deciphering their role in cancer evolution. Notably, it would be of great interest in future studies to analyze the transcriptomic profile of these cells. In the meantime, we observed that the majority of these gCTCs (>98%) displayed high level of the LGR5 stem cell marker as well as the efflux pump ABCB1 suggesting a strong potential as tumor-initiating and drug-resistant cells respectively. Their numbers were previously shown to increase in chemotherapy-treated but not in hormone-therapy treated patients, suggesting that the release into the circulation of some gCTCs might be influenced by the type of treatment (24). Finally, gCTCs were correlated to peritoneal metastasis (Figure 4). Peritoneum metastasis in breast cancer probably arises with systemic spreading of tumor cells. The molecular characteristics (stem and drug resistance) of gCTCs might result in better survival in the systemic circulation and thus increased numbers of gCTCs and/or increased capacity to form metastases. Peritoneal metastasis from breast cancer is a rare and challenging clinical presentation in which a better understanding of gCTCs’ role could be helpful. Adding to the fact that gCTCs remain an intriguing population, we found that their presence was an independent predictor for PFS and OS. This relationship with OS did not depend on a defined threshold but only on their presence or not.
Recently, the center of attention has been drawn on the CTM population (9,38-40). Although less frequently observed in the circulation than iCTCs, CTM have 23-to 50-fold increased metastatic potential (22,38). In line with this, we found that 89% of cells found within cluster were positive for the LGR5 stem cell marker, whereas only 52% of iCTCs were faintly LGR5-positive. Interestingly, the detection of stem cell markers was not necessarily observed on the most mesenchymal cells, but rather on cells with a mixed epithelial/mesenchymal phenotype. In a cohort of patients with progressing metastatic breast cancer, 30% of patients had CTM using the Cluster-iChip technology and their presence correlated with shorter PFS in a cohort of 30 patients (41). We found a higher prevalence of CTM in our cohort of patients (52%), potentially explained by the more advanced metastatic status of our cohort. It is also possible that the filter-based technology we used was better suited to isolate CTM that the CTC-iChip technology (41). We were not able to correlate the presence of CTM to shorter patients’ PFS, nor OS despite a larger cohort size (n = 91). Our cut-off selection might not be optimal, but aims at being objective, being based on the distribution of data (GMM). Indeed, we have tested other arbitrary cut-offs for CTM and iCTCs, and found that some, like CTM cut-off < or > to 15) have a prognostic value (Supplementary Figure 5). However, these thresholds need larger series for validation in independent samples, which is why we pursued with the GMM cut-off. The lack of correlation between the presence of CTM and shorter PFS or OS is also probably inherent to the specificity of this cohort, which is composed of advanced mBC. One can hypothesize that at a later stage, the predictive value of CTM is less powerful than at earliest stages. In this case, as previously reported for CTCs, a variation between time points might be more informative (42,43).
Outside the fact that CTM expressed high level of LGR5 stem cell marker, they also showed the highest level of epithelio-mesenchymal mixed phenotype. This might contribute to their previously reported association with a poor prognosis as it was reported that cells with a dual epithelio-mesenchymal phenotype are endowed with higher metastatic risk (44). The proposed explanation is that the mesenchymal phenotype confers increased invasiveness to cancer cells, and the epithelial phenotype higher proliferation abilities. Our phenotypic analysis of CTM provides additional rationale for their high metastatic potential.
Our work presents the largest cohort of mBC patients analyzed so far using the ScreenCell®Cyto system. We show, for the first time with this device, that CTCs can be considered as a robust independent prognosis factor in mBC patients, both regarding progression-free and overall survivals. Of note that patients in our study had received many lines of treatment. Positivity for gCTCs might help oncologists identify which patients, after several lines of systemic therapy, might benefit from best supportive care alone. Or, if validated, the identification of gCTCs might provide a tool for better prognostic stratification in early clinical trials testing novel therapeutics, which frequently enroll late-stage, already pre-treated patients.
Altogether, this study comforts the validity and utility of this easy, relatively inexpensive and convenient system to study CTCs in breast cancer patients. Finally, it also highlights the involvement of an interesting atypical circulating cell subsets, the gCTCs, as a prognostic factor for PFS, which can be improved when combined with complementary immunofluorescent staining and confocal microscopy analysis. A better characterization of molecular make-up of these gCTCs might also help identifying potential targets for future anti-metastasis-treatment.
In conclusion, this original study focuses on the identification of subtypes of CTCs, rather than the mere quantification of total CTCs. It allowed the identification of gCTCs as potential prognostic biomarker in metastatic breast cancers, which can potentially be refined by immunophenotypic analysis. The correlation with clinical and molecular data is new, and deserves to be confirmed on larger series. The use of immunohistochemistry also indicated that the co-expression of stem and drug resistance markers is associated with intermediate epithelial-mesenchymal cells in CTM and gCTCs, but not in iCTCs. This may explain why CTM and gCTCs are associated with poor prognosis through stem and drug resistance attributes.
Data Availability
Data will be available on request
SUPPLEMENTARY DATA
Supplementary Table 1: Antibodies used for immunofluorescence
Supplementary Table 2: Distribution of CTC subsets in the mBC population
Supplementary Table 3: Univariate and multivariate analysis for PFS according to molecular and cytological profiles
Supplementary Figure 1: Pictures of atypical circulating cells observed in the blood of patients with mBC. Cytological staining with May-Grünwald solution of cells isolated from blood samples on a filter. Small black dots are filter pores (for clarity some examples are marked with a white asterix). Scale represents 50µm. Cells of interest are marked with an arrow. The figure shows representative examples of: A. Clusters of epithelioid cells of CTM, B. “Uncertain” specimens, including cells with no clearly visible cytoplasm and a cell with N/C ratio <0.75, C. Round naked nuclei or residual apoptotic bodies. Scale represents 50µm.
Supplementary Figure 2: Examples of the immunofluorescence staining of atypical cells isolated on ScreenCell® filters. The blood of mBC patients were filtered and cells on the filter were immunostained. Blood cells are detected with the expression of CD45 antigen (empty arrowheads), whereas CTCs are detected via the expression of epithelial markers (EPCAM and pan-KRT) and mesenchymal marker (VIM). Stem cell marker (Lgr5) and drug resistance marker (PgP) expression are also assessed. Representative images of A. iCTCs, B. CTM and C. gCTCs, are shown and indicated by white arrowheads. Scale bar represents 10µm.
Supplementary Figure 3: Alluvial plot representation of the combined expression of EMT, stem and drug resistance markers on CTCs subsets individually (CTM, gCTCs, and iCTCs). The same data as in figure 3 are represented for each cell subset separately. Alluvial plot representation of the correlations between CTC subsets and molecular markers. The graph shows for the three subsets of atypical cells separately (for CTM in A., for gCTCs in B., and for iCTCs in C.) the combined expression of EMT, stemness and efflux pump markers. The height of the blocks represents the size of the population. The thickness of a stream represents the amount of cells contained in blocks interconnected by the stream. EMT status: Ep=epithelial, Mixed=epithelial + mesenchymal, Mes=mesenchymal; Other markers: Efflux=Efflux pump, Stem=stemness marker, Mixed= Stemness + Efflux pump markers.
Supplementary Figure 4: Kaplan-Meier curves of OS and PFS of patients based on the presence of gCTCs and intermediate EM status. A. Survivals were calculated using the Kaplan-Meier method and were compared with the log-rank test to evaluate the prognostic value of combined gCTC and intermediate EM statuses. Presence of gCTC is marked as 1 vs absence as 0. Presence of an intermediate EM status in all CTCs’ subsets is represented as 1 value, absence as 0. B. Prognostic complementarity: the values are given for prognostic information of each variable colored in grey (Mixed EM and gCTC) on its own (LR-χ2) and when added to the other variable colored in blue (ΔLR-χ2). * indicates p≤0.05 and indicates trend for significance with p≤0.10.
Supplementary Figure 5: Kaplan-Meier curve of OS for patients based on the global population of CTCs (A) or on individual subsets (B: iCTCs, C: CTM, and D: gCTCs). For gCTCs their presence or absence was considered, and cut-off values were applied for all atypical circulating cells, CTM and iCTCs (based on arbitrary set cut-offs).
Acknowledgements
We would like to thank all the donors who have willingly contributed to the study (PERMED-01 Cohort patients, donors without malignant diseases); the Direction de la Recherche Clinique, for the management of the PERMED-01 cohort; D. Isnardon and M. Rodrigues from the Microscopy and Scientific Imaging platform.
Footnotes
Conflict of Interest: AG received non-financial support from Astra Zeneca, Novartis, Pfizer, Roche
Funding support: This work has been supported by Inserm, Institut Paoli-Calmettes (SIRIC INCa-DGOS-Inserm 6038), and grants from the Ligue Nationale Contre Le Cancer (EL2016.LNCC/DaB, EL2019.LNCC/FB), Association Ruban Rose, and Foundation Groupe EDF. AL was supported by the fellowship DOC4 from the Fondation ARC (n°DOC20180507420). AA was supported by a postdoctoral fellowship from the Fondation ARC (n°PDF20180507565) and the Fondation de France (n°00107936).
Abbreviations
- mBC
- metastatic breast cancer
- CTCs
- Circulating Tumor Cells
- iCTCs
- isolated Circulating Tumor Cells
- gCTC
- giant Circulating Tumor Cells
- EM status
- Epithelial to Mesenchymal status
- EMT
- Epithelial to Mesenchymal Transition
- PFS
- Progression free survival
- OS
- Overall survival
- CTM
- Circulating tumor microemboli
- TN
- Triple Negative
- TAM
- Tumor Associated Macrophage
- CAMLs
- Cancer-Associated Macrophage-Like cells
References


