
Abstract
Epidemiologists often report associations between cognitive functioning and bodily physiology in older adults, but the strength and drivers of this relationship remain unclear. Which systems – from body composition to cardiovascular, pulmonary, renal, hepatic, immune, metabolic, and musculoskeletal – best predict cognition, and to what extent is the cognition–body link related to brain variation as we age? Using data from over 30,000 UK Biobank participants, we analysed 19 body physiology phenotypes and three neuroimaging modalities. Machine learning models integrating all body measures explained 16% (r=0.40) of cognitive variation, with body composition and bone health emerging as the strongest predictors. Neuroimaging captured 85.1% of the cognition–body link, driven mainly by white matter characteristics. Body and brain phenotypes explained 82.3% and 87.2% of age-related cognitive decline, respectively, with substantial overlap. Together, these findings provide a comprehensive understanding of how body physiology and the brain’s structure and function jointly contribute to cognitive ageing.
Introduction
“Mens sana in corpore sano” is a Latin phrase meaning “a healthy mind in a healthy body.” This well-known expression captures the long-recognised link between cognitive and physical health. Empirical research has demonstrated this connection across multiple physiological systems, including body composition1–5, cardiovascular6–9, pulmonary10–14, renal15–19, hepatic20–23, immune24–27, metabolic28–31, and musculoskeletal systems32–35. However, most studies have examined these systems in isolation and have focused on within-sample associations rather than using body physiology as a predictive marker of cognitive functioning36. Consequently, it remains unclear how well overall physiology predicts cognitive performance in new individuals when considered holistically. Evaluating the predictive capacity of system-wide physiology will allow us to quantify the strength of the cognition–body relationship as a whole and identify the key physiological drivers of cognitive health.
Equally important is our limited understanding of how, and to what extent, the cognition–body relationship across multiple physiological systems is reflected in different aspects of the brain, as measured through various neuroimaging modalities. Diffusion-weighted MRI (dwMRI) enables the indirect evaluation of white matter microstructural integrity and organisation37. Resting-state functional MRI (rsMRI) captures temporal correlations in the blood oxygenation level dependent (BOLD) signal across brain regions38. Structural MRI (sMRI) reflects grey and white matter anatomy and morphology39. Several studies have utilised these modalities to develop predictive markers of cognitive functioning, achieving reasonable performance, with rsMRI being by far the most commonly used modality40–43. Yet, it remains unknown how predictive brain markers of cognitive functioning – whether unimodal, based on individual neuroimaging modalities, or composite, integrating information across all modalities – compare with markers derived from body phenotypes, and, more importantly, how much of the cognition–body relationship these brain markers can capture. Clarifying the brain’s role will provide a more comprehensive picture of the cognition–body relationship.
The relationship between body and cognition is not static, as cognitive functioning often declines with age44. However, it remains poorly understood to what extent physiology across multiple body systems contributes to age-related cognitive variation, and to what extent this link is reflected in the brain. Examining how body and brain jointly account for the relationship between cognition and age will help determine the potential of system-wide physiology as a predictive marker of cognitive ageing and clarify the respective contributions of body and brain across systems and modalities.
Using the UK Biobank, one of the largest datasets combining measures of cognitive performance, body physiology, and neuroimaging, we applied machine learning to predict cognitive functioning from 19 body and 81 brain phenotypes. Cognitive functioning was operationalised as the general factor of cognition (g-factor), a latent construct capturing shared variance across multiple cognitive domains and tasks45–47. Nineteen body phenotypes comprised 317 measures representing overall body composition and seven physiological systems: cardiovascular, pulmonary, renal, hepatic, immune, metabolic, and musculoskeletal. Brain phenotypes included neuroimaging-derived measures from three MRI modalities: dwMRI, rsMRI, and sMRI.
The purpose of the current study was threefold. First, we built machine learning models to evaluate how well individual body phenotypes and a composite body marker integrating all phenotypes predict cognition in unseen individuals. We benchmarked the predictive performance of these body-based models against models trained on unimodal and composite brain markers, assessing overall accuracy, examining feature importance, and comparing performance across body systems. Second, we quantified how much of the cognition–body relationship is captured by these brain markers. Finally, we assessed the extent to which composite body and brain markers jointly explain cognitive ageing.
Results
Cognition
We derived the g-factor from twelve cognitive performance scores using exploratory structural equation modelling within confirmatory factor analysis (ESEM-within-CFA, https://mateuspsi.github.io/esemComp/articles/esem-within-cfa.html). The four-factor structure was confirmed through parallel factor analysis, and construct validity was further established through CFA, supporting the interpretation of both domain-specific and general cognitive abilities (Fig. 1). Supplementary Table S1 lists the cognitive tests included in the study. Supplementary Table S2 presents the loadings of the twelve cognitive performance metrics on latent variables in the ESEM-within-CFA model, and Supplementary Table S3 summarises goodness-of-fit indices for the hierarchical g-factor model across five folds.

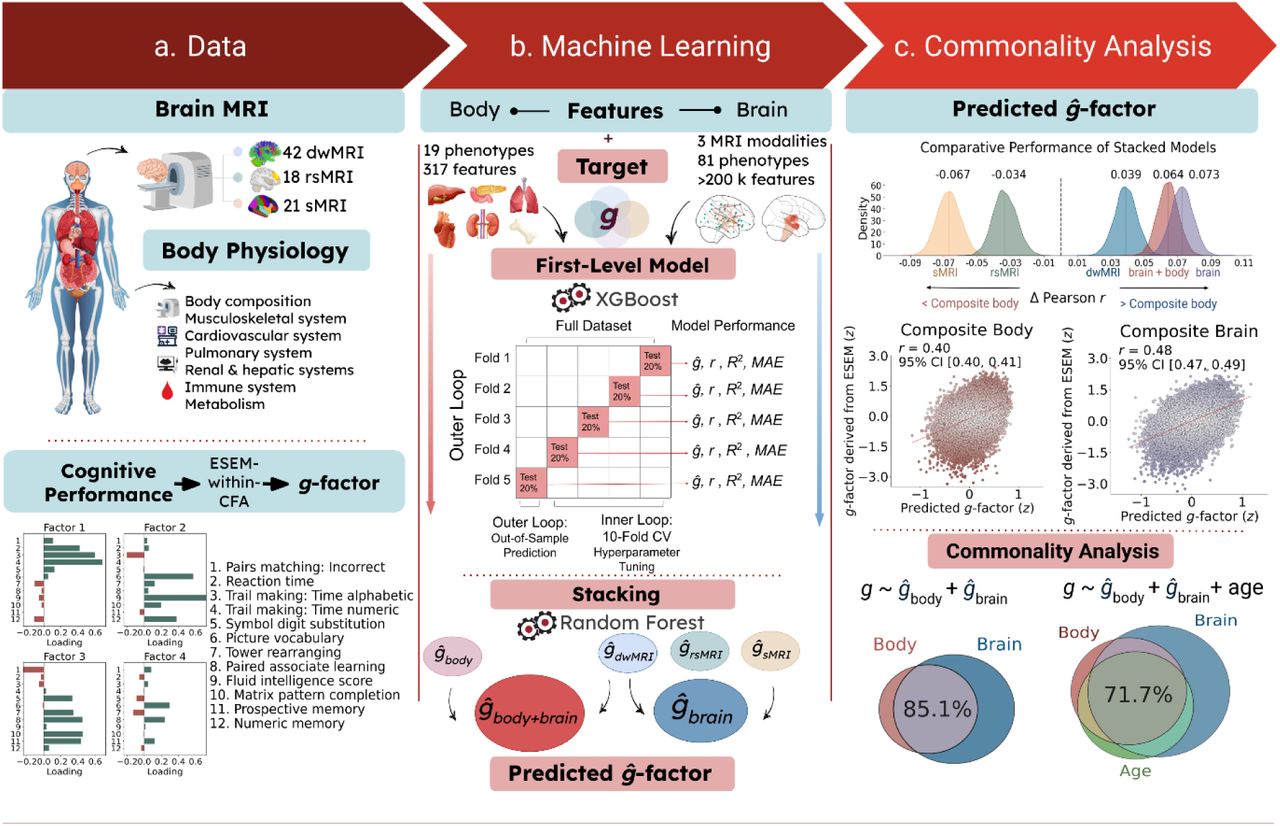
a. Data used to derive biomarkers of cognition. Body features included nineteen phenotypes capturing body composition and seven physiological systems: cardiovascular, pulmonary, renal, hepatic, immune, metabolic, and musculoskeletal. Brain features comprised 81 neuroimaging-derived measures from three neuroimaging modalities: dwMRI, rsMRI, and sMRI. The target variable was a latent general cognition factor (g-factor), estimated from twelve cognitive performance scores using exploratory structural equation modelling within a confirmatory factor analysis framework (ESEM-within-CFA).
b. Two-level machine learning framework. At the first level, we used the XGBoost algorithm to train 100 base models predicting the g-factor from each individual body and brain phenotype. At the second level, we applied multimodal stacking: g-factor predictions from all first-level models were used as features in Random Forest models that combined information within and across modalities. This procedure yielded six modality-specific biomarkers: a composite body marker integrating all body phenotypes (ĝbody); unimodal brain markers derived from stacking brain phenotypes within each neuroimaging modality (ĝdwMRI, ĝrsMRI, ĝsMRI); a composite brain marker integrating all brain phenotypes (ĝbrain); and a whole-body marker combining all body and brain phenotypes (ĝbody+brain). Model performance was estimated using nested cross-validation with five outer and ten inner folds.
c. Commonality analysis. Body- and brain-derived markers were used as explanatory variables in a series of linear regression models. The observed g-factor, pooled across the five outer-fold test sets, served as the response variable, while g-factors predicted from body, brain, or age (also pooled across folds) were used as explanatory variables. To quantify the contribution of (a) brain markers to the cognition–body relationship and (b) body and brain phenotypes to the cognition–age relationship, we decomposed the variance of the observed g-factor into components explained uniquely or jointly by each pair of predictors. To assess how composite body and brain markers jointly contribute to age-related variation in cognition, we extended the analysis to a three-predictor model, partitioning the variance of the observed g-factor into components uniquely attributable to age, body, and brain, as well as variance shared by each pair of predictors and by all three predictors together. dwMRI, diffusion-weighted MRI; rsMRI, resting-state MRI; sMRI, structural MRI; r, Pearson correlation between observed and predicted g-factor values; R2, coefficient of determination between observed and predicted g-factor values; MAE, mean absolute error; CV, cross-validation; CI, confidence interval.
Predicting cognition from body phenotypes
First, we trained 19 XGBoost models to derive biomarkers of cognition from 19 body phenotypes. These biomarkers explained 0.1% to 12.4% of the variance in the g-factor, achieving mean Pearson correlation coefficients (rmean) ranging from 0.05 to 0.35 (Fig. 2). As indicated by bootstrapping, predictions from all body phenotypes – except heel bone densitometry – were significantly better than chance. Supplementary Table S4 lists the body phenotypes used to build the machine learning models. Supplementary Tables S5 and S6 summarise the average cross-validated performance and the bootstrapped predictive performance, respectively, of models based on these phenotypes.

a. The kernel density estimation plot shows the bootstrap distribution of predictive performance for the model based on the top-performing body phenotype (body composition by impedance) and for the model combining all body phenotypes via stacking (composite body marker).
b. The ridgeline plots illustrate the predictive performance of each body phenotype (left) and the differences in predictive performance between each body phenotype and the top-performing phenotype (right), with corresponding 95% bootstrap confidence intervals.
Among all 19 body phenotypes, body composition assessed by impedance analysis showed the highest predictive performance, reaching a mean Pearson correlation of 0.35 (95%CI [0.343,0.363]) between the observed and predicted cognition. This was followed by bone mineral density (BMD) measured by dual-energy X-ray absorptiometry (DXA; rmean=0.315, 95%CI [0.304,0.325]). In contrast, models based on liver MRI and heel bone densitometry showed the weakest predictive performance, with mean Pearson correlations of 0.073 (95%CI [0.060,0.085]) and 0.048 (95%CI [0.033,0.063]), respectively (Fig. 2).
Next, we employed a multimodal stacking approach to derive a composite body marker integrating all body phenotypes. This composite marker improved predictive performance, explaining 16% of cognitive variance at rmean=0.40 (95%CI [0.395,0.413]) and outperforming each individual phenotype (Fig. 2). Supplementary Table S7 outlines differences in predictive performance between the composite body marker and brain-derived markers (individual brain phenotypes, unimodal brain markers, and a composite brain marker), as well as the whole-body marker.
To quantify how strongly each body phenotype relates to the composite body marker, we applied a Haufe transformation48, computing Pearson correlations between the composite body marker and the g-factors predicted from each body phenotype. Consistent with the phenotypes’ predictive performance, body composition assessed by impedance showed the strongest relevance to the composite body marker (r=0.87), followed by BMD (r=0.75). Liver MRI and heel bone densitometry showed the weakest associations, with Pearson r values of 0.19 and 0.10, respectively (Fig. 3a). Supplementary Table S8 reports the relevance of each body phenotype to the predictive performance of the stacked model and the feature importance for models based on each phenotype, computed using the Haufe transformation.

a. Relationship between individual body phenotypes and the composite body marker, quantified as Pearson correlations between the g-factor predicted from each body phenotype and the g-factor predicted by the stacked model integrating all body phenotypes.
b. Scatterplot showing the relationship between the g-factor derived via ESEM and the g-factor predicted by the stacked model integrating all body phenotypes (composite body marker). Pearson’s r reflects the mean correlation between observed and predicted g-factor values across the five folds, with confidence interval (CI) estimated via bootstrap resampling of the pooled observed and predicted values.
c. Relationship between body physiology measures and the composite body marker, quantified as Pearson correlations between 317 body physiology measures and the g-factor predicted by the stacked model integrating all body phenotypes, pooled across the five test folds. Only correlations that remained significant after Bonferroni correction and met the threshold of |r| ≥ 0.2 are displayed; phenotypes not meeting this criterion are omitted. The top four correlations with |r| > 0.15 are reported in Table 1, and the full set of feature importance values is provided in Supplementary Table S9.
Correlations between the composite body marker and individual body physiology measures are shown. For each body phenotype, we report the top four correlations with |r| > 0.15, including ties when multiple features share the same magnitude as the fourth-ranked feature, along with their p-values
We also applied the Haufe transformation48 to identify which of the 317 body measures were most strongly associated with the composite body marker. The top measures for each body phenotype are summarised in Table 1 and shown in Figure 3b, and all associations are reported in Supplementary Table S9.
The strongest positive associations with the composite body marker were observed for measures of stature, bone health, and pulmonary function, whereas negative associations were found for muscle fat infiltration, ectopic fat, and blood pressure (Fig. 3b and Supplementary Table S8). For example, vertebral height in the lumbar spine (L1-L4) measured by DXA was associated with the composite marker at r=0.43, followed by standing (r=0.34), sitting (r=0.37), and overall height (r=0.32). Among measures of lung function, the strongest correlation with the composite body marker was demonstrated for forced expiratory volume (FEV1), reaching r=0.40, forced vital capacity (FVC) at r=0.32, and peak expiratory flow at r= 0.27. Bone health indicators, such as femur Ward’s bone mineral density (BMD) T-score, head bone mineral content, and head bone area, showed moderate positive associations (r=0.27–0.28), as did insulin growth factor-1 (IGF-1, r=0.27).
In contrast, we observed the strongest negative associations for muscle fat infiltration in the thighs measured by MRI, with correlations ranging from r=−0.41 to −0.44. Moderate negative correlations with the composite body marker were also found for blood pressure and arterial load (systolic blood pressure, r=−0.33; central pulse pressure, r=−0.29), ectopic fat (pancreas fat fraction, r=−0.32), renal markers (cystatin C, r=−0.32), and adiposity measures such as weight-to-muscle ratio, visceral adipose tissue, and trunk/android fat percentages (r=−0.26 to −0.28). Finally, metabolic indicators, such as glycated haemoglobin (HbA1c), also showed negative associations with the composite body marker (r=−0.25), as did indices of vascular structure (carotid intima-media thickness, r=−0.25).
Predicting cognition from brain phenotypes
To derive brain markers of cognition, we trained machine learning models to predict the g-factor from 81 brain phenotypes. We then applied multimodal stacking to generate unimodal brain markers, integrating phenotypes within each of the three neuroimaging modalities, as well as a composite brain marker combining all neuroimaging data. Additionally, we built a whole-body marker by integrating all body and brain phenotypes.
Individual brain phenotypes explained between 1.3% and 18.6% of the variance in cognition. A composite brain marker based on all brain phenotypes captured 23% of cognitive variance, achieving rmean=0.48 (95%CI [0.467,0.486]). A whole-body marker integrating all body and brain phenotypes increased the explained variance to 21.8% at rmean=0.47 (95%CI [0.46,0.477]). At the neuroimaging modality level, unimodal markers based on dwMRI (R2mean=17%, rmean=0.44 (95%CI [0.433,0.453]) outperformed those based on rsMRI (R2mean=9.8%, rmean=0.37 (95%CI [0.36,0.38]) and sMRI (R2mean=12.8%, rmean=0.34 (95%CI [0.326,0.347]) (Fig. 4).

a. Kernel density estimation plot showing the bootstrap distributions of differences (Δ) in Pearson r between the composite body marker and the unimodal and composite brain markers, as well as the whole-body marker.
b. Scatterplot showing the relationship between the g-factor derived via ESEM and the g-factor predicted from brain phenotypes stacked within neuroimaging modalities (unimodal markers), across modalities (composite brain marker), and from body and brain phenotypes combined (whole-body marker). Pearson’s r reflects the mean correlation between observed and predicted g-factor values across the five folds, with confidence intervals (CIs) estimated via bootstrap resampling of the pooled observed and predicted values.
c. Feature importance plots for the top-performing sMRI, rsMRI, and dwMRI phenotypes. Bar plots for sMRI show the direction and magnitude of Pearson correlations (|r| > 0.2) between subcortical volumes derived from FreeSurfer’s automatic subcortical segmentation (ASEG) and the composite brain marker, pooled across the five outer-fold test sets. The strongest positive associations with the composite brain marker were observed for total grey matter volume and whole-brain tissue volume excluding ventricles, cerebrospinal fluid, and dura mater. The strongest negative associations were found for the volumes of the third ventricle, choroid plexus, inferior horn of the lateral ventricle, and white matter hypointensities.
Among brain phenotypes from dwMRI and rsMRI, the number of streamlines and functional connectivity among cortical and subcortical regions within the Schaefer7n500p-IV parcellation showed the highest predictive performance for cognition, with rmean=0.43 (95%CI [0.421,0.441]) and rmean=0.34 (95%CI [0.326,0.348]), respectively, explaining 18.6% and 11% of the variance. For sMRI, subcortical volumes derived from FreeSurfer’s automatic subcortical segmentation (ASEG) outperformed other structural phenotypes, predicting cognition at rmean=0.32 (95%CI [0.306,0.327]) and explaining 10% of cognitive variance (Fig. 4). Supplementary Tables S10 and S11 present the average cross-validated performance and the bootstrapped predictive performance, respectively, for models derived from individual brain phenotypes and for the stacked brain models. The results of the feature importance analysis for the top-performing brain phenotypes are summarised in Supplementary Tables S12–S14.
We benchmarked the predictive performance of the composite body marker against unimodal brain markers, a composite brain marker, and a whole-body marker by comparing their bootstrapped performance estimates. The composite brain marker (Δr=0.073, 95%CI [0.06,0.086]), whole-body marker (Δr=0.064, 95%CI [0.052,0.076]), and dwMRI-based marker (Δr=0.039, 95%CI [0.026,0.052]) all outperformed the composite body marker in predicting cognition. In contrast, models based on rsMRI (Δr=−0.033, 95%CI [−0.047,−0.019]) and sMRI (Δr=−0.067, 95%CI [−0.081,−0.053]) showed inferior performance relative to body alone (Fig. 4).
Heatmaps display Pearson correlations between the composite brain marker and streamline count, as well as full correlation matrices for connections between cortical and subcortical nodes in the Schaefer7n500p-IV parcellation, pooled across the five outer-fold test sets. For dwMRI, the highest positive association with the composite brain marker was observed for structural connections between the right visual and left somatomotor areas, whereas connections between the left visual and right somatomotor regions, and between the left precuneus/posterior cingulate cortex within the default mode network (DMN) and the right visual network, showed the strongest negative associations.
For rsMRI, the highest positive association with the composite brain marker was observed for functional connectivity between the left somatomotor cortex and the right DMN parietal region. The strongest negative associations were observed for functional connectivity between the DMN left prefrontal cortex and the DMN right precuneus/posterior cingulate cortex, and between the DMN left prefrontal cortex and the right lateral prefrontal cortex of the control network. Full results of the feature importance analysis for the top-performing brain phenotypes are summarised in Supplementary Tables S12–S14.
Commonality Analyses
Commonality of body and brain in predicting cognition
We conducted commonality analyses to quantify the proportion of the cognition–body relationship accounted for by the brain. For unimodal brain markers (phenotypes stacked within each neuroimaging modality) and the composite brain marker (phenotypes stacked across all modalities), this proportion was calculated as the variance in the predicted g-factor jointly explained by body and brain, divided by the total variance explained by body. The results of the commonality analyses for individual body phenotypes and a composite body marker are presented in Supplementary Table S15. Supplementary Table S16 further reports the corresponding analyses stratified by sex.
Brain captured a substantial portion of the cognitive variance attributed to the body. A composite brain marker integrating all brain phenotypes across three neuroimaging modalities captured 85.1% of the covariation between a composite body marker and cognition. Among the three neuroimaging modalities, dwMRI captured the greatest portion of body-related cognitive variance, accounting for 86.2% of the relationship. In contrast, sMRI (57.19%) and rsMRI (49.5%) accounted for about half of this link, suggesting a substantial, albeit weaker, contribution (Fig. 5).

Venn diagrams (top) illustrate the unique and shared contributions of the composite body marker and brain markers to cognitive variance. Percentages in the box indicate the proportion of covariation between the composite body marker and cognition that is explained by each brain marker, calculated as:
% Brain = Commoncomposite body, composite brain ÷ (Commoncomposite body, composite brain + Uniquebody)
Stacked bar plots (bottom) represent the unique and shared contributions of individual body phenotypes and brain markers to cognitive variance. Percentages in the box indicate the proportion of covariation between each body phenotype and cognition that is explained by a given brain marker.
Unique variance refers to the proportion (%) of variance in the g-factor explained exclusively by body or brain, whereas common variance reflects the proportion (%) of variance in the g-factor jointly explained by both.
dwMRI phenotypes contributed most to the relationship between body phenotypes and cognition, explaining over 75% of the covariation. For example, they captured more than 90% of the cognitive variance associated with liver, kidney, and cardiopulmonary functions, cardiovascular health, and blood markers of immune and metabolic status, and over 85% of the variance attributed to body composition and BMD in the spine and peripheral skeleton.
sMRI captured between 53% and 81%, and rsMRI explained less than 65% of the link between body phenotypes and cognition, with only liver MRI and resting ECG showing higher contributions from rsMRI – 75% and 68%, respectively. For some body phenotypes, such as liver MRI and heel bone densitometry, the brain markers explained over 95% of covariation with cognition despite negligible common variance, reflecting the body’s small unique contribution (Fig. 5).
Contribution of body and brain to age-related cognitive variance
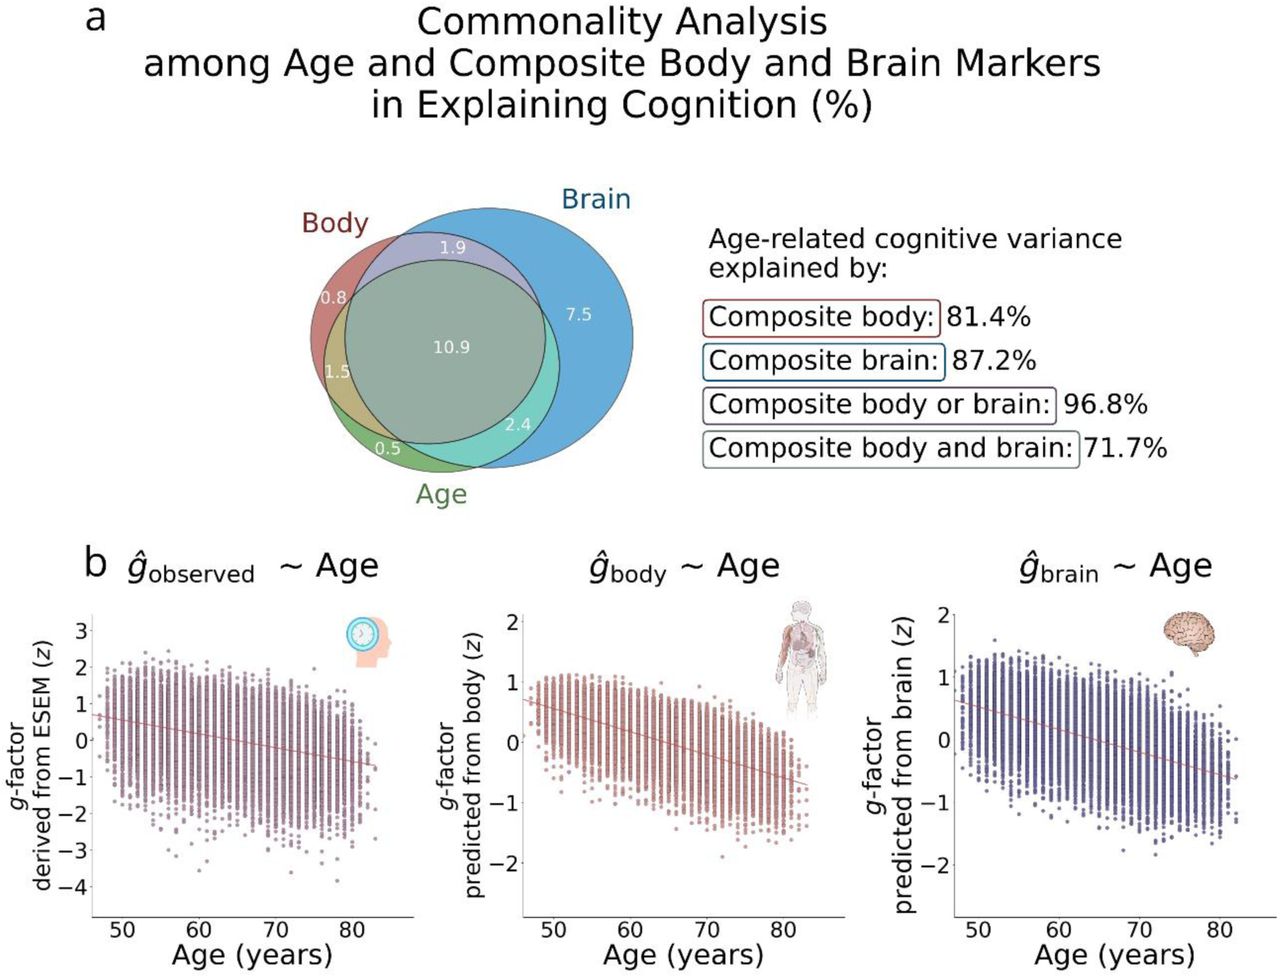
We employed commonality analysis to quantify the contributions of the composite body and brain markers to age-related cognitive variance. The analysis showed that body and brain each accounted for a large and comparable proportion of age-related cognitive variance – 81.4% and 87.2%, respectively. Their shared contribution, i.e., the variance explained jointly by body and brain, was 71.7%. Together, body and brain explained 96.8% of the age-related cognitive variance (Fig. 6 and Supplementary Table S17).

a. Venn diagram showing the unique and shared contributions of age, body, and brain to cognitive variance. The proportion of age-related cognitive variance explained by body and brain was computed as follows:
% Body = (Commonage,body + Commonage,body,brain) ÷ (Uniqueage + Commonage,body + Commonage,body,brain + Commonage,brain)
% Brain = (Commonage,brain + Commonage,body,brain) ÷ (Uniqueage + Commonage,body + Commonage,body,brain + Commonage,brain)
% Brain or body = (Commonage,body + Commonage,brain + Commonage,body,brain) ÷ (Uniqueage + Commonage,body + Commonage,body,brain + Commonage,brain)
% Brain and body = (Commonage,body,brain) ÷ (Uniqueage + Commonage,body + Commonage,body,brain + Commonage,brain)
b. Scatterplots showing the g-factor derived via ESEM and the g-factor predicted from the stacked body phenotypes (composite body) and stacked brain phenotypes (composite brain), each plotted as a function of age.
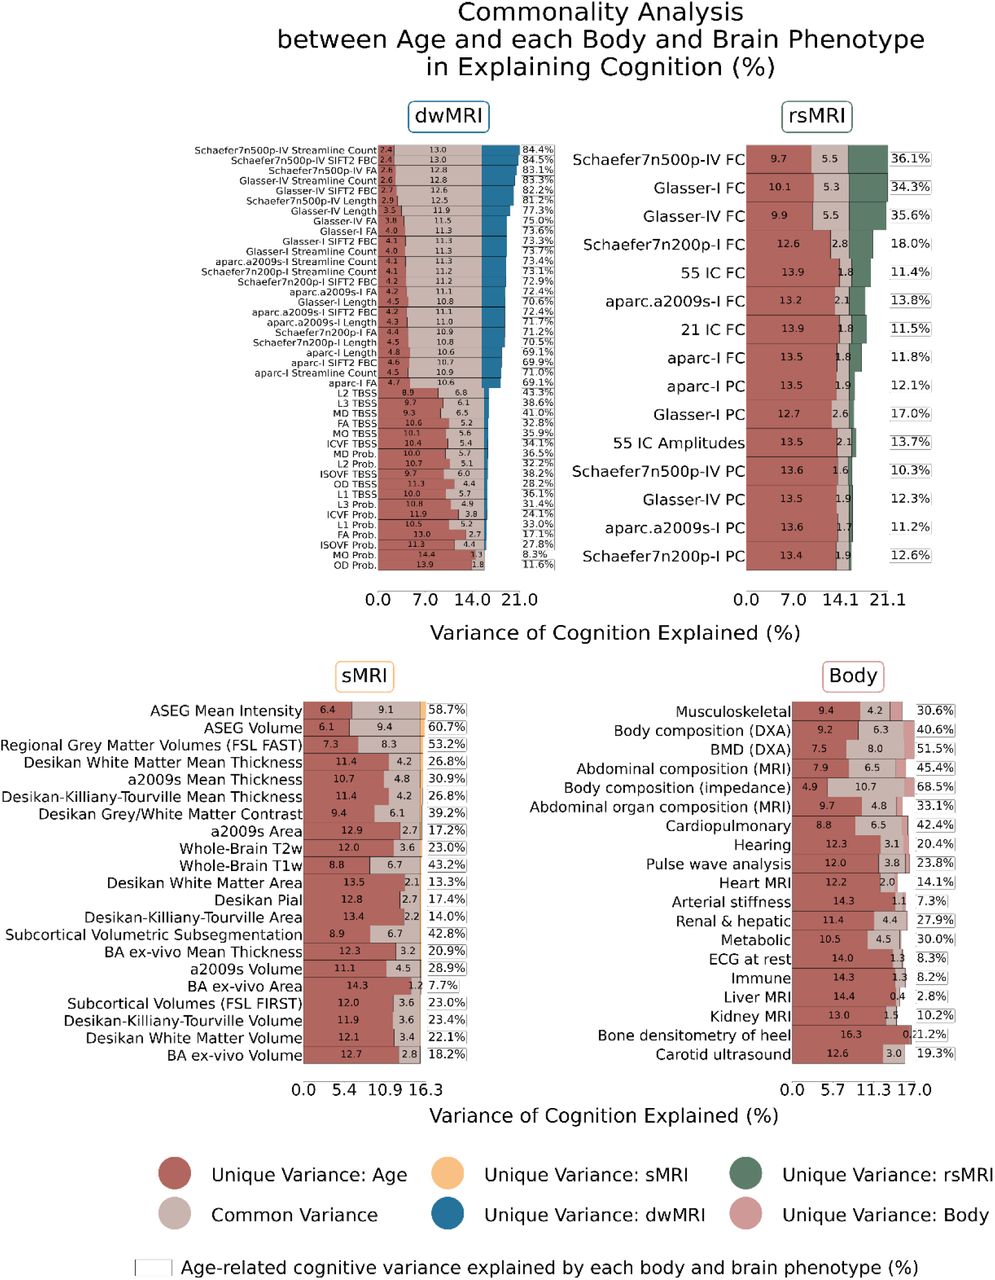
Among individual body and brain phenotypes, structural connectome measures from dwMRI explained more than 69% of the covariation between age and cognition. This was followed by the structural properties of subcortical regions derived from FreeSurfer volumetric segmentation (ASEG volume and mean intensity) and regional grey matter volumes from FSL FAST, which accounted for 53.2-60.7% of the covariation. Notably, body composition assessed via impedance analysis outperformed sMRI phenotypes, capturing 68.5% of the g–age covariation, while BMD measured with DXA explained 51.5%. In contrast, partial correlations between BOLD signals in cortical and subcortical regions from the Schaefer7n500p-IV parcellation, resting-state amplitudes of 21 independent components, diffusion tensor mode from probabilistic tractography, cortical areas from FreeSurfer ex vivo Brodmann parcellation, and a range of body physiology measures, including kidney and liver MRI, immune system, resting ECG, arterial stiffness, and heel bone densitometry, each accounted for less than 10% of the covariation (Fig. 7). Results are summarised in Supplementary Table S18, with sex-stratified analyses provided in Supplementary Table S19.

Stacked bar plots represent the unique and shared contributions of age, individual body phenotypes, and individual brain phenotypes to cognitive variance. Percentages in the box indicate the proportion of covariation between age and cognition explained by each body and brain phenotype. Unique variance refers to the proportion (%) of variance in the g-factor explained exclusively by age, body, or brain, whereas common variance reflects the proportion (%) of variance in the g-factor jointly explained by age, body, and brain.
Schaefer7n500p, Schaefer cortical atlas – 7 networks, 500 parcels; Schaefer7n200p, Schaefer cortical atlas – 7 networks, 200 parcels; aparc.a2009s, Destrieux cortical atlas; I, Melbourne Subcortical Atlas I; IV, Melbourne Subcortical Atlas IV; SIFT2, Spherical-Deconvolution Informed Filtering of Tractograms 2; Prob., probabilistic; TBSS, Tract-Based Spatial Statistics; FA, fractional anisotropy; MD, mean diffusivity; MO, diffusion tensor mode; L1, L2, L3, eigenvalues of the diffusion tensor; OD, orientation dispersion index; ICVF, intracellular volume fraction; ISOVF, isotropic volume fraction; IC, independent components; FC, full correlation; PC, partial correlation; ASEG, FreeSurfer automated subcortical volumetric segmentation; FSL FAST, FMRIB’s Automated Segmentation Tool; a2009s, Destrieux atlas; T2w, T2-weighted MRI; T1w, T1-weighted MRI; BA, FreeSurfer ex-vivo Brodmann Area Maps; FSL FIRST, FMRIB’s Integrated Registration and Segmentation Tool; DXA, dual-energy X-ray absorptiometry; BMD, bone mineral density; MRI, magnetic resonance imaging; ECG, electrocardiogram.
Discussion
Our study had three primary aims. First, we evaluated the predictive performance of body phenotypes for cognition. Using a composite body marker integrating 317 measures across 19 phenotypes, we predicted cognitive functioning with a correlation of r=0.40. Second, we quantified how much of the cognition–body relationship is explained by the brain. We found that 85.1% of this association was accounted for by a composite brain marker aggregating 81 brain phenotypes. Third, we assessed the combined contribution of body and brain to cognitive ageing. Body and brain phenotypes together explained 96.8% of the relationship between cognition and ageing, with a substantial shared variance (71.7%) between the two.
Predictive performance of body phenotypes
A composite body marker integrating 19 body phenotypes allowed us to quantify the overall strength of the cognition–body relationship, explaining 16% of the body-related cognitive variance. Its predictive performance (r=0.40) exceeded that of rsMRI and sMRI, but was lower than that of dwMRI and the composite brain marker. Given the widespread use of rsMRI in predicting cognitive functioning49, these results position body physiology as another promising predictive marker of cognitive functioning
By examining the predictive performance of individual body physiology phenotypes and the feature importance of their stacked model, we benchmarked the relevance of each phenotype to cognitive health. While the performance varied widely, predictions from 18 of the 19 body physiology phenotypes were significantly better than chance, consistent with studies linking cognitive functioning to body physiology when each phenotype is examined in isolation5,14,16,21,24,30,33. This confirms the roles of body composition1,50, cardiovascular6,7, pulmonary13,51, renal16,52, hepatic22,53, immune26,27, metabolic29,30, and musculoskeletal34,54 systems in cognition, while also quantifying the strength of their out-of-sample relationship with cognitive functioning.
Among the 19 body phenotypes examined, body and abdominal composition, as well as the musculoskeletal system, were the strongest predictors of cognition, rivalling brain markers derived from rsMRI and sMRI. The predictive power of these phenotypes was mainly driven by body adiposity and bone size, mineral content, and density. For example, body and trunk fat percentage, muscle fat infiltration, body mass index (BMI), and visceral adipose tissue (VAT) volume and mass were negatively associated with the composite body marker, whereas lean and fat-free mass, height, as well as L1–L4 average height and femur and head BMD showed positive associations. These features have been consistently recognised as important determinants of cognitive and brain health in later life33,34,50,55,56 and are suggested to reflect common pathways linking systemic physiology and brain integrity55,57–59. For example, bone mass loss is considered a risk factor for white matter changes, suggesting shared biological pathways underlying brain and bone health60. This assumption is further supported by the positive correlation between height and predicted cognition. Although this association may arise from multiple influences54,61,62, prior research shows that the height–cognition relationship remains robust even after accounting for genetic, socioeconomic, and health-related factors, pointing to cumulative childhood nutrition as a key driver62–64.
The negative associations we observed for body and trunk fat percentage, muscle fat infiltration, BMI, and VAT volume are consistent with evidence linking adiposity to poorer brain health and cognitive outcomes65–68. For instance, prior studies have reported relationships between regional fat accumulation and reduced grey matter volume, white matter lesions, and amyloid-β burden2,69–72,72–74. The underlying mechanisms are widely discussed in the literature75 and may involve excessive leptin secretion impairing amyloid precursor protein transport76, allostatic load77, systemic inflammation66,78, and metabolic dysregulation70. In contrast, lean and fat-free muscle mass, showing positive associations with predicted cognition, may exert neuroprotective effects75 through improved glucose and lipid metabolism and the release of myokines that regulate neurotrophins66,79–81.
Abdominal organ composition, cardiopulmonary function, kidney and liver health, and metabolic markers likewise showed high relevance to the composite body marker. At the feature level, lung capacity (FEV₁ and FVC) and circulating IGF-1 showed the strongest positive associations, whereas ectopic fat deposition (including pancreas and liver fat), elevated blood pressure, impaired kidney function, and dysregulated glucose and lipid metabolism were linked to poorer predicted cognition.
Metabolic markers, such as IGF-1 and HbA1c, may be a potential bridge linking body composition with brain and cognitive function61,82. IGF-1 supports neurogenesis, oligodendrocyte growth, and myelination, and may also indirectly influence brain integrity by regulating cerebral blood flow, glucose metabolism, and vascular remodelling61. For example, IGF-1 levels exhibit a U-shaped relationship with risks of dementia and stroke, alongside a positive linear association with Parkinson’s disease83. Similarly, increased HbA1c, crucial for glycaemic control, has been linked to grey matter abnormalities and cognitive impairment, particularly in older adults84–86. Potential mechanisms discussed in the literature include amyloid-β accumulation, tau hyperphosphorylation, neuroinflammation, oxidative stress, immune activation, vascular dysfunction, and impaired neuronal energy metabolism, which may collectively contribute to vascular complications, brain injury, and ultimately neurodegeneration and cognitive impairment85–87.
Numerous studies have linked lung function to cognitive ability11,88–90. Although the underlying mechanisms remain debated, impaired pulmonary function may compromise brain and cognitive health through hypoxia, vascular lesions, immune dysregulation, or reflect shared lifestyle factors and concurrent pathologies such as cerebrovascular disease91–94. Liver and pancreas disorders have likewise been associated with cognitive decline and increased risk of Alzheimer’s dementia, potentially through neuroinflammation, oxidative stress, endothelial dysfunction, insulin resistance, vascular white matter lesions, and reduced brain volume23,95–99. Another factor that may contribute to vascular brain lesions is hypertension. Chronic high blood pressure induces structural remodelling of cerebral vessels, leading to small vessel disease, impaired cerebral perfusion, white matter damage, lacunes, and microinfarcts – pathological changes that are associated with increased tau burden and vascular cognitive impairment9,100–102. These alterations may disrupt neurovascular coupling and blood–brain barrier integrity, thereby increasing vulnerability to cognitive decline in ageing populations. Together, these findings underscore the importance of developing tailored approaches that incorporate system-wide physical health indicators that shape cognitive outcomes in later life.
How much of the cognition–body relationship is explained by the brain
We assessed the contribution of various brain characteristics to the cognition–body relationship. By combining all brain phenotypes via multimodal stacking, we captured 85.1% of this relationship, highlighting the dominant role of brain measures across body physiology systems. Even for systems with low standalone predictive capacity, most of their explained variance overlapped with brain neuroimaging phenotypes. For example, the renal and hepatic systems accounted for only 4.5% of the variance in cognition on their own, yet 4% of this variance was shared with brain measures. This overlap implies that the brain captured 90.1% (i.e., 4% ÷ 4.5%× 100) of the cognition–body relationship for this system.
Among the three neuroimaging modalities, dwMRI showed the greatest ability to explain the cognition–body relationship, accounting for 86.2% of the covariation. These findings support a critical role of white matter in enabling communication between brain regions, which is essential for cognitive functioning103. Notably, alterations in white matter have been identified as stronger predictors of cognitive ageing than changes in grey matter and may even precede grey matter loss104,105. Furthermore, numerous studies have reported associations between white matter pathology and body health, including cardiometabolic and cardiopulmonary function106–108. Our results reinforce these findings by identifying white matter characteristics as key neurobiological correlates of the cognition–body relationship.
Within dwMRI, streamline counts from the Schaefer7n500p-IV parcellation showed the highest predictive performance for cognition, with both positive and negative contributions from pathways linking visual, somatomotor, and default mode network (DMN) regions. In particular, the most prominent positive association with the composite brain marker was observed for the structural connections between the right visual and left somatomotor areas, whereas connections between the left visual and right somatomotor regions, and between the left precuneus/posterior cingulate cortex (PCC) within the default mode network (DMN) and the right visual network, showed negative associations. These regions play a crucial role in supporting cognitive abilities. The posterior cingulate cortex is involved in regulating internally directed cognition, attention focus, awareness, and change detection109, which also requires connections to visual areas. Likewise, the precuneus is associated with visuospatial and self-referential processing, episodic memory retrieval, and consciousness110. Somatomotor areas participate in sensorimotor integration and motor control, and their strong reciprocal connections with visual areas, essential to perception and attention111, form key pathways supporting cognitive functioning112,113.
It is important to note that a substantial portion of the cognition–body relationship was also captured, although not as high, by rsMRI (49.5%) and sMRI (57.2%). This suggests the important roles of functional connectivity and grey matter morphology. rsMRI is widely used to predict individual differences in cognitive abilities43,114–118 and is considered a valuable tool for studying cognitive impairments119. Resting-state brain activity reflects multiple cognitive processes, including attention120 and memory121.
Within rsMRI, functional connectivity between the somatomotor and DMN regions, as well as bilateral connectivity within the DMN, showed the strongest associations with the composite brain marker. Specifically, connectivity between the left somatomotor cortex and the right DMN parietal region was positively associated with the marker, whereas connectivity of the left prefrontal cortex of the DMN and the right precuneus/PCC DMN node, as well as the right lateral prefrontal cortex of the control network, showed the strongest negative associations. These networks and regions are central to cognitive processing: the lateral prefrontal cortex is involved in goal-directed and stimulus-driven attention and memory122,123, and the parietal cortex is pivotal for spatial attention, sensory integration, and number processing124–126.
Finally, within sMRI, the ASEG parcellation showed the greatest predictive performance for cognition. Volumes of total grey matter and whole-brain tissue excluding ventricles, cerebrospinal fluid, and dura mater were positively associated with the composite brain marker, whereas volumes of the third ventricle, choroid plexus, inferior horn of the lateral ventricle, and white matter hypointensities showed negative associations. These findings align with prior research demonstrating positive relationships between grey matter and total brain volumes and cognitive abilities127–131. In contrast, ventricular enlargement, particularly of the third ventricle, has been identified as a risk factor for cognitive impairment132,133. Increased choroid plexus volume, a vascularised tissue involved in cerebrospinal fluid production, has likewise been linked to a range of brain disorders and cognitive decline134–136. White matter hypointensities, reflecting white matter lesions, are also well-established correlates of cognitive impairment and abnormal amyloid-β137–139.
Collectively, these findings advance our understanding of how different brain characteristics shape the relationship between body and cognition, and they open avenues for future work to identify strategies that enhance brain resilience to age-related factors such as adiposity, metabolic dysregulation, and muscle loss.
Contribution of body and brain phenotypes to cognitive ageing
Body and brain phenotypes each accounted for a large proportion of the age–cognition relationship (81.39% and 87.18% of the covariation, respectively). When considered together, they explained nearly all age-related cognitive variance (96.8%). Notably, most of this variance was shared between the two domains (71.7%), indicating that body and brain phenotypes capture highly overlapping aspects of age-related cognitive differences. Moreover, the explanatory power of body phenotypes exceeded that of sMRI and rsMRI brain phenotypes. Taken together, these findings emphasise that cognitive ageing reflects the intertwined effects of systemic physiology and the brain
These insights have direct translational relevance. They provide a holistic understanding of the biology of individual variations in cognitive functioning in older adults. Preventive interventions, ranging from cardiometabolic monitoring and pulmonary rehabilitation to nutritional support and promotion of physical activity, may reduce the burden of cognitive decline if implemented early and sustained across the lifespan. Moreover, multimodal biomarker frameworks that combine systemic physiology with neuroimaging could improve risk stratification, guide personalised interventions, and inform clinical trials aimed at delaying or mitigating cognitive ageing.
From a clinical perspective, these results highlight several modifiable risk factors, such as adiposity, sarcopenia, osteoporosis, impaired glucose metabolism, hypertension, and reduced pulmonary function, that may be targeted to preserve cognitive health. Conversely, protective factors, including lean muscle mass, bone integrity, lung capacity, and circulating IGF-1 levels, suggest biological pathways through which lifestyle interventions and preventive medicine could enhance brain health and cognitive resilience. High predictive power of body composition and BMD, rivalling that of conventional neuroimaging, reinforces the importance of integrating systemic physical health markers into cognitive risk assessment.
In summary, cognitive variations in later life reflect the intertwined influences of system-wide physiology and brain health. Recognising this dual contribution opens new avenues for prevention and treatment, emphasising that maintaining body health is inseparable from protecting brain health. Future research should build on these findings to develop integrated, clinically applicable models that capture the complexity of cognitive ageing and translate them into effective strategies for preserving cognition across populations.
Limitations
Our study is not without limitations. First, the cross-sectional design does not allow us to infer the temporal dynamics of cognitive and physical ageing, which limits our ability to understand how these continuous processes unfold over time, particularly in older adults. Future longitudinal research is needed to capture the trajectories of the relationships among ageing, cognition, and body and brain health. Second, the findings may have limited generalizability to other populations, given the cultural and societal characteristics specific to the UK Biobank sample140–143. Future studies could include a broader range of underrepresented ethnicities for model development and validation, although doing so may substantially reduce the availability of certain features due to smaller subgroup sample sizes. Third, our study lacks cognitively demanding task-based functional MRI (tfMRI) measures, which may account for a substantial portion of condition-specific variance in particular cognitive domains144. In the UK Biobank, tfMRI data have a smaller sample size and fewer features and come from the Hariri hammer task145. This task probes emotional reactivity, particularly amygdala responses, and is less cognitively demanding than other tfMRI paradigms, such as the n-back working memory task and the Face Name Associative Memory Exam144,146–148. Finally, cognitive tests within the UK Biobank battery differ from commonly used instruments such as the NIH Toolbox for Assessment of Neurological and Behavioral Function149 or the Wechsler Adult Intelligence Scale150, which are employed in other population-level studies151–153. This discrepancy makes it more difficult to generalise cognitive performance across cohorts.
Taken together, our findings show that brain structural and functional characteristics account for over 85% of the relationship between cognition and system-wide physiology, with white matter integrity emerging as the predominant neurobiological pathway and body composition and musculoskeletal health standing out as key bodily contributors. Having information about both the body and the brain allowed us to explain nearly all age-related variation in cognition. This convergence demonstrates that cognitive ageing reflects the interplay between systemic physiology and brain structure and function, underscoring that cognition is embedded within whole-body physiology and is best understood as a multisystem process spanning body and brain.
Online Methods
We analysed multimodal data comprising 12 cognitive performance scores, 19 body phenotypes, and 81 brain phenotypes collected during the first imaging visit of the UK Biobank study (application #70132). The original sample used to derive the g-factor included 31,897 participants aged 46–83 years (mean=64.55, SD=7.66; 51.32% female; 91.3% British, 2.49% Irish, 3.3% other white backgrounds, <1% other ethnicities). The final sample in the commonality analysis included 25,346 participants aged 47–82 years (mean=64.08, SD=7.52; 53.18% female; 91.25% British, 2.5% Irish, 3.35% other white backgrounds, <1% other ethnicities).
General cognition factor
We quantified cognitive function as a latent general cognition factor (g-factor) derived from twelve cognitive performance scores (see Supplementary Table S1 for a list of cognitive tests and scores included in the study) using exploratory structural equation modelling within confirmatory factor analysis (ESEM-within-CFA, https://mateuspsi.github.io/esemComp/articles/esem-within-cfa.html). To reduce skewness, we applied a log-transformation to the mean time required to correctly identify matches in the Reaction Time test, to the time needed to complete numeric and alphabetic trails in the Trail Making test, and a log(x+1) transformation to the number of incorrect matches in the six-pair version of the Pairs Matching task154,155. For the Symbol Digit Substitution test, the accuracy rate was computed as the ratio of correctly matched symbol–digit pairs to the total number attempted, to account for spurious correct responses that could arise from rapid guessing. This approach mitigates the inflation of scores that may occur when participants respond quickly without accuracy, as occasional correct matches can be obtained by chance. Overall, cognitive performance measures encompassed five cognitive domains: executive functions, fluid intelligence, reaction time and processing speed, memory, and crystallised cognitive ability (Fig. 1)155.
We derived the g-factor using a hierarchical model structure based on a set of domain-specific factors. To evaluate model fit, we used the Comparative Fit Index, Tucker–Lewis Index, Root Mean Square Error of Approximation, Bayesian Information Criterion, and Standardised Root Mean Square Residuals (Supplementary Tables S3 and S4)156–158.
Body phenotypes
As measures of physical health, we used 19 body phenotypes covering body composition, cardiovascular, pulmonary, renal, hepatic, immune, metabolic, and musculoskeletal systems (Supplementary Table S2). Body composition was assessed using magnetic resonance imaging (MRI), bioelectrical impedance analysis, and dual-energy X-ray absorptiometry (DXA). Bone size, mineral content, and density were measured by DXA. Cardiovascular health was characterised through carotid ultrasound, arterial stiffness indices, pulse wave analysis, heart MRI for left ventricular size and function, and 12-lead resting electrocardiogram (ECG). Renal and hepatic structure was examined using MRI of the kidney, liver, and abdominal organs. Additional assessments included blood-based markers of renal and hepatic functions, immune and metabolic health, and hearing tests. Variables with more than 60% missing data, including rheumatoid factor, blood oestradiol, microalbumin in urine, cardiorespiratory fitness, ECG during exercise, kidney distance, total adipose tissue volume, and total lean tissue volume, were excluded from the analyses.
Neuroimaging
We derived brain markers of cognition from 42 diffusion-weighted MRI (dwMRI), 18 resting-state functional MRI (rsMRI), and 21 structural MRI (sMRI) neuroimaging phenotypes (Supplementary Table S4). dwMRI assesses white matter microstructure, including fibre orientation and density, by measuring the directionality of water diffusion within myelinated axons159. rsMRI captures spontaneous blood-oxygenation-level–dependent (BOLD) signal fluctuations, enabling the estimation of functional connectivity both between cortical and subcortical regions and across large-scale networks38. sMRI leverages T1- and T2-weighted MRI sequences to quantify brain morphology like cortical thickness, grey and white matter volumes, and surface area39,160.
The dwMRI brain phenotypes included diffusion tensor imaging and neurite orientation dispersion and density imaging metrics, such as fractional anisotropy (FA), diffusion tensor mode, mean diffusivity, and the three eigenvalues of the diffusion tensor, as well as intracellular volume fraction, isotropic or free water volume fraction, and the orientation dispersion index (Supplementary Table S4). These metrics were extracted for 48 and 27 white matter tracts using tract-based spatial statistics and probabilistic tractography, respectively. Additionally, we used structural connectome data161, represented as matrices containing quantitative metrics, including streamline count, fibre bundle capacity (from spherical-deconvolution informed filtering of tractograms), mean streamline length, and mean FA, for each node pair, derived from six different combinations of cortical and subcortical atlases161: the Desikan–Killiany (aparc) cortical atlas162 + Melbourne Subcortical Atlas scale I (MSA-I)163, the Destrieux (aparc.a2009s) cortical atlas164 + MSA-I163, the Glasser cortical atlas165 + MSA-I163, the Glasser cortical atlas165 + MSA-IV163, the Schaefer atlas for 200 cortical regions (7 networks)166,167 + MSA-I163, and the Schaefer atlas for 500 cortical regions (7 networks)166,167 + MSA-IV163.
The rsMRI brain phenotypes included full and partial correlation matrices for 21 and 55 components derived from independent component analysis (ICA), as well as functional connectomes for the same six cortical–subcortical atlas combinations used for the dwMRI structural connectomes. For ICA-based networks, we additionally used network amplitudes. To construct functional connectomes for parcellated data, we combined BOLD time series from cortical and subcortical parcellations and computed both full and partial correlation matrices using the ConnectivityMeasure function in Nilearn156.
The sMRI brain phenotypes from T1- and T2-weighted MRI included regional and subcortical grey matter volumes and mean intensity; cortical and white matter surface area, thickness, and volume; grey–white matter contrast intensity; pial surface area; and total volumes of white matter hyperintensities from FSL FAST and FSL FIRST, FreeSurfer’s automated subcortical volumetric segmentation (ASEG), ex-vivo Brodmann Area Maps, Destrieux (a2009s) parcellation, Desikan–Killiany–Tourville parcellation, Desikan–Killiany parcellation, and subcortical volumetric subsegmentation156.
Data analysis
Machine learning
We applied machine learning to predict the g-factor separately from each body and brain phenotype, and then combined these predictions into multimodal biomarkers using a stacking approach. Model performance was estimated using nested cross-validation with five outer folds and ten inner folds, with hyperparameters tuned exclusively within the inner loops to avoid bias. In each outer fold, 20% of the data served as the held-out test set, while the remaining 80% formed the training set. This training set was further partitioned into ten inner folds for hyperparameter optimisation through cross-validation. Models were trained on nine folds and validated on the remaining one, iterating across all ten combinations. Using five outer folds and ten inner folds offered an optimal balance between computational efficiency, robust hyperparameter tuning, sufficient sample size for model training, and adequate test set sizes for model evaluation.
We selected the hyperparameter configuration that achieved the lowest mean squared error (MSE) across the inner-fold validation sets. Using this configuration, we retrained the model on the full outer-fold training set and evaluated on the corresponding outer-fold test set, from which predicted values were obtained. Performance was quantified using Pearson r, the coefficient of determination (R2), the mean absolute error (MAE), and the MSE. This procedure was repeated across all five outer folds, ensuring that every data point contributed to both training and testing, but never simultaneously.
Before building machine learning models, all variables were standardised using the mean and standard deviation from the training set, with these parameters applied to the corresponding test set within each outer fold, to avoid data leakage. Standardisation was carried out at four stages: cognitive performance scores were standardised before ESEM; neuroimaging data were standardised before regressing out modality-specific confounds from brain features; body phenotypes were standardised before first-level model training; and first-level predictions together with observed targets were standardised before building stacked models.
Before deriving neural markers of cognition, we corrected each set of brain phenotypes for common and modality-specific confounds, as described by Alfaro-Almagro and colleagues168 (see Supplementary Table S4 for the complete list of neuroimaging confounds). Confounds with pairwise correlations below r=0.7 were retained to mitigate multicollinearity. After standardising neuroimaging features and confounds, we applied linear regression to obtain residuals for each brain phenotype, which were then used as input features for the machine learning models156. Throughout the analysis, both base and stacked models were trained solely on participants from the outer-fold training set and evaluated on the corresponding outer-fold test set, ensuring a strict separation between training and test data.
To derive biomarkers of cognition, we used a two-step machine learning approach. First, we trained individual models using the XGBoost algorithm, each based on a single brain or body phenotype, to obtain phenotype-specific or baseline predictions of the g-factor. In the second step, we applied multimodal stacking to integrate these predictions across modalities and phenotypes. In this framework, the predicted g-factor values from the base models (i.e., from each brain or body phenotype) serve as input features for a second-level model, which integrates information across multiple sources to generate a final prediction147,156,169. We built six stacked models: one model combining all body phenotypes, one model combining all brain phenotypes, three models combining brain phenotypes within each neuroimaging modality (dwMRI, rsMRI, and sMRI), and one model integrating both brain and body phenotypes. For the multimodal stacking models, we employed the Random Forest algorithm, which can accommodate missing values that arise during integration of phenotype-specific predictions.
To assess the statistical significance of the models, we applied bootstrapping to the predicted and observed g-factor values aggregated across all five outer-fold test sets. We generated an empirical distribution of Pearson correlation coefficients by resampling the data with replacement for 5,000 iterations and derived 95% confidence intervals (CIs) from this distribution. Model performance was considered statistically significant when the 95% CI excluded zero, suggesting that the observed relationships were unlikely to occur by chance.
Additionally, we benchmarked the predictive performance of the top-performing body phenotype against the other body phenotypes as well as the composite body marker against unimodal and composite brain markers. Comparisons included (a) the top-performing body phenotype versus the remaining individual body phenotypes, (b) composite body marker versus individual body and brain phenotypes, unimodal and composite brain markers, and a whole-body marker, and (c) the top-performing brain phenotype versus individual body and brain phenotypes, unimodal and composite brain markers, composite body marker, and a whole-body marker. To assess the difference in predictive performance, we compared four performance metrics: Pearson’s r, R2, MSE, and MAE.
Feature importance
To explain the feature importance of each machine learning model, we applied Haufe transformation48 to predictions based on various machine learning models, pooled across the five outer-fold test sets. Specifically, to explain how each of the 19 body phenotypes was related to the predictions made by the stacked model combining all body phenotypes, we computed correlations between the composite body marker and the prediction from each body phenotype. Similarly, to explain how each of the 317 body physiology measures from different body phenotypes was related to the predictions made by the stacked model, we computed correlations between the composite body marker and each body physiology measure, applying Bonferroni correction for multiple comparisons. Lastly, to estimate the extent to which each neuroimaging feature was related to the predictions made by the stacked model combining all brain phenotypes, we computed correlations between the composite brain marker and the neuroimaging features from the top-performing brain phenotype within each neuroimaging modality.
Commonality analysis
We employed commonality analysis170,171 to quantify (a) the extent to which predictive relationships between body and cognition can be explained by unimodal and composite brain markers, and (b) the proportion of age-related cognitive variance attributable to body and brain phenotypes. Commonality analysis was carried out by building a series of linear regression models in which the observed g-factor, pooled across five outer-fold test sets, was treated as the response variable, and the g-factors predicted from body, brain, or age (also pooled across folds) served as explanatory variables, as follows:

 This approach enabled us to estimate the total variance in the g-factor accounted for by each explanatory variable. To quantify the contribution of (a) brain markers to the cognition–body relationship and (b) body and brain phenotypes to the cognition–age relationship, we decomposed the variance of the observed g-factor into components explained uniquely or jointly by each pair of explanatory variables. We then expressed the contribution of each explanatory variable as a percentage ratio, where the numerator corresponded to the variance jointly explained by the two explanatory variables and the denominator corresponded to the total variance explained by the predictor of interest alone, computed as:
 Here, Unique denotes the variance in cognition uniquely explained by one of the explanatory variables; Common denotes the variance jointly explained by two explanatory variables; and R2 represents the total variance in cognition attributed to each explanatory variable – or to pairs of variables – in independent linear regression models170,171.
To quantify how composite body and brain markers jointly contribute to age-related variation in cognition, we extended the commonality analysis to a three-predictor model:
 We decomposed the variance of the observed g-factor into components uniquely attributable to age, body, and brain, as well as variance shared by each pair of explanatory variables and by all three explanatory variables together. This decomposition enabled us to estimate the proportion of age-related cognitive variance that can be accounted for by body and brain markers, either individually or jointly.
We then expressed the contribution of each marker as a percentage ratio, where the numerator corresponded to the variance in the observed g-factor jointly explained by the explanatory variable of interest and age (with or without the third explanatory variable), and the denominator corresponded to the total variance explained by age alone:
Data Availability
The data used in this study are subject to restrictions. Access requests should be directed to the UK Biobank (https://www.ukbiobank.ac.uk/). This manuscript is a computational study and did not generate any new data. Analyses were conducted using the UK Biobank Resource under Application Number 70132. The modelling code is available on GitHub.
https://github.com/HAM-lab-Otago-University/UKBiobank-Brain-Body
Data availability
The data used in this study are subject to restrictions. Access requests should be directed to the UK Biobank (https://www.ukbiobank.ac.uk/).
Funding
This research has been conducted using the UK Biobank Resource under Application Number 70132. N.P. and was supported by Health Research Council of New Zealand (grant numbers 21/618 and 24/838), by Neurological Foundation of New Zealand (grant number 2350 PRG), and by the Ministry of Business, Innovation and Employment (grant numbers UOA2421 and RTVU2403). I.B. was supported by the University of Otago.
Conflict of interest
The authors declare that they have no conflict of interest to disclose.
Additional information
Code availability
All analysis code is available at https://github.com/HAM-lab-Otago-University/UKBiobank-Brain-Body.
References
- 1.↵
- 2.↵
- 3.
- 4.
- 5.↵
- 6.↵
- 7.↵
- 8.
- 9.↵
- 10.↵
- 11.↵
- 12.
- 13.↵
- 14.↵
- 15.↵
- 16.↵
- 17.
- 18.
- 19.↵
- 20.↵
- 21.↵
- 22.↵
- 23.↵
- 24.↵
- 25.
- 26.↵
- 27.↵
- 28.↵
- 29.↵
- 30.↵
- 31.↵
- 32.↵
- 33.↵
- 34.↵
- 35.↵
- 36.↵
- 37.↵
- 38.↵
- 39.↵
- 40.↵
- 41.
- 42.
- 43.↵
- 44.↵
- 45.↵
- 46.
- 47.↵
- 48.↵
- 49.↵
- 50.↵
- 51.↵
- 52.↵
- 53.↵
- 54.↵
- 55.↵
- 56.↵
- 57.↵
- 58.
- 59.↵
- 60.↵
- 61.↵
- 62.↵
- 63.
- 64.↵
- 65.↵
- 66.↵
- 67.
- 68.↵
- 69.↵
- 70.↵
- 71.
- 72.↵
- 73.
- 74.↵
- 75.↵
- 76.↵
- 77.↵
- 78.↵
- 79.↵
- 80.
- 81.↵
- 82.↵
- 83.↵
- 84.↵
- 85.↵
- 86.↵
- 87.↵
- 88.↵
- 89.
- 90.↵
- 91.↵
- 92.
- 93.
- 94.↵
- 95.↵
- 96.
- 97.
- 98.
- 99.↵
- 100.↵
- 101.
- 102.↵
- 103.↵
- 104.↵
- 105.↵
- 106.↵
- 107.
- 108.↵
- 109.↵
- 110.↵
- 111.↵
- 112.↵
- 113.↵
- 114.↵
- 115.
- 116.
- 117.
- 118.↵
- 119.↵
- 120.↵
- 121.↵
- 122.↵
- 123.↵
- 124.↵
- 125.
- 126.↵
- 127.↵
- 128.
- 129.
- 130.
- 131.↵
- 132.↵
- 133.↵
- 134.↵
- 135.
- 136.↵
- 137.↵
- 138.
- 139.↵
- 140.↵
- 141.
- 142.
- 143.↵
- 144.↵
- 145.↵
- 146.↵
- 147.↵
- 148.↵
- 149.↵
- 150.↵
- 151.↵
- 152.
- 153.↵
- 154.↵
- 155.↵
- 156.↵
- 157.
- 158.↵
- 159.↵
- 160.↵
- 161.↵
- 162.↵
- 163.↵
- 164.↵
- 165.↵
- 166.↵
- 167.↵
- 168.↵
- 169.↵
- 170.↵
- 171.↵


