
Abstract
Resolving chromatin remodeling-linked gene expression changes at cell type resolution is important for understanding disease states. We describe MAGICAL, a hierarchical Bayesian approach that leverages paired scRNA-seq and scATAC-seq data from different conditions to map disease-associated transcription factors, chromatin sites, and genes as regulatory circuits. By simultaneously modeling signal variation across cells and conditions in both omics data types, MAGICAL achieved high accuracy on circuit inference. We applied MAGICAL to study Staphylococcus aureus sepsis from peripheral blood mononuclear single-cell data that we generated from infected subjects with bloodstream infection and from uninfected controls. MAGICAL identified sepsis-associated regulatory circuits predominantly in CD14 monocytes, known to be activated by bacterial sepsis. We addressed the challenging problem of distinguishing host regulatory circuit responses to methicillin-resistant- (MRSA) and methicillin-susceptible Staphylococcus aureus (MSSA) infections. While differential expression analysis failed to show predictive value, MAGICAL identified epigenetic circuit biomarkers that distinguished MRSA from MSSA.
Introduction
Gene expression can be modulated through the interplay of proximal and distal regulatory domains brought together in 3D space1. Chromatin regulatory domains, transcription factors, and downstream target genes form regulatory circuits2. In disease, these circuits could be dysregulated in specific cell types3. Identifying the impact of disease on regulatory circuits requires a framework for mapping regulatory domains with chromatin accessibility changes to altered gene expression in the context of genomic looping and at cell-type resolution4. Single-cell data (scRNA-seq and scATAC-seq) characterizing disease states have improved the identification of differential chromatin sites and/or differentially expressed genes within individual cell types3,5,6. Yet, advances in single-cell assay technology have outpaced the development of methods to maximize the value of multiomics datasets for studying disease-associated regulation. Recent approaches7-10 to support integrated analysis of multiomics data demonstrate the promise of this area but lack the capacity to resolve high-resolution regulation changes within individual cell types, which precludes elucidating regulatory circuits affected by the disease or different disease states.
To address these, we developed MAGICAL (Multiome Accessibility Gene Integration Calling And Looping), a method that models coordinated chromatin accessibility and gene expression variation to identify circuits that differ between conditions. MAGICAL analyzes scRNA-seq and scATAC-seq data using a hierarchical Bayesian framework that improves model robustness by leveraging information on transcription factor motifs and 3D topologically associated domains. To accurately detect differences in regulatory circuit activity between conditions, MAGICAL introduces hidden variables for explicit modeling of signal and noise in both the scRNA-seq and scATAC-seq data. Because regulatory circuits are cell-type specific11, MAGICAL reconstructs them at cell-type resolution. Systematic benchmarking against multiple public datasets supported the accuracy of MAGICAL-identified regulatory circuits.
Staphylococcus aureus, a bacterium often resistant to common antibiotics, is a major cause of severe infection and mortality12,13. We applied MAGICAL to identify host response regulatory circuits modulated during S. aureus bloodstream infection, and circuits that discriminate the responses to methicillin-resistant (MRSA) and methicillin-susceptible S. aureus (MSSA). Using single-cell multiomics data generated for this study, MAGICAL identified host circuits that accurately predicted S. aureus infection in multiple validation datasets. Moreover, in contrast to conventional differential analysis that failed to identify robust antibiotic-sensitivity specific signals, MAGICAL identified circuit genes that can differentiate MRSA from MSSA. MAGICAL is a general framework and can accurately identify regulatory circuits modulated by any disease, condition, or perturbation.
Results
MAGICAL framework
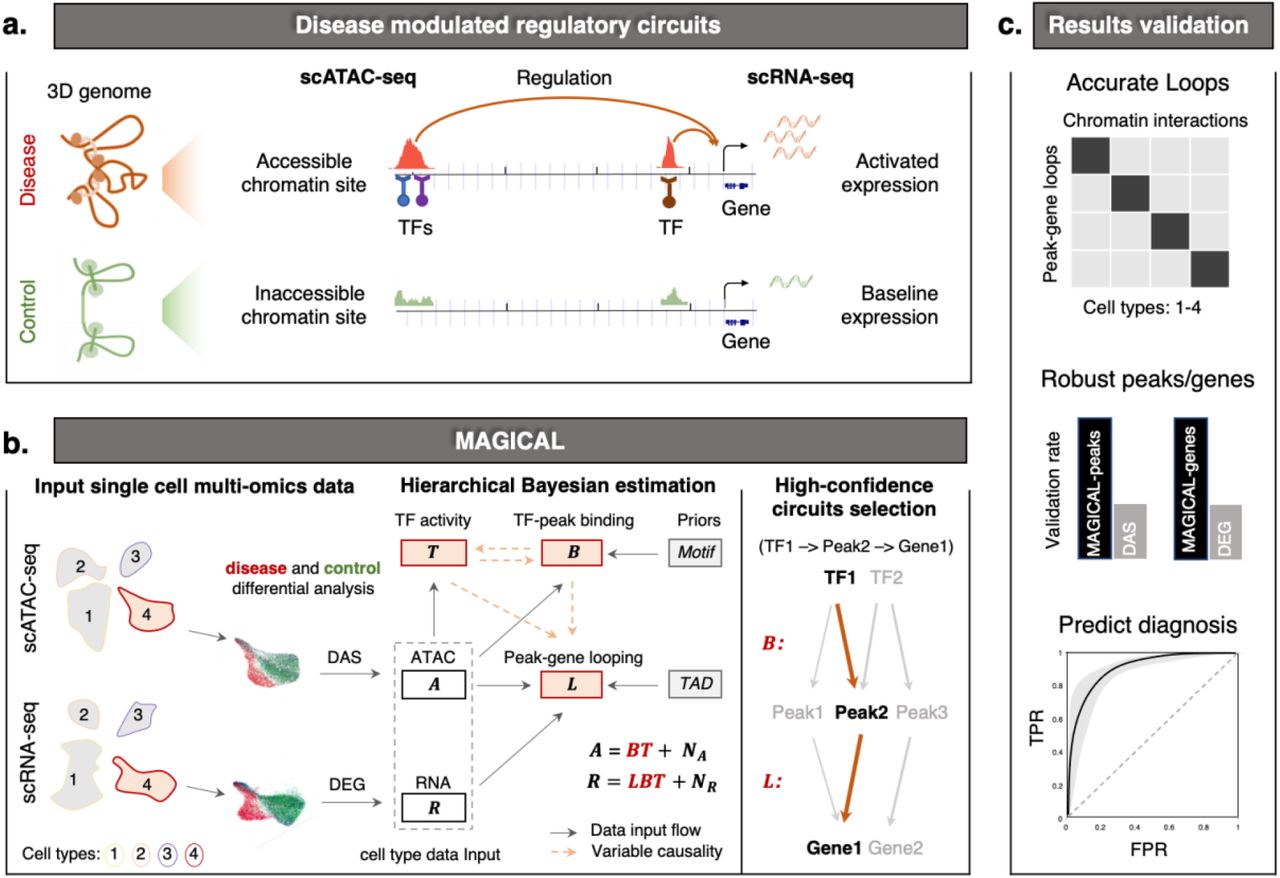
MAGICAL identifies disease-associated regulatory circuits by comparing single-cell multiomics data (scRNA-seq and scATAC-seq) from disease and control samples (Fig.1a). The framework incorporates transcription factor (TF) motifs and chromatin topologically associated domains (TAD) as prior information to infer regulatory circuits comprising chromatin regulatory sites, modulatory TFs, and downstream target genes for each cell type (see Methods for details). In brief, to build candidate disease-modulated circuits, differentially accessible sites (DAS) within each cell type are first associated with TFs by motif sequence matching and then linked to differentially expressed genes (DEG) in that cell type by genomic localization within the same TAD. Next, MAGICAL uses a Bayesian framework to iteratively model chromatin accessibility and gene expression variation across cells and samples in each cell type and to estimate the confidence of TF-peak and peak-gene linkages for each candidate circuit (Fig.1b).

(a) Altered gene expression between disease and control conditions can be attributed to chromatin accessibility changes of proximal and distal chromatin sites regulated by TFs. (b) To identify disease-associated regulatory circuits in a selected cell type (including ATAC assay cells and RNA assay cells from samples being compared), MAGICAL selects DAS as candidate regions and DEG as candidate genes. Then, the filtered ATAC data (A) and RNA data (R) of candidate regions and genes, together with the prior information of TF motifs and genomic domains provided by TADs, are integrated into a hierarchical Bayesian framework for circuit inference. MAGICAL estimates TF-peak binding confidence (B) and the hidden TF activity (T) to fit ATAC data and then use them to estimate the peak-gene looping (L) by fitting RNA data. Variables B, T, and L are iteratively estimated in a Bayesian framework to minimize fitting residuals (NA and NR). Finally, regulatory circuits with high-confidence linkage (e.g., TF1 - Peak2 - Gene1) are selected. (c) Benchmarking circuits against independent validation datasets demonstrates that MAGICAL results are accurate, and the circuit genes can be used as signatures to predict the diagnosis of disease states.
To accurately identify varying circuits between different conditions, the MAGICAL framework introduces variables to explicitly model signal and noise in chromatin accessibility and gene expression data in each cell type (Fig.1b; see Methods for details). The circuit TF-peak binding variable and a hidden TF activity variable are jointly estimated to fit to the chromatin accessibility variation across cells from the conditions being compared. These two variables are then used together with the circuit peak-gene looping variable to fit the gene expression variation. Using Gibbs sampling, MAGICAL iteratively optimizes the states of TF-peak-gene linkages by controlling the variances of fitting residuals (data noise) in both modalities. Finally, high-confidence circuits fitting the signal variation in both data types are selected.
MAGICAL makes the assumption that, in each cell type, the activities of a TF have the same distribution in cells from both modalities if these cells are sequenced from the same sample. MAGICAL learns the distribution for each TF, infers the TF activity for every cell, and fits the chromatin accessibility and gene expression data, respectively (Fig. S1). This procedure eliminates the limitation of existing correlation-based approaches that require a one-to-one, cell-level pairing of RNA-seq and ATAC-seq data. It makes MAGICAL a general tool that can analyze single-cell true multiome or sample-paired multiomics datasets.
We validated MAGICAL in multiple ways, demonstrating that it infers regulatory circuits accurately. The MAGICAL-inferred linkages between chromatin sites and genes show high correspondence to experimental 3D chromatin interactions. The resulting genes and peaks are more robust than the ones obtained through conventional differential analysis using one modality alone. And finally, the circuit genes can accurately classify disease states, providing a rapid solution to challenging diagnostic problems (Fig. 1c).
Comparative analysis of performance
MAGICAL is a scalable framework. It can infer regulatory circuits of TFs, chromatin regions and genes with differential activities between multiple conditions or infer regulatory circuits with active chromatin regions and genes in a single condition.
Existing integrative methods9,10,14 use single-condition data only and correlate chromatin site accessibility and gene expression primarily for peak-gene looping inference. To provide a comparative assessment of the performance of MAGICAL, we restricted MAGICAL to the single-condition data analysis possible with existing methods.
For peak-gene looping inference, we compared MAGICAL to the TRIPOD9 and FigR14 methods, using the same benchmark single-cell multiome datasets as used by the authors reporting these methods. In the comparison of MAGICAL with TRIPOD using a 10X multiome single-cell dataset [https://support.10xgenomics.com/single-cell-multiome-atac-gex/datasets/1.0.0/pbmc_granulocyte_sorted_10k], MAGICAL-inferred peak-gene loops showed significantly higher enrichment of experimentally observed chromatin interactions in blood cells in the 4DGenome database15 (Fisher exact test P<0.0001, Fig. S2a), the same validation data used by TRIPOD developers. MAGICAL also significantly outperformed FigR on the application to a GM12878 SHARE-seq dataset8. In that case, the peak-gene loops in MAGICAL-selected circuits had significantly higher enrichment of H3K27ac HiChIP chromatin interactions16 than did FigR (Fisher exact test P<0.0001, Fig. S2b).
Because the MAGICAL framework, unlike TRIPOD and FigR, used chromatin TAD as prior information, we evaluated whether the improvement in performance resulted solely from this additional information. To investigate this, we eliminated the use of TAD and modified MAGICAL for this test by assigning candidate linkages between peaks and genes within 500kb. As shown in Fig.S2c and S2d, even without the TAD prior information, MAGICAL still outperformed the competing methods (Fisher exact test p<0.001). Overall, these results suggest that in addition to the benefit of priors, explicit modeling of signal and noise in both chromatin accessibility and gene expression data increased the accuracy of peak-gene looping identification.
Validation of disease modulated circuits
To demonstrate the accuracy of the main application of MAGICAL, inferring disease-modulated circuits, we applied MAGICAL to sample-paired peripheral blood mononuclear cell (PBMC) scRNA-seq and scATAC-seq data from SARS-CoV-2 infected individuals and healthy controls3. Because immune responses in COVID-19 patients differ according to disease severity17,18, MAGICAL inferred the regulatory circuits for mild and severe clinical groups separately. The chromatin sites and genes in the identified circuits were validated using newly generated and publicly available independent COVID-19 single-cell datasets (Fig.2a). We primarily focused on three cell types that have been found to show widespread gene expression and chromatin accessibility changes in response to SARS-CoV-2 infection19,20, including CD8 effector memory T (TEM) cells, CD14 monocytes (Mono), and natural killer (NK) cells. The identified circuits in each cell type for mild and severe clinical groups can be found in Table S1.

(a) We applied MAGICAL to a COVID-19 PBMC single-cell multiomics dataset and identified circuits for the clinical mild and severe groups, respectively. We validated the circuit-associated chromatin sites and genes using newly generated and independent COVID-19 single-cell datasets. (b) UMAPs of a newly generated scATAC-seq dataset including 16K cells from six COVID-19 subjects and 9K cells from three showed chromatin accessibility changes in CD8 TEM, CD14 Mono, and NK cell types. (c-f) Using validation datasets, within each cell type we showed that a significantly higher proportion of MAGICAL-selected chromatin sites and genes are validated to be differentially accessible and differentially expressed in the same cell type between infection and control conditions (Fisher exact test, *P < 0.05, **P < 0.01, ***P < 0.001, ****P < 0.0001). (c)(e) for mild COVID-19 and (d)(f) for severe COVID-19. The error bars represent the standard error.
To confirm the circuit chromatin sites selected by MAGICAL for mild COVID-19, we generated an independent PBMC scATAC-seq dataset from six SARS-CoV-2-infected subjects with mild symptoms and three uninfected (PCR-negative) controls (Fig. 2b; Table S2; see Methods). This dataset produced three mild COVID-19 validation peak sets, one for each cell type. For severe COVID-19, an existing study focused on T cells identified specific chromatin activity changes with severe COVID-19 in CD8 T cells21. We used their reported chromatin sites for validating the circuit chromatin sites identified in CD8 T cells. In all four validation sets, significantly higher proportions of the MAGICAL-selected chromatin sites than DAS were found (Fisher exact test P<0.001, Fig. 2c and d).
When multiple potential chromatin regulatory loci are identified in the vicinity of a specific gene, it is commonly assumed that the locus closest to the TSS is likely to be the most important regulatory site. Challenging this assumption, however, are the results of experimental studies showing that genes may not be regulated by the nearest region22,23. Supporting the importance of more distal regulatory loci, MAGICAL-selected chromatin sites significantly outperformed the closest DAS on the independent COVID-19 datasets (Fisher exact test p<0.05, Fig. 2c and 2d).
To validate the circuit genes modulated by mild and severe COVID-19, we used genes reported by external COVID-19 single-cell studies17,24,25. In total, we collected six validation gene sets (three cell types for mild COVID-19 and three cell types for severe COVID-19). The MAGICAL-selected circuit genes significantly outperformed DEG in all validations (Fisher’s exact test p<0.05, Fig. 2e and 2f). These results confirmed the increased accuracy of disease association for both chromatin sites and genes in MAGICAL-identified circuits.
MAGICAL analysis of S. aureus sepsis single-cell multiomics data
We applied MAGICAL to the clinically important challenge of distinguishing methicillin-resistant (MRSA) and methicillin-susceptible S. aureus (MSSA) infections26-28. We profiled paired scRNA-seq and scATAC-seq data using human PBMCs from adults who were blood culture positive for S. aureus, including 10 MRSA and 11 MSSA, and from 23 uninfected control subjects (Fig. 3a; Table S3). To integrate scRNA-seq data from all samples, we implemented a Seurat29-based batch correction and cell type annotation pipeline. In total, 276,200 cells were selected and labeled (Fig. 3b and Fig. S3). We integrated scATAC-seq data from all samples using ArchR30 and selected and annotated 70,174 high-quality cells (Fig. 3c and Fig. S3). Data integration was described in detail in the Methods section. 13 common cell types that surpassed the 200 cell threshold in each modality were selected for subsequent analysis.

(a) We collected PBMC samples from 10 MRSA-infected, 11 MSSA-infected, and 23 healthy control subjects and generated same-sample scRNA-seq and scATAC-seq data using separate assays. (b) UMAP of integrated scRNA-seq data with 18 PBMC cell subtypes. (c) UMAP of integrated scATAC-seq data with 13 PBMC cell subtypes. Under-represented subtypes including cDC1, CD4 TEM, CD8 CTL, pDC, and Plasmablast, altogether representing less than 5% of cells in the scRNA-seq data, were not recovered from the scATAC-seq data. (d) Number of MAGICAL-identified regulatory circuits for each cell type and in contrast analysis. (e) Circuit peak-gene interactions were significantly enriched with pcHi-C interactions in the same cell types (adjusted hypergeometric **P < 0.01, ***P < 0.001, ****P< 0.0001). (f-h)Analyzing TFs, chromatin sites, and genes in the MAGICAL-identified regulatory circuits for CD14 monocytes, we found that: (f) AP-1 proteins are mostly significantly enriched at chromatin regions with increased accessibility in the infection condition; (g) in comparison to all accessible chromatin sites, an increased proportion of MAGICAL circuit chromatin sites were located in the range of 10kb to 30kb relative to gene TSS; and (h) the circuit genes were significantly enriched with experimentally confirmed epi-genes. The gray area in (g) represents the 95% confidence interval.
MAGICAL selected high-confidence regulatory circuits in each cell type for three contrasts (MRSA vs Control, MSSA vs Control, and MRSA vs MSSA) (Table S4; see Methods). It has been reported that activation of CD14 monocytes plays a principal role in response to S. aureus infection31,32. In MAGICAL analysis, CD14 monocytes showed the highest number of regulatory circuits (Fig.3d). Circuits identified in each cell type were further validated using physical chromatin interactions reported in a reference promoter capture (pc) Hi-C dataset11. In all the cell types for which cell type-specific pcHi-C data was available (B cells, CD4 T cells, CD8 T cells, CD14 monocytes), the circuit peak-gene interactions showed significant enrichment of pcHi-C interactions in the same cell type (Fig.3e; hypergeometric P < 0.01). For comparison, we also performed the peak-gene interaction enrichment analysis between different cell types, finding significantly lower enrichment levels (Wilcoxon rank-sum test P = 3e-5; see Methods). These results indicate cell-type specificity of MAGICAL-identified circuits.
In CD14 monocytes, MAGICAL identified AP-1 complex proteins as the most important regulators, especially at chromatin sites showing increased activity in infection cells (Fig.3f). This finding is consistent with the importance of these complexes in gene regulation in response to a variety of infections3,33,34. Supporting the accuracy of the identified TFs, we compared circuit chromatin sites with ChIP-seq peaks from the Cistrome database35. The most similar TF ChIP-seq profiles were from AP-1 complex JUN/FOS proteins in blood or bone marrow samples (Fig.S4). Moreover, functional enrichment analysis36 of the circuit genes showed that cytokine signaling, a known pathway mediated by AP-1 factors and associated with the inflammatory responses in macrophages37,38, was the most enriched.
MAGICAL modeled regulatory effects of both proximal and distal regions on genes. We examined the chromatin site location relative to the target gene TSS, for circuits chromatin sites and genes identified for CD14 monocytes. Compared to all ATAC peaks called around the circuit genes, an increased proportion of circuit chromatin sites were located 10kb to 30kb away from the TSS (Fig.3g). This pattern is consistent with the 24.1 kb median enhancer distance found by CRISPR-based perturbation in a blood cell line39. In addition, nearly 50% of circuit chromatin sites were overlapping with enhancer-like regions in the ENCODE database40, further emphasizing that MAGICAL circuits are enriched in distal regulatory loci. We also found that these circuit chromatin sites were significantly enriched in inflammatory-associated GWAS loci reported in the GWAS catalog database41, suggesting active host epigenetic responses to infectious diseases (Fig.S5; Wilcoxon test P < 0.005; see Methods). Notably, one distal chromatin site (hg38 chr6: 32,484,007-32,484,507) looping to HLA-DRB1 is within the most significant GWAS region (hg38 chr6: 32,431,410-32,576,834) associated with S. aureus infection42.
We finally compared circuit genes to existing epi-genes whose transcriptions were significantly driven by epigenetic perturbations in CD14 monocytes43. MAGICAL-identified circuit genes were significantly enriched with epi-genes (hypergeometric P < 0.005, Fig.3h) while the remaining DEG not selected by MAGICAL, or those mappable with DAS either within the same topological domains or closest to each other showed no evidence of being epigenetically driven. These results suggest that MAGICAL accurately identified regulatory circuits activated in response to S. aureus infection.
S. aureus infection prediction
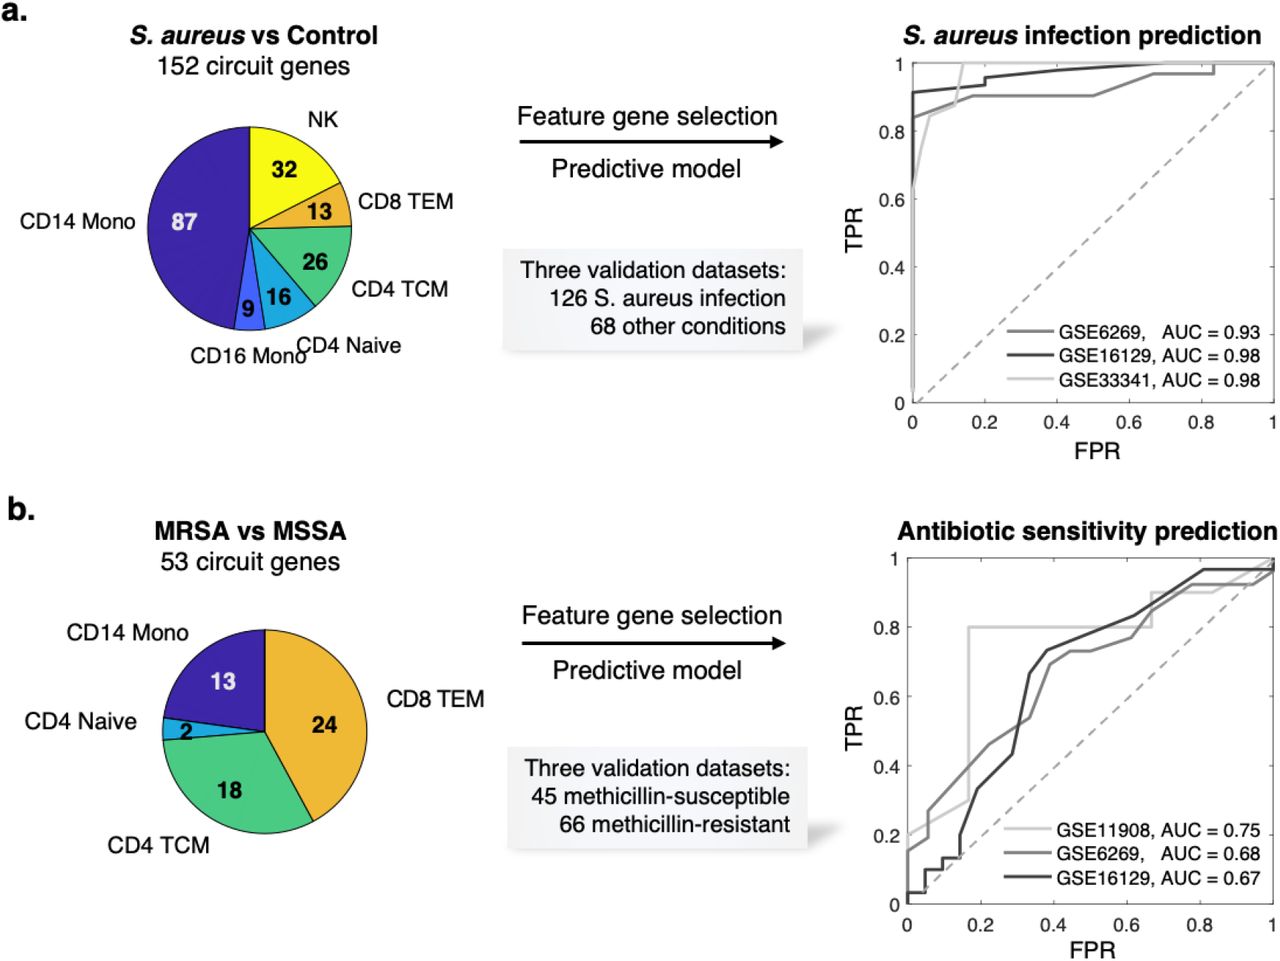
Early diagnosis of S. aureus infection and the strain antibiotic sensitivity is critical to appropriate treatment for this life-threatening condition. We first evaluated whether the MAGIC-identified circuit genes that are in common to MRSA and MSSA could provide a robust signature for predicting the diagnosis of S. aureus infection in general. Within each cell type, we selected circuit genes common to both the MRSA and MSSA analyses, resulting in 152 genes (Fig.4a; Table S5). To evaluate this S. aureus infection, we collected external, public expression data of S. aureus infection from the GEO database (https://www.ncbi.nlm.nih.gov/geo/). In total, we found one adult whole-blood44 and two pediatric PBMC bulk microarray datasets45,46 that comprised a total of 126 S. aureus infected subjects and 68 uninfected controls. The use of pediatric validation data has the advantage of providing a much more rigorous test of the robustness of MAGICAL-identified circuit genes for classifying disease samples in this very different cohort.

(a) Circuit genes in common to MRSA and MSSA infections achieved a near-perfect classification of S. aureus infected and uninfected samples in multiple independent datasets (one adult dataset and two pediatric datasets). (b) Circuit genes that differed between MRSA and MSSA showed predictive value of antibiotic sensitivity in independent patient samples (three pediatric datasets), while expression DEG showed no predictive value (Fig. S7).
To allow validation using public bulk transcriptome datasets, we refined the 152 circuit genes set by selecting those with robust performance in our dataset at pseudobulk level. We calculated an AUROC for each circuit gene by classifying S. aureus infection and control subjects using pseudobulk gene expression (aggregated from the discovery scRNA-seq data). 71 circuit genes with AUROCs greater than 0.8 were selected (Table S5). Functional gene enrichment analysis showed that IL-17 signaling was most enriched in this set (P = 5e-8), including genes from AP-1, Hsp90, and S100 families. IL-17 had been found to be essential for the host defense against cutaneous S. aureus infection in mouse models47. We trained an SVM model using the 71 circuit genes as features and their discovery pseudobulk gene expression as input. We then applied the trained SVM model to each of the three validation datasets. The model achieved high prediction performance on all datasets, showing AUROCs from 0.93 to 0.98 (Fig.4a).
This generalizability of circuit genes for predicting infection in different cohorts suggested that MAGICAL identifies regulatory processes that are fundamental to the host response to S. aureus sepsis. We further evaluated this by comparing the 71 circuit genes to 274 filtered DEG (per gene AUROC >0.8 in the discovery pseudobulk gene expression data). We examined the differential expression π-value48 (a statistic score that combines both fold change and p-values) of genes in the validation datasets and found significantly higher π-values for the circuit genes (Fig. S6, Wilcoxon rank-sum test P < 9.0e-3).
S. aureus antibiotic sensitivity prediction
We then addressed the challenging problem of predicting strain antibiotic sensitivity in S. aureus infection. Reflecting the difficulty of this problem, we first trained a model using expression based DEGs (226 genes having AUROC >0.7 in the discovery dataset) for distinguishing MRSA and MSSA. When we applied this model to three pediatric PBMC microarray datasets45,46,49 comprising a total of 66 methicillin-resistant and 45 methicillin-susceptible samples, the model showed no predictive value for any of the validation datasets (Fig.S7a; see Methods). We also tested the prediction performance of the top DEG (as the same number of circuit genes selected by MAGICAL for this problem) but found little performance improvement (Fig.S7b). These results suggest that using host gene expression alone is not sufficient to predict the antibiotic sensitivity of the infected strain.
With MAGICAL we identified 53 circuit genes from the comparative multiomics data analysis between MRSA and MSSA (Fig.4b; Table S6). A new model trained using 32 circuit genes that were robustly differential in the discovery pseudobulk data (per gene AUROC >0.7) finally distinguished antibiotic-resistant and antibiotic-sensitive samples in all three validation datasets, with AUROCs from 0.67 to 0.75 (Fig.4b). The performance of the circuit gene-based model and the failure of the DEG-based model demonstrated that MAGICAL captured generalizable regulatory differences in the host immune response to these closely related bacterial infections.
Discussion
MAGICAL addressed the previously unmet need of identifying differential regulatory circuits based on single-cell multiomics data from different conditions. Critically, it identifies regulatory circuits involving distal chromatin sites. The previously difficult-to-predict distal regulatory regions are increasingly recognized as key for understanding gene regulatory mechanisms. MAGICAL provides a robust framework to infer regulatory circuits contributing to disease states.
Using newly generated PBMC single-cell multiomics data, MAGICAL identified the regulatory circuits characteristic of the human immune response to S. aureus infection. Our thorough analysis of MAGICAL circuits and independent data validation demonstrate the ability of MAGICAL to use epigenetic context to identify robust immune cell responses specific to these infections. Despite profound differences between the discovery and the validation cohorts (adult vs. pediatric) and technologies and data resolution (single-cell sequencing vs. bulk microarray), MAGICAL-identified circuit genes achieved high prediction performance on the latter.
MAGICAL is a general tool for single-cell multiomics data analysis. It performs both single-condition or contrast-condition analysis and can also be applied to data from more conditions. Circuits with varying linkages across conditions reflect condition-specific regulation. MAGICAL provides a high-resolution lens to systematically study the regulatory control mechanism.
Methods
S. aureus patient and control samples selection
Patients with culture-confirmed S. aureus bloodstream infection transferred to DUMC are eligible if pathogen speciation and antibiotic susceptibilities are confirmed by the Duke Clinical Microbiology Laboratory. Patient or patient’s legally authorized representative provides signed informed consent allowing participation unless patient expires prior to notification of blood culture results. DNA and RNA samples, PBMCs, clinical data, and the bacterial isolate from the subject are cataloged using an IRB-approved Notification of Decedent Research. We excluded samples if prior enrollment of the patient in this investigation (to ensure statistical independence of observations) or they are polymicrobial (i.e., more than one organism in blood or urine culture). In total, 21 adult patients were selected with 10 MRSAs and 11 MSSAs. None of them received any antibiotics in the 24 h before the bloodstream infection. Control samples were obtained from uninfected healthy adults matching the sample number and age range of the patient group. In total, 23 samples were collected from two cohorts: 14 controls provided by from the Weill Cornell Medicine, New York, NY, and 9 controls (provided by the Battelle Memorial Institute, Columbus, OH. Meta information of the selected subjects were provided in Table S3.
PBMC thawing
Frozen PBMC vials were thawed in a 37°C-waterbath for 1 to 2 minutes and placed on ice. 500μl of RPMI/20% FBS was added dropwise to the thawed vial, the content was aspirated and added dropwise to 9ml of RPMI/20% FBS. The tube was gently inverted to mix, before being centrifuged at 300xg for 5 min. After removal of the supernatant, the pellet was resuspended in 1-5ml of RPMI/10% FBS depending on the size of the pellet. Cell count and viability were assessed with Trypan Blue on a Countess II cell counter (Invitrogen).
Nuclei isolation
Thawed PBMCs were washed with PBS/0.04% BSA. Cells were counted and 100,000-1,000,000 cells were added to a 2mL-microcentrifuge tube. Cells were centrifuged at 300xg for 5min at 4°C. The supernatant carefully completely removed, and 0.1X lysis buffer (1x: 10mM Tris-HCl pH 7.5, 10mM NaCl, 3mM MgCl2, nuclease-free H2O, 0.1% v/v NP-40, 0.1% v/v Tween-20, 0.01% v/v digitonin) was added. After 3min incubation on ice, 1ml of chilled wash buffer was added. The nuclei were pelted at 500xg for 5min at 4°C and resuspended in a chilled diluted nuclei buffer (10X Genomics) for scATAC-seq. Nuclei were counted and the concentration was adjusted to run the assay.
S. aureus scATAC-seq data generation
ScATAC-seq was performed immediately after nuclei isolation and following the Chromium Single Cell ATAC Reagent Kits V1.1 User Guide (10x Genomics, Pleasanton, CA). Transposition was performed in 10μl at 37°C for 60min on at least 1,000 nuclei, before loading of the Chromium Chip H (PN-2000180). Barcoding was performed in the emulsion (12 cycles) following the Chromium protocol. After post GEM cleanup, libraries were prepared following the protocol and were indexed for multiplexing (Chromium i7 Sample Index N, Set A kit PN-3000427). Each library was assessed on a Bioanalyzer (High-Sensitivity DNA Bioanalyzer kit).
S. aureus scATAC-seq data integration and cell type annotation
Reads of scATAC-seq experiments were aligned to human reference genome (hg38) using 10x Genomics Cell Ranger software (version 1.2). The resulting fragment files were processed using ArchR30. Quality cells were selected based on per cell TSS enrichment > 12, the number of fragments >3000 and <30000, and nucleosome ratio <2. The likelihood of doublet cells was computationally assessed using ArchR’s addDoubletScores function and cells were filtered using the ArchR’s filterDoublets function with default settings. Cells passing quality and doublet filters from each sample were combined into a linear dimensionality reduction using ArchR’s addIterativeLSI function with the input of the tile matrix (read counts in binned 500bps across the whole genome) with iterations = 2 and varFeatures = 20000. This dimensionality reduction was then corrected for batch effect using the Harmony method50, via ArchR’s addHarmony function. The cells were then clustered based on the batch-corrected dimensions using ArchR’s addClusters function. We annotated scATAC-seq cells using ArchR’s addGeneIntegrationMatrix function, referring to a labeled multimodal PBMC single cell dataset (https://atlas.fredhutch.org/nygc/multimodal-pbmc/). Doublet clusters containing a mixture of many cell types were manually identified and removed. In total, 70,174 high-quality cells and 13 cell types with at least 200 cells in each were selected for the subsequent analysis.
S. aureus scRNA-seq data generation
ScRNA-seq was performed as described (10x Genomics, Pleasanton, CA), following the Single Cell 3’ Reagents Kits V3.1 User Guidelines. Cells were filtered, counted on a Countess instrument, and resuspended at a concentration of 1,000 cells/μl. The number of cells loaded on the chip was determined based on the 10X Genomics protocol. The 10X chip (Chromium Single Cell 3’ Chip kit G PN-200177) was loaded to target 5,000-10,000 cells final. Reverse transcription was performed in the emulsion and cDNA was amplified following the Chromium protocol. Quality control and quantification of the amplified cDNA were assessed on a Bioanalyzer (High-Sensitivity DNA Bioanalyzer kit) and the library was constructed. Each library was tagged with a different index for multiplexing (Chromium i7 Multiplex Single Index Plate T Set A, PN-2000240) and quality controlled by Bioanalyzer prior to sequencing.
S. aureus scRNA-seq data integration and cell type annotation
Reads of scRNA-seq experiments were aligned to human reference genome (hg38) using Cell Ranger v3.1.0 and. The filtered feature-by-barcode count matrices were then processed using Seurat29. Low-quality cells with less than 400 mRNA reads (suggesting potential empty droplets), with more than 5,000 mRNA reads (potential doublets or multiplets), or with more than 10% of mitochondrial content (dying cells) were excluded. Cell cycle phase scores were calculated using the canonical markers for G2M and S phases embedded in the Seurat package. Finally, the effects of mitochondrial reads and cell cycle heterogeneity were regressed out using SCTransform. To integrate cells from heterogeneous disease samples, we first built a reference by integrating and annotating cells from the uninfected control samples using a Seurat-based pipeline. For batch correction, we identified the intrinsic batch variants and used Seurat to integrate cells together with the inferred batch labels. All control samples were integrated into one harmonized query matrix. Each cell was assigned a cell type label by referring to the same reference PBMC single cell dataset used above. The cell type label of each cell cluster was determined by most cell labels in each. Canonical markers were used to refine the cell type label assignment. This integrated control object was used as reference to map the infected samples. To avoid artificially removing the biological variance between each infected sample during batch correction, we computationally predicted and manually refined cell types for each sample. All infection samples were projected onto the UMAP of the control object for visualization purpose. In total, 276,200 high-quality cells and 19 cell types with at least 200 cells in each were selected for the subsequent analysis.
Differentially accessible chromatin sites and differentially expressed genes
Within each cell type, differentially accessible chromatin sites (DAS) between contrast conditions (MRSA vs Control, MSSA vs Control or MRSA vs MSSA) were selected from the single cell chromatin accessibility data (Wilcoxon test FDR < 0.05 and |log2FC|>0.1). Notably, due to the high false positive rate in single cell-based differential analysis51, we further refined the DAS by fitting a linear model to the aggregated pseudobulk chromatin accessibility (regression P <0.05 and |log2FC|>0.3). Similarly, differentially expressed genes (DEG) between contrast conditions were first selected using single cell expression data (Wilcoxon test FDR < 0.05 and |log2FC|>0.1) and then refined using the aggregated pseudobulk gene expression data (regression P <0.05 and |log2FC|>0.3).
MAGICAL
To build candidate regulatory circuits, TFs were mapped to the selected DAS by searching for 870 human motifs from the chromVARmotifs library (https://github.com/GreenleafLab/chromVARmotifs) using ArchR’s addMotifAnnotations function. The binding DAS were then linked with DEG by requiring them in the same topological domains. Prior topological domains in blood context were obtained from a GM12878 cell line Hi-C dataset52 using TopDom53. About 6000 topological domains were used. A candidate circuit includes a chromatin region and a gene in the same domain, with at least one TF motif match in the region.
For each cell type (i.e. i-th cell type), MAGICAL inferred the confidence of TF-peak binding and peak-gene looping in each candidate circuit using a hierarchical Bayesian framework with two models: a model of TF-peak binding confidence (B) and hidden TF activity (T) to fit chromatin accessibility (A); a second model of peak-gene interaction (L) and the refined (noise removed) regulatory region activity (BT) to fit gene expression (R).


 a P by KA,S matrix with each element
  representing the ATAC read count of p-th chromatin site (ATAC peak) in kA,s-th cell in s-th sample.
 a G by KR,S matrix with each element
  representing the RNA read count of g-th gene in kR,s-th cell of s-th sample.
 and
and  represented data noise in corresponding to
  and
and  .
.
BP×M,i: a P by M matrix with each element bp,m,i representing the binding confidence of m-th TF on p-th candidate chromatin site.
LG×P,i: a G by P matrix with each element lp,g,i representing the interaction between p-th chromatin site and g-th gene.
 a M by KA,S matrix with each element
  representing the hidden TF activity of m-th TF in kA,s-th ATAC cell of s-th sample.
 a M by KR,S matrix with each element
  representing the hidden TF activity of m-th TF in kR,s-th RNA cell of s-th sample.
 and
and  were both extended from the same TM×S,i (with elements tm,s,i) by assuming that in i-th cell type and s-th sample, m-th TF’s regulatory activities in all ATAC cells and all RNA cells followed an identical distribution of a single variable tm,s,i. Therefore, KA,S,i and KR,S,i can be different numbers and MAGICAL will only estimate the matrix TM×S,i.
To select high-confidence regulatory circuits, MAGICAL estimated the confidence (probability) of TF-peak binding BP×M,i and peak-gene interaction LG×P,i together with the hidden variable TM×S,i in a Bayesian framework.
 Based on the regulatory relationship among chromatin sites, upstream TFs, and downstream genes (as illustrated in Fig. 1), the posterior probability of each variable can be approximated as:


 Although the prior states of bp,m,i and lp,g,i were obtained from the prior information of TF motif-peak mapping and topological domain-based peak-gene pairing, their values were unknown. We assumed zero-mean Gaussian priors for B, L and the hidden variable T by assuming that positive regulation and negative regulation would have the same priors, which is likely to be true given the fact that there were usually similar numbers of up-regulated and down-regulated peaks and genes after the differential analysis. We set a high variance (non-informative) in each prior distribution to allow the algorithm to learn the distributions from the input data.


 The likelihood functions P(A|B, T) and P(R|L, B, T) represent the fitting performance of the estimated variables to the input data. These two conditional probabilities are equal to the probabilities of the fitting residues
  and
and  , for which we assumed zero-mean Gaussian distributions and used an Inverse Gamma distribution with hyperparameters α and β to control the variance of fitting residues (very low probabilities on large variances).

 Then, the posterior probability of each variable defined in Eq. (4-6) was still a Gaussian distribution with poster mean
  and variance
  as shown below:


 Gibbs sampling was used to iteratively learn the posterior distribution mean and variance of each set of variables and draw samples of their values accordingly. For the TF-peak binding events, the posterior mean
  and variance
  were estimated specifically for m-th TF since the number of binding sites and the positive or negative regulatory effects between TFs could be very different.
 For TF activities, the posterior mean
  and variance
  were estimated specifically for m-th TF and s-th sample using chromatin accessibility data as follows:
 Then, based on the estimated distribution parameters of
  and
and  of
of  , for kR,s-th RNA cell in the same s-th sample we draw a TF regulatory activity sample as
  . For p-th peak, we were able to reconstruct its chromatin activity in the RNA cell as
  , and for g-th gene, we further estimated the interaction confidence
  between p-th peak and g-th gene. The peak-gene interaction distribution parameters
  and
and  were estimated as follows:
 In n-th round of Gibbs estimation, after learning all distributions, we estimated the confidence of each linkage by linearly mapping the sampled values of
  and
and  in the range of (-∞, ∞) to probabilities in (0,1) as follows:

 Binary state samples were then drawn based on the confidence of each linkage and were then used to initiate the next round of estimations. After running a long sampling process (in total N rounds) and accumulating enough samples on the binary states of TF-peak bindings and peak-gene interactions, we calculated the sampling frequency of each linkage as a posterior probability and selected high-confidence regulatory circuits as those with probabilities >0.8 on both TF-peak bindings and peak-gene interactions.
MAGICAL analysis of 10X PBMC single-cell true multiome data
For benchmarking, MAGICAL was applied to a 10X PBMC single cell multiome dataset (https://support.10xgenomics.com/single-cell-multiome-atac-gex/datasets/1.0.0/pbmc_granulocyte_sorted_10k), including 108377 ATAC peaks, 36601 genes, and 11909 cells from 14 cell types. MAGICAL used the same candidate peaks and genes as selected by TRIPOD9 for fair performance comparison. Two different ways were used to pair candidate peaks and genes: (1) the peaks and genes were within the same prior TAD from the GM12878 cell line; (2) the centers of peaks and the TSS of genes were within 500k bps. MAGICAL inferred regulatory circuits under each setting. TRIPOD identified peak-gene interactions were directly downloaded from the supplementary tables of their publication.
MAGICAL analysis of GM12878 cell line SHARE-seq data
For benchmarking, MAGICAL was applied to a GM12878 cell line SHARE-seq dataset8. Processed data files were downloaded from the GEO database (https://www.ncbi.nlm.nih.gov/geo/, under accession number GSE140203). For fair comparison, MAGICAL used the same candidate peaks and genes as selected by FigR14. MAGICAL was initialized with two different ways to pair candidate peaks and genes: (1) the peaks and genes were within the same prior TAD from the GM12878 cell line; (2) the centers of peaks and the TSS of genes were within 500k bps. MAGICAL inferred regulatory circuits under each setting. FigR peak-gene interaction results were downloaded from the supplementary files of their publication.
MAGICAL analysis of COVID-19 PBMC single-cell multiomics data
To validated disease-associated circuit chromatin sites and genes, MAGICAL was applied to a public PBMC COVID-19 single-cell multiomics dataset3. Processed scRNA-seq data was downloaded from the COVID-19 Cell Atlas (https://www.covid19cellatlas.org/). For each of the three selected cell subtypes CD8 TEM, CD14 Mono, and NK, we downloaded the identified DEG for mild or severe infections from the supplementary files of their publication. As no processed scATAC-seq files were provided, the raw fragment files were downloaded from the GEO database (https://www.ncbi.nlm.nih.gov/geo/, under accession number GSE174072) and processed by following all steps as introduced in the paper. For each of the selected cell types, DAS were called specifically for mild and severe clinical groups, respectively. MAGICAL was initialized by mapping prior TF motifs from the ‘chromVARmotifs’ library to DAS using ArchR’s addMotifAnnotations and pairing DAS and DEG using the prior blood topological domains. Respectively for mild and severe COVID-19, chromatin sites and genes in regulatory circuits with TF-peak binding probability > 0.8 and peak-gene interaction probability > 0.95 in each cell type were selected as disease associated and further validated on newly generated and external single cell datasets.
PBMC scATAC-seq data for mild COVID-19 validation study
To validate chromatin sites associated with mild COVID-19, PBMC samples were obtained from the COVID-19 Health Action Response for Marines (CHARM) cohort study, which has been previously described54. The cohort is composed of Marine recruits that arrived at Marine Corps Recruit Depot—Parris Island (MCRDPI) for basic training between May and November 2020, after undergoing two quarantine periods (first a home-quarantine, and next a supervised quarantine starting at enrolment in the CHARM study) to reduce the possibility of SARS-CoV-2 infection at arrival. Participants were regularly screened for SARS-CoV-2 infection during basic training by PCR, serum samples were obtained using serum separator tubes (SST) at all visits, and a follow-up symptom questionnaire was administered. At selected visits, blood was collected in BD Vacutainer CPT Tube with Sodium Heparin and PBMC were isolated following the manufacturer’s recommendations.
We used PBMC samples from six participants (five males and one female) who had a COVID-19 PCR positive test and had mild symptoms (sampled 3-11 days after the first PCR positive test), and from three control participants (three males) that had a PCR negative test at the time of sample collection and were seronegative for SARS-CoV-2 IgG. New scATAC-seq data were generated, processed, and labelled by following the same protocol as described above. A total of 15,836 cells in the infection group and 9,125 cells in the control group were identified after data processing. For each of the three selected cell types (CD8 TEM, CD14 Mono and NK), differentially accessible ATAC peaks between COVID-19 and control samples were called and used as a validation set.
Promoter-capture HiC and HiCHIP interactions
Promoter-capture Hi-C interactions11 detected in CD14 monocytes, CD4 T cells, CD8 T cells and B cells were downloaded from https://osf.io/u8tzp/files/osfstorage. GM12878 H3K27ac HiChIP data16 were downloaded from the GEO database (https://www.ncbi.nlm.nih.gov/geo/, under accession number GSM2705041). An inferred peak-gene loop is physical if the chromatin sites and gene TSS are connected by a Hi-C interaction. Each circuit chromatin site is extended to 2kb long and then checked for overlapping with one end of a Hi-C interaction. While for circuit genes, in the promoter-capture Hi-C validation, we checked if the gene symbol matches the annotated promoter; in the Hi-C validation, we checked if the circuit gene promoter (−2kb to 500b of TSS) overlaps with the other end of the Hi-C interaction. Fisher exact test was used to assess the proportion of validation interactions among circuit peak-gene interactions in comparison to the proportion of validated interactions detected by other methods.
GWAS enrichment analysis
To assess the enrichment of GWAS loci of inflammatory diseases in circuit chromatin sites in each cell type, significant GWAS loci were downloaded from GWAS catalog (https://www.ebi.ac.uk/gwas/) for inflammatory diseases including celiac disease, Crohn’s disease, inflammatory bowel disease, type 1 diabetes, multiple sclerosis, primary biliary cirrhosis, rheumatoid arthritis, systemic lupus erythematosus, ulcerative colitis and psoriasis and control diseases including Alzheimer’s, ADHD, bipolar depression, Schizophrenia, Parkinson’s, type 2 diabetes. GREGOR55 was used to assess the enrichment of GWAS loci at which either the index SNP or at least one of its LD proxies overlaps with a circuit chromatin site, using pre-calculated LD data from 1000G EUR samples. The enrichment p-value of each disease GWAS was converted to a z-score for group comparison between inflammatory diseases and control diseases. Note, as all reference data used by GREGOR is hg19 based, genome coordinates of testing regions were mapped from hg38 to hg19.
Circuit gene selection for predicting S. aureus infection
To refine circuit genes lately used for predicting infection diagnosis in microarray gene expression data, the capability of each circuit gene on distinguishing infection and control samples was assessed using sample level pseudobulk gene expression data, aggregated from the discovery scRNA-seq datasets. The total number of reads of each sample was normalized to 1e7. For each circuit gene in common to MRSA and MSSA, AUROC (area under the ROC curve) was calculated by sorting the S. aureus samples (labeled to ‘1’) and control samples (labeled to ‘0’) based on the normalized pseudobulk gene expression and comparing sample ranks against sample labels. Genes with AUROC > 0.8 were selected. To distinguish S. aureus infected samples from healthy controls, an SVM model was trained using the filtered circuit genes as features and their normalized pseudobulk expression data of 21 infection samples and 23 control samples as input.
Circuit genes selection for predicting S. aureus antibiotic sensitivity
For each gene identified in the comparative analysis of MRSA and MSSA, AUROC was calculated by sorting the MRSA samples (labeled to ‘1’) and MSSA samples (labeled to ‘0’) based on the normalized pseudobulk gene expression and comparing sample ranks against sample labels. As these two sample groups are closer conditions, we selected genes with AUROC > 0.7. To distinguish MRSA and MSSA strain infections (predicting antibiotic sensitivity based on host responses), an SVM model was trained using the filtered circuit genes as features and their normalized pseudobulk expression data of 10 MRSA samples and 11 MSSA samples as input.
Data Availability
Data from scRNA-seq and scATAC-seq have been deposited with the Gene Expression Omnibus under accession no. GSE220190. All the other data used in this study are publicly available and the URLs are provided in the corresponding sections in Methods.
https://github.com/xichensf/magical
https://www.ncbi.nlm.nih.gov/geo/query/acc.cgi?acc=GSE220190
Data availability
Data from scRNA-seq and scATAC-seq have been deposited with the Gene Expression Omnibus under accession no. GSE220190. All the other data used in this study are publicly available and the URLs are provided in the corresponding sections in Methods.
Code availability
A Github repository for source code of MAGICAL and processed single cell datasets is available at https://github.com/xichensf/magical.
Author Contributions
S.C.S, O.G.T, and E.Z conceived the study and supervised the research. X.C. designed and implemented the computational framework, conducted benchmarks and case studies with Y.W., wrote the code, and set up the web access with the help of A.T. A.C. was involved in the S. aureus study. W.S.C. managed and processed single-cell sequencing data with help from A.R., G.N., and A.V. S.K. and D.C. conducted the public microarray data search. F.R.Z., V.N., M.C.G., and R.S. generated the PBMC single-cell multiomics data for the S. aureus infected and control subjects. The S. aureus patient blood samples were provided by C.W.W, V.G.F., F.R, and M.D. The control samples were provided by R.R.S. and L.C.N. I.R. and C.M.M. provided immunological interpretations of the results. I.R., A.G.L., and A.S.S. provided the validation PBMC scATAC-seq data of COVID-19 patients and uninfected controls. S.C.S, O.G.T, X.C., E.Z., A.C., and C.T. wrote the first draft of the manuscript. All authors proofread the submitted version.
Disclosures
A.G.L. is a military service member. This work was prepared as part of his official duties. Title 17, US Code §105 provides that copyright protection under this title is not available for any work of the US Government. Title 17, US code §101 defines a US Government work as a work prepared by a military service member or employee of the US Government as part of that person’s official duties. The views expressed in the article are those of the authors and do not necessarily express the official policy and position of the US Navy, the Department of Defense, the US Government, or the institutions affiliated with the authors.
V.G.F. reports personal fees from Novartis, Debiopharm, Genentech, Achaogen, Affinium, Medicines Co., MedImmune, Bayer, Basilea, Affinergy, Janssen, Contrafect, Regeneron, Destiny, Amphliphi Biosciences, Integrated Biotherapeutics; C3J, Armata, Valanbio; Akagera, Aridis, Roche, grants from NIH, MedImmune, Allergan, Pfizer, Advanced Liquid Logics, Theravance, Novartis, Merck; Medical Biosurfaces; Locus; Affinergy; Contrafect; Karius; Genentech, Regeneron, Deep Blue, Basilea, Janssen; Royalties from UpToDate, stock options from Valanbio and ArcBio, Honoraria from Infectious Diseases of America for his service as Associate Editor of Clinical Infectious Diseases, and a patent sepsis diagnostics pending.
Acknowledgments
We thank the Single-cell and Spatial Technologies team at the Center for Advanced Genomics Technology, Department of Genetics and Genomic Sciences, the Icahn School of Medicine at Mount Sinai for providing the experimental, computational, data resources, and staff expertise. The Navy COVID-19 study protocol was approved by the Naval Medical Research Center institutional review board (protocol number NMRC.2020.0006) in compliance with all applicable Federal regulations governing the protection of human subjects. The staphylococcus sepsis protocol was reviewed and approved by the Duke Medical School institutional review board (protocol number Pro00102421). This study was funded by the Defense Advanced Research Projects Agency contract number N6600119C4022 (S.C.S.), Defense Health Agency grant 9700130 through the Naval Medical Research Center (A.G.L.), National Institutes of Health grant R01GM071966 (O.G.T.), and Simons Foundation grant 395506 (O.G.T.).
Footnotes
Lead contact: stuart.sealfon{at}mssm.edu (S.C.S.)
Reference


