
Abstract
Background Segregation of unvaccinated people from public spaces has been a novel and controversial COVID-era public health practice in many countries. Models have been used to explore potential epidemiological impacts of vaccination-status-based segregation, however existing models do not realistically represent the segregation because they neglect its effect on decreasing or increasing the contact frequencies of the segregated individuals. We systematically investigate how including the effect of segregation on contact frequencies changes predicted epidemiological outcomes.
Methods We describe a susceptible-infectious-recovered (SIR) two-population model for vaccinated and unvaccinated groups of individuals that transmit an infectious disease by pairwise person-to-person contact. The degree of segregation between the two groups, ranging from no segregation to complete segregation, is implemented using the like-to-like mixing approach developed by Garnett and Anderson (1996) for sexually transmitted diseases and recently applied to SARS-CoV-2 transmission and vaccination (Fisman et al., 2022). The model allows the contact frequencies for individuals in the two groups to be different and to depend, with variable strength, on the degree of segregation.
Results Model predictions for a broad range of model assumptions and respiratory-disease epidemiological parameters are calculated to examine the effects of segregation. Segregation can either increase or decrease the attack rate among the vaccinated, depending on the type of segregation (whether isolating or compounding), and on the contagiousness of the disease. For diseases with relatively low contagiousness, segregation can cause an attack rate in the vaccinated, which does not occur without segregation.
Interpretation There is no blanket epidemiological advantage to implementing segregation, either for the vaccinated or the unvaccinated. Negative epidemiological consequences can occur for both groups.
Introduction
Models can be used to investigate infectious disease dynamics under different hypotheses about the characteristics of a disease and the impacts of health policy. In such applications, it is crucial to base the model on the simplest-possible sufficiently realistic conceptual foundation and only add extensions incrementally (Garnett & Anderson, 2022; Siegenfeld et al., 2020). Following this approach, researchers have extended the foundational SIR-type model to explore diseases with birth and death dynamics, maternal- or vaccine-derived immunity, latency of infection, and so on (Hethcote, 2000; Keeling & Rohani, 2008; Martcheva, 2015).
Recently, a simple susceptible-infectious-recovered (SIR) model of epidemic dynamics was implemented with two interacting societal groups (vaccinated and unvaccinated) to examine whether the unvaccinated put the vaccinated unduly or disproportionately at risk, using epidemiological parameters presumed to be representative of SARS-CoV-2 (Fisman et al., 2022).
Since the particular implementation of this model garnered much interest, and since its conclusions have been cited by decision and law makers, it is of some importance to examine whether the model’s architecture correctly maps onto the essential features of the real-world circumstances that it intends to represent, whether a more realistic match can be made (while preserving conceptual simplicity), and whether the apparent flaw significantly affects the predicted outcomes.
We find that Fisman et al.’s model is a particular case in which the contact frequencies of the majority and socially-excluded groups are equal and held constant, irrespective of the degree of exclusion (or segregation or “like-to-like mixing”). This is not realistic, for example, in circumstances in which an excluded group is barred from public venues where people meet. In general, the contact frequency of the excluded group decreases with increasing segregation if isolation is in effect, and increases with increasing segregation if the excluded individuals are in-effect put into compounds or camps. Implementing these necessary model features gives rise to a rich and more complex epidemiological behaviour, whatever epidemiological parameters are used.
The Model
We adopt the standard SIR framework with two sub-populations, as has been done with sexually-transmitted diseases and was recently done with vaccination status.
Following the usual SIR model structure, a person can be in one of three states: susceptible to infection (S), infectious (I), or recovered and immune (R). If a susceptible person comes into contact with an infectious person, the susceptible person can become infectious, and infectious people eventually recover.
Our model population is divided into two groups: vaccinated and unvaccinated. Vaccination is “all or nothing”, such that a proportion VE of the vaccinated population is immune (are in the R state from the outset of the simulation), where the parameter VE represents vaccine efficacy. The model also includes a natural immunity parameter, NI, equal to the proportion of unvaccinated that are immune from the outset.
The model parameter η controls the degree of segregation between vaccinated and unvaccinated people. When η = 0, there is no segregation, and the two groups mix randomly. When η = 1, there is complete segregation, such that vaccinated only come into contact with other vaccinated, and unvaccinated only come into contact with other unvaccinated.
The parameter η follows from Garnett and Anderson (1996), who modeled sexually-transmitted disease spread in a population divided into groups with different frequencies of sexual contacts. Since it is reasonable to assume that the level of desire for sexual contact is an intrinsic characteristic of individuals, it is reasonable to assume that segregation does not change the contact frequencies in either group in Garnett and Anderson’s model. However, contact frequency is not generally and solely an intrinsic individual characteristic, and segregation based on vaccination status may increase or decrease contact frequencies, depending on how the segregation is implemented.
In our model, the contact frequencies of either vaccinated or unvaccinated individuals (or both) can increase, decrease, or remain constant as the two groups are segregated. This is controlled by the parameters mv and mu, which determine the degree of increase or decrease of the contact frequency in either group, as η is varied.
For example, when mu < 0, as segregation is increased, the contact frequency of unvaccinated people, cu, decreases. This corresponds to segregation policy that excludes unvaccinated people from public spaces, e.g., using vaccination passports. Conversely, when mu > 0, then as segregation is increased, cu increases. This corresponds to segregation policy that compounds unvaccinated people, for example in prisons or camps.
In principle, the vaccinated and unvaccinated contact frequencies may be different even when the two groups are completely unsegregated. The unsegregated (η = 0) contact frequencies are set by the parameters  and
and  . Similarly, the probability that contact between a susceptible and infectious person results in transmission is βv (βu) for a susceptible vaccinated (unvaccinated) person and the rates of recovery from infection for the vaccinated and unvaccinated individuals are γv and γu, respectively.
There are thus two “β parameters”, two “c parameters” and two “γ parameters” in our model. Since each β parameter always occurs as part of a product with its respective c parameter, the β parameters can freely be set equal to 1: this imposes that the “contacts” considered in the model are, by definition, only those contacts that are of sufficiently close proximity and long duration that an infection is guaranteed to occur when a susceptible and an infectious person meet. We set βv = βu = 1 in this paper, without any loss of generality. For a more contagious virus, more of an individual’s contacts are long and close enough that transmission would be guaranteed, corresponding to higher  and
and  .
.
The model of Fisman et al. is the special case of our model with mu = mv = 0,  and γv = γu. When mu = mv = 0, the contact frequencies of both vaccinated and unvaccinated remain constant regardless of the level of segregation. Segregation then implies two parallel societies, where each population has its own public spaces (such as restaurants, airplanes, etc.) and within these spaces maintain the same contact frequencies they would have with no segregation. Fisman et al.’s model therefore does not realistically represent how segregation has been applied during the COVID era in Canada and many countries (Looi, 2021; Lawson et al., 2022), which excluded unvaccinated people from public spaces while allowing vaccinated people access.
We do not use the “basic reproduction number”, R0, since it is derived from the fundamental parameters of the model. In a model with multiple sub-populations, the dynamics are not characterized by a single R0, since the infection probabilities (β parameters), contact frequencies (c parameters) and recovery rates (γ parameters) are different for each sub-population, in general.
The parameters of our model are listed in Table 1; calculated quantities in Table 2. Technical details of the model are in Appendix 1.
Model parameters
Quantities calculated from model results (mathematical definitions in Appendix 1, Section A1.3)
Results
The attack rate among the vaccinated population is defined as the proportion of initially-susceptible vaccinated people who become infected during the epidemic: Av = (Sv(t0) − (Sv(tf)/(Sv(t0), where Sv(t0) is the number of susceptible vaccinated people at the beginning of the epidemic and Sv(tf) is the number of susceptible vaccinated people remaining once there are no longer any infectious people in the entire (vaccinated and unvaccinated) population. Au is defined equivalently, for the unvaccinated.
We also define Bv as the share of infections among vaccinated people that were due to contacts with infectious unvaccinated people. Bv is equal to the numerator of the index Ψ introduced by Fisman et al. (2022).
We focus on segregation types that are targeted at the unvaccinated group. We assume, for simplicity, that segregation has no impact on the contact frequency of vaccinated people (mv = 0). We also assume that the contact frequencies in both groups are the same when there is no segregation  We use the values of Fisman et al. for the remaining parameters: Pv = 0.8, VE=0.8, NI=0.2, γv = γu = 73 yr-1, and N = 107. Appendix 2 contains supplementary figures with results for different parameter combinations, including mv ≠ 0 and
  . In all results in this paper, simulations were initiated with a seed number of 100 infectious individuals distributed proportionately among the two sub-populations.
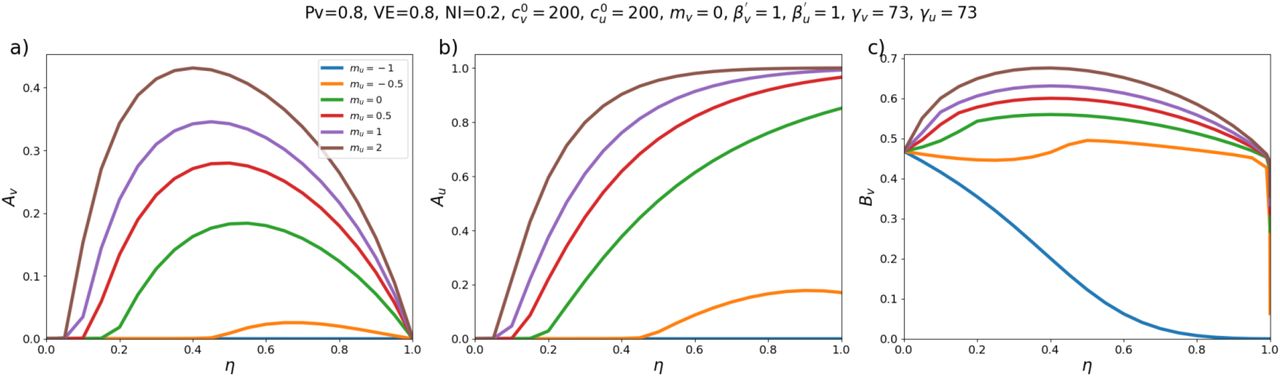
Fig. 1 shows results for a moderate value of  . For reference, in a single-population model, c = 300, β = 1 and γ = 73 corresponds to R0 = 4.1.

Three different quantities as functions of the degree of segregation, η, for different values of mu: (a) Attack rate among the vaccinated sub-population, (b) Attack rate among the unvaccinated sub-population, (c) Share of vaccinated infections that were due to contacts with unvaccinated people. Values of fixed model parameters are indicated at the top of the figure.
As can be seen in Fig. 1a, when mu < 0 (exclusion and isolation of unvaccinated people) the vaccinated attack rate, Av decreases with increasing segregation. However, when mu > 0 (compounding of unvaccinated people), there is a maximum in Av for moderate values of η. Therefore, with compounding segregation, very large values of η are required for Av to be lower than its value with no segregation (η = 0). Fig. 1c shows that Bv, the share of vaccinated infections that are due to unvaccinated people, has a shape similar to Av(η, mu).
Fig. 1 therefore demonstrates that whether segregation increases or decreases the vaccinated-population attack rate depends on how segregation is implemented.
Figs. 2 and 3 show results for larger  . Compared to Fig. 1a, Av in Figs. 2a and 3a does not increase much with η when mu > 0, and Av no longer has a maximum when mu = 0. Comparing with Fig. 1a, it can also be seen that Av increases with increasing
  when there is no segregation (η = 0).

Same as Fig. 1, except that  .
.

Same as Fig. 1, except that  .
.
For smaller  (Figs. 4 and 5), Av(η = 0) is decreased, and larger η can dramatically increase Av. Even with an isolating segregation policy (mu = −0.5 in Fig. 4a), Av is increased for moderate values of η.

Same as Fig. 1, except that  .
.

Same as Fig. 1, except that  .
.
When  are small enough (
 in fig. 5), there is no epidemic among the vaccinated in the absence of segregation (Av(η = 0) = 0). However, a non-zero vaccinated-population attack rate (Av > 0) occurs if η is sufficiently large, and emerges regardless of whether one isolates or compounds the unvaccinated. Therefore, for small values of
  any type of segregation can only harm the vaccinated.
Appendix 2, contains supplementary figures showing that when VE is decreased (e.g. VE=0.4), Av is not strongly influenced by η, regardless of mu; therefore, any beneficial effect of segregation on Av is reduced as VE decreases.
Appendix 2 also explores  . For example, when
  , the unvaccinated contact frequency is reduced even when there is no segregation; increasing η can then increase Av significantly for parameter values for which a similar increase of Av does not occur when
  (e.g.
(e.g.  , mu = 1, mv = 0, VE = 0.8, in Section A2.6).
Interpretation
Our model shows that vaccination-status-based segregation can have significantly different and counter-intuitive impacts on the outcome of an epidemic, depending on how the segregation is applied, and depending on cultural and population-density factors, for example, that co-determine  and
and  .
.
Regarding segregation, the key feature is that the contact frequencies of people in each of the segregated sub-populations depend on the degree and type of segregation applied. Segregation that compounds the unvaccinated (mu > 0 and mv = 0) generally causes an increase in the vaccinated-population attack rate, Av, for small and intermediate degrees of segregation, η. Segregation that isolates and excludes the unvaccinated (mu < 0 and mv = 0) decreases Av for “more contagious viruses” (i.e. large  ); however, for “less contagious viruses” (smaller
  , both isolating and compounding types of segregation can increase Av beyond its value in an unsegregated society. For “viruses that are not very contagious” (small
  ), applying segregation can cause a sizeable epidemic among the vaccinated even though virtually no vaccinated people would be infected in an unsegregated society.
We find that Bv, the share of vaccinated infections that are due to contact with unvaccinated people, follows a similar behaviour to Av as a function of the degree of segregation, when segregation has no impact on the vaccinated contact frequency (mv = 0). For this type of segregation, Av and Bv either increase or decrease simultaneously with increasing η, depending on the value of mu, and Bv is minimized for complete segregation. When mv = 0, there is therefore no type or degree of segregation that reduces the vaccinated attack rate while simultaneously “enhancing the degree of risk” to vaccinated people from unvaccinated people, contrary to assertions of Fisman et al. (2022). Appendix 3 shows that Fisman et al.’s use of the unsuitable index Ψ led to their incorrect conclusion on this point.
In contrast, when mv ≠ 0, such that segregation affects the contact frequencies of vaccinated people, segregation can produce an increased Av along with a decreased Bv and vice-versa, as shown in Appendix 2 (Sections A2.3 and A2.4). The broad range of results emerging from our simple model highlights the importance of the impact of segregation on contact frequencies, which has not been considered in other epidemic models including agent-based models of vaccination-status-based segregation (Achitouv, 2022).
Limitations
SIR models and their variations, including agent-based versions (Hinch et al., 2021; Achitouv, 2022) are based on the paradigm of transmission due to pairwise contact between a recently infected and a susceptible individual. However, this paradigm is unable to account for important features of viral respiratory disease incidence, in particular its seasonal pattern that is strongly dependent on latitude and its rapid emergence and disappearance occurring at essentially the same time at widely dispersed locations (Hope-Simpson, 1992). Seasonality of viral respiratory disease may be driven by the seasonality of absolute humidity and its effect on transmission via aerosols (Shaman & Kohn, 2009; Shaman et al., 2010). However air-borne transmission via long-lived suspended aerosol particles is not directly compatible with pairwise transmission, since it occurs in built environments where many people may transit or be present (Bulfone et al., 2021). These fundamental limitations of present viral respiratory disease models are caveats to any use of such models in health policy.
Conclusion
Using SIR modelling, we have shown that vaccination-status-based segregation can lead to significantly different and counter-intuitive epidemic outcomes depending on how segregation is applied, and depending on complex cultural and physical factors that co-determine infectious contact frequencies (i.e., the products βc), including negative health consequences for either segregated group, even disregarding the expected deleterious health impacts of the segregation policies themselves (Cohen, 2004; Cohen et al., 1991; Cohen et al., 1997). Given the lack of reliable empirical evaluations of needed infectious contact frequency values, given the now proven outcome sensitivities to the infectious contact frequencies, and given the intrinsic limitations of SIR models in this application, we cannot recommend that SIR modelling be used to motivate or justify segregation policies regarding viral respiratory diseases, in the present state of knowledge.
Data Availability
This is a modeling paper, therefore all data is from simulations. Information for reproducing the simulations is contained in the manuscript and appendices.
This is Appendix 1 of the pre-print “Compartmental mixing models for vaccination-status-based segregation regarding viral respiratory diseases” by J. Hickey &D.G. Rancourt, uploaded to https://www.medrxiv.org/ on 2022-08-21.
Appendix 1: Elaboration of the model
Section A1.1: Model differential equations and “mixing” rule
The model is a susceptible-infectious-recovered (SIR) model with two populations: vaccinated (subscript v) and unvaccinated (subscript u) people, consisting of the following six differential equations:
Su, Iu, and Ru represent the number of susceptible, infectious, and recovered unvaccinated people, at time t. Nu represents the total number of unvaccinated people. cu represents the contact frequency (number of contacts per unit time) of unvaccinated people. βu is the probability that a susceptible unvaccinated person becomes infected upon contact with an infectious person (regardless of whether the infectious person is vaccinated or unvaccinated). γu is the rate at which infected unvaccinated people recover from infection. The quantities Sv, Iv, Rv, Nv, cv, βv, and γv are defined equivalently, for vaccinated people.
fij is the probability that a person of type i (either u or v) has a contact with a person of type j (either u or v), and is defined as follows:
where 0 ≤ η ≤ 1 and δij is the Kronecker delta, such that δuu = δvv = 1 and δuv = δvu = 0. η is therefore a parameter that controls the degree of segregation between the u and v sub-populations. For example, when η = 1, then fuu = fvv = 1 and fuv = fvu = 0, such that u people only ever have contacts with other u people and likewise for v people. At the other extreme, when η = 0, then the probability that an i person has a contact with a j person is entirely determined by the relative proportions of i and j people, weighted by their respective contact frequencies.
Section A1.2: Variation of contact frequency with degree of segregation
To allow contact frequency to vary with degree of segregation, we define:
where  and
and  represent the contact frequencies for unvaccinated and vaccinated people when there is no segregation (η = 0), and mu ≥ −1 and mv ≥ −1 are two parameters that control how non-zero segregation impacts the contact frequencies of unvaccinated and vaccinated people.
Fig. A1.1 shows cu as a function of η, for different values of the parameter mu and for  . As can be seen, when mu = 0,
  , such that the contact frequency is constant regardless of the degree of segregation.

Variation of the unvaccinated contact frequency, cu, with degree of segregation, η, for various values of the parameter mu.  in the figure.
When mu < 0, the contact frequency of unvaccinated people decreases with increasing η. This represents a segregation policy that excludes unvaccinated people from public spaces while also isolating them from themselves to some degree. For example, a pair of intermediate values of mu < 0 and 0 < η < 1 could represent a segregation policy (such as with “vaccination passports”) that excludes unvaccinated people from recreational venues like restaurants and cinemas but not more essential services such as grocery stores and hospitals. On the other hand, in the extreme case of mu = −1 and η = 1, cu = 0 such that unvaccinated people are completely segregated and isolated, having no contacts with anyone.
When mu > 0, the contact frequency of unvaccinated people increases with increasing η. This represents a segregation policy that compounds unvaccinated people by placing them together in close quarters, for example in quarantine camps or villages.
Via the two parameters mu and η, the model therefore spans the full range of contact frequencies, from cu = 0 in the isolating extreme of mu = −1 and η = 1 to arbitrarily high contact frequency in the compounding extreme with η = 1 and a mu > 0.
The impact of segregation on the vaccinated sub-population is independently controlled via the parameters  and mv.
Section A1.3: Quantities calculated from simulation results
The attack rate among the vaccinated population, Av, is defined as the proportion of initially-susceptible vaccinated people who become infected during the epidemic:

where Sv(t0) is the number of susceptible vaccinated people at the beginning of the epidemic and Sv(tf) is the number of susceptible vaccinated people remaining once there are no longer any infectious people in the entire (vaccinated and unvaccinated) population. Au is defined equivalently, for the unvaccinated.
The quantity Bv is equal to the share of infections among vaccinated people that were due to contacts with infectious unvaccinated people, i.e.:
Similarly, Bu represents the share of infections among unvaccinated people that were due to contacts with infectious vaccinated people, and is defined in the same way as Bv, (interchanging the v and u subscripts in the equation for Bv, above).
Fisman et al.’s Ψ index is equal to Bv divided by the fraction of all contacts involving vaccinated people that occurred with unvaccinated people, thus:
This is Appendix 2 of the pre-print “Compartmental mixing models for vaccination-status-based segregation regarding viral respiratory diseases” by J. Hickey & D.G. Rancourt, uploaded to https://www.medrxiv.org/ on 2022-08-21.
Appendix 2: Supplementary figures
Section A2.1
 , mv = 0, βu = βv = 1, γu = γv = 73, VE = 0.8, NI = 0.2, various choices of mu (blue: mu = -1, orange: mu = -0.5, green: mu = 0, red: mu = 0.5, purple: mu = 1, brown: mu = 2), showing (a) Av, (b) Au, (c) Bv, and (d) Bu as functions of η. Each 4-panel figure (a-d) has a different value of
  .
.


Section A2.5
 , mu = mv = 0, βu = βv = 1, γu = γv = 73, VE = 0.8, NI = 0.2, various choices of
  (blue:
  , orange:
  , green:
  , red:
  , purple:
  ), showing Av, Au, Bv,, and Bu as functions of η. Each four-panel figure (a-d) is for a different value of
  .
.


Section A2.7
Same parameters as in Section A2.5, except that mu = −1.

This is Appendix 3 of the pre-print “Compartmental mixing models for vaccination-status-based segregation regarding viral respiratory diseases” by J. Hickey & D.G. Rancourt, uploaded to https://www.medrxiv.org/ on 2022-08-21.
Appendix 3: Analysis of incorrect interpretations in Fisman et al. (2022)
As explained in the main text, the model of Fisman et al. (2022) is the special case of our model with mu = mv = 0,  and γv = γu.
In their paper, Fisman et al. (2022) make several incorrect interpretations and assertions of the results of their model, which we analyze and discuss in this appendix. Several of these criticisms were first made in Rancourt and Hickey (2022a) and Rancourt and Hickey (2022b).
This appendix is structured as follows:
Section A3.1: Critical analysis of Fisman et al.’s Ψ index
Fisman et al. (2022) define an index Ψ as the ratio of two quantities that can be calculated from the results of their model.
The numerator of Fisman et al.’s Ψ is equal to our Bv, that is, the share of infections among vaccinated people that were due to contacts with infectious unvaccinated people. The denominator of Ψ is equal to the fraction of all contacts involving vaccinated people that occurred with unvaccinated people.
The index Ψ is not suitable or useful for evaluating the results of the model and leads to incorrect interpretations of the model results.
There are two main illustrations of the incorrectness of the Ψ index, as follows, using values of our model parameters that correspond to Fisman et al.’s model with their R0 = 6. I.e., the model parameters are:  , mu = mv = 0, βu = βv = 1, and γu = γv = 73. We also use NI=0.2, VE = 0.8, and Pv = 0.8, to compare with Fisman et al. (2022), unless otherwise specified in the figures below.
Criticism 1: Ψ approaches large values as the mixing coefficient η approaches 1

(a) Fisman et al.’s Ψ as a function of η, for different values of VE. (b) The numerator of Fisman et al.’s Ψ (our Bv) as a function of η, for different values of VE. (c) The attack rate among the vaccinated population, Av, as a function of η, for different values of VE. Other model parameters correspond to Fisman et al.’s model with their R0 = 6.
As can be seen in Fig. A3.1a, Ψ increases to a maximum as η approaches 1. This would mean that unvaccinated people are proportionately more of a threat to vaccinated people as the two groups are more and more isolated from each other, up to complete isolation. This is an absurd result.
In contrast, the numerator of Ψ (Bv, see Fig. A3.1b) approaches 0 as the mixing coefficient η approaches 1, indicating that the more the two groups are segregated the lower the risk that a vaccinated person becomes infected by an unvaccinated person.
That this behaviour of the Ψ index can cause incorrect interpretations of the model results is demonstrated by the following quote from Fisman et al. (2022):
“[M]ore like-with-like mixing decreased finale epidemic size among vaccinated people but resulted in enhancement of the degree to which risk among vaccinated people could be attributed to unvaccinated people. The fact that this excess contribution to risk cannot be mitigated by high like-with-like mixing undermines the assertion that vaccine choice is best left to the individual and supports strong public actions aimed at enhancing vaccine uptake and limiting access to public spaces for unvaccinated people, because risk cannot be considered ‘self-regarding.’” (Fisman et al., 2022, pg. E578) [Bold emphasis added]
Fisman et al. thus assert, based on their index Ψ, that more segregation equates to higher risk to vaccinated people from unvaccinated people, even when the attack rate among vaccinated people decreases with more segregation. However, this is not what happens in their model, as can be seen from Fig. A3.1b and A3.1c.
Fisman et al. base several additional incorrect interpretations of their model results on the Ψ index, as follows:
“As like-with-like mixing increased, contribution to infection risk among vaccinated people was increasingly derived from (less and less common) interactions with unvaccinated people, increasing the value of Ψ.” (Fisman et al., 2022, pg. E575)
“As like-with-like mixing increased (i.e., with reduced contact between vaccinated and unvaccinated subpopulations) … the contribution of risk to vaccinated people caused by infection acquired from contact with unvaccinated people (as measured by Ψ) increased. The larger the value of Ψ, the more unvaccinated people contributed to infections in the vaccinated subpopulation.”
“We found that increased like-with-like mixing reduced final outbreak size among vaccinated people most markedly at lower reproduction numbers but increased the value of Ψ.”
Criticism 2: Ψ increases toward its maximum as the population fraction of vaccinated people, Pv, increases

(a) Fisman et al.’s Ψ as a function of Pv, for different values of η. (b) Bv as a function of Pv, for different values of η. Other model parameters correspond to Fisman et al.’s model with their R0 = 6.
As can be seen in Fig. A3.2a, Ψ increases toward its maximum as the population fraction of vaccinated people, Pv, increases, for fixed values of the other model parameters.
This increase in Ψ with increasing Pv would mean that, the fewer unvaccinated people there are, the more they contribute to the infection risk of vaccinated people. Or, conversely, it means that the more unvaccinated people there are, the less they contribute to infection risk of vaccinated people.
In contrast, Bv decreases to its minimum as Pv increases, as in Fig. A3.2b.
The increase in Ψ and decrease in Bv with increasing Pv can also be seen in Fig. A3.3, which we include for comparison with Fisman et al.’s Fig. 3 (lower panel).

(a) Fisman et al.’s Ψ as a function of η, for different values of Pv. (b) Bv as a function of η, for different values of Pv. Other model parameters correspond to Fisman et al.’s model with their R0 = 6.
That this aspect of the Ψ index can lead to incorrect interpretations of the model results is demonstrated by the following quote from Fisman et al. (2022):
“Increasing population vaccination coverage … further increased the relative contribution to risk in vaccinated people by those who were unvaccinated at any level of like-with-like mixing.” (Fisman et al., 2022, pg. E575)
In contrast, increasing Pv toward its maximum decreases the share of vaccinated infections that are due to unvaccinated people, Bv (see Fig. A3.2b), as would be expected.
Section A3.2: Less segregation (“increased mixing”) does not necessarily produce a higher vaccinated-population attack rate (Av)
In addition to the above two criticisms of the Ψ index, we also note that in Fisman et al.’s model, Av has a maximum for small to moderate values of the segregation parameter η when R0 is about 4 or less. This can be seen in Figs. 1a, 4a, and 5a of the main text (green curves for mu = 0), and in Fisman et al.’s Fig. 2A (yellow curve for R0 = 4).
This invalidates Fisman et al.’s statement that “Increased mixing between vaccinated and unvaccinated groups increased final epidemic size among vaccinated people; …” (Fisman et al., 2022, pg. 578), which they advance as an unqualified truth. To the contrary, the presence of a maximum in Av(η) means that decreasing segregation (increased mixing) can decrease the size of the epidemic among vaccinated people.
A similar maximum in Av(η) can also be seen in our model for more contagious disease (i.e. parameter combinations equivalent to R0 > 4). For example, this occurs when there is compounding-type segregation of unvaccinated people (mu = 2) in Fig. 2a of the main text, in which the parameters correspond to R0 = 6.
Section A3.3: Two-population behaviour is trivial in the absence of segregation, in Fisman et al.’s model
We also note that, when there is no segregation (η = 0), and when  , βu = βv, and γv = γu (as in Fisman et al.’s model) unvaccinated people infect vaccinated people at a rate bound by the relative proportions of initially-susceptible individuals in the vaccinated and unvaccinated sub-populations, which are entirely determined by the modeller’s choice of the parameters Pv, VE, and NI.
This trivial result is shown in Fig. A3.4, and contradicts Fisman et al.’s statement that “the choices made by people who forgo vaccination contribute disproportionately to risk among those who do get vaccinated.” Rather, the contribution of unvaccinated people to infecting vaccinated people is simply determined by the relative proportions of initially-susceptible people in the two groups.

Bv as a function of Pv, for different values of VE and (a) NI = 0.2 and (b) NI = 0.6. Circular points show simulation results. When  , η = 0, βu = βv, and γv = γu, Bv is equal to the proportion of initially-susceptible unvaccinated people divided by the proportion of all initially-susceptible people in the population, such that
  as indicated by the black lines in the figure.
References
References for Appendix 3


