
Abstract
Wastewater-based epidemiology (WBE) is an emerging approach for community-wide COVID- 19 surveillance. WBE was characterized mostly at large sewersheds such as wastewater treatment plants serving a large population. Although informed public health measures can be implemented in a small population, WBE for neighborhood-scale sewersheds is less studied and not fully understood. This study applied WBE to seven neighborhood-scale sewersheds (average population 1,471) from January to November 2021. Community testing data showed an average of 0.004% incidence rate in these sewersheds (97% of monitoring periods reported two or fewer daily infections). In 92% of sewage samples, SARS-CoV-2 N gene fragments were below the limit of quantification. COVID-19 cases poorly correlated with SARS-CoV-2 N gene concentrations except for one location where frequent COVID-19 testing was required. Thus, we developed a COVID-19 warning system for high COVID-19 risk when the SARS-CoV-2 N gene concentration normalized to pepper mild mottle virus (PMMOV) in wastewater is higher than 10-2. This COVID- 19 warning system now identified neighborhood-scale outbreaks (COVID-19 incidence rate higher than 0.5%) with 73% sensitivity and 71% specificity. Importantly, it can discern neighborhood- level outbreaks that would not otherwise be identified by county-scale WBE. We also demonstrated that SARS-CoV-2 variant-specific RT-qPCR assays could be combined with the COVID-19 warning system to identify the introduction of SARS-CoV-2 variants into sewersheds with a low COVID-19 incidence. This new COVID-19 warning system will contribute to effective community-wide disease surveillance when COVID-19 incidence may be maintained at a low level.

Introduction
Wastewater-based epidemiology (WBE) has been used as a cost effective epidemiological tool for community-wide COVID-19 surveillance worldwide (Hart and Halden, 2020)(Chen et al., 2020; Sherchan et al., 2021; Tiwari et al., 2021). For example, WBE can detect SARS-CoV-2 at an 0.01% incidence (1infection in 10,000 people), when the influent of wastewater treatment plants serving a community of more than 100,000 residents was analyzed (Hata et al., 2021). The viral genome concentrations in sewersheds may be a better proxy for actual disease incidence than the reported COVID-19 infection cases because reported cases are significantly affected by temporal clinical testing capacity (Xiao et al., 2022). Furthermore, WBE affords the use of longitudinal wastewater surveillance to predict disease outbreaks in advance of clinical epidemiology because SARS-CoV- 2 genes are shed before symptom onset (Wu et al., 2022b).
Large-scale sewersheds (such as wastewater treatment plants serving hundreds of thousands to millions of people) routinely have been surveilled for COVID-19 since early 2020 (Hata et al., 2021; Xiao et al., 2022). However, the large-sized sewersheds may not provide detailed information for region-specific public health measures. For example, social determinants of COVID-19 risk, such as demographics and socioeconomic status, which are regional characteristics (Abrams and Szefler, 2020; Jamal et al., 2022; Upshaw et al., 2021), may not be reflected in the influent wastewater from large sewersheds. The heterogeneity of these social determinants across the sewersheds is a possible explanation for discrepancies between state-wide and county-specific COVID-19 data (Messner and Payson, 2020). WBE also has been applied to small-scale sewersheds, such as buildings on university campuses (Bivins and Bibby, 2021; Gibas et al., 2021; Karthikeyan et al., 2021). At this smaller scale, viruses are detected in wastewater when there are COVID-19 infection cases in the buildings. However, building-scale monitoring is not practical for residential areas that have high numbers of single family homes.
Neighborhood scale monitoring for COVID-19 has been conducted (Barrios et al., 2021; Spurbeck et al., 2021). While this neighboordhood scale monitoring could allow a more targeted public health intervention for a specific community, SARS-CoV-2 N gene concentrations presented lower correlation coefficients with COVID-19 infection cases as the catchment populations decreased (Bitter et al., 2022; Rusiñol et al., 2021; Sangsanont et al., 2022). Additionally, the probability of SARS-CoV-2 detection in wastewater samples at a given COVID- 19 incidence decreases with a decrease in the population size (Fitzgerald et al., 2021; Wu et al., 2021). Thus, the neighborhood scale monitoring strategies are ripe for improvement.
This study aims to develop a methodology for the neighborhood-scale WBE for community-wide COVID-19 surveillance. We collected sewage samples from seven neighborhood-scale sewersheds (average population 1,471 people) across Champaign County, IL, USA for eleven months. First, we analyzed the SARS-CoV-2 N gene, including the genomes for the Alpha and Delta variants. Then, we plotted these data onto the human COVID-19 testing data obtained from the neighborhood-scale sewersheds, allowing us to develop a COVID-19 warning system. This COVID-19 warning system provides valuable information for county-wide disease surveillance. For example, our data uncovered local outbreaks that county-scale WBE would not detect, and also the introduction of SARS-CoV-2 variants of concerns to the sewersheds even at low COVID-19 incidence. Our findings suggest that the COVID-19 warning system will contribute to COVID-19 surveillance, especially when COVID-19 incidence is maintained at a low level, such as at a COVID-19 endemic phase.
Materials and Methods
Collection of raw sewage composite samples
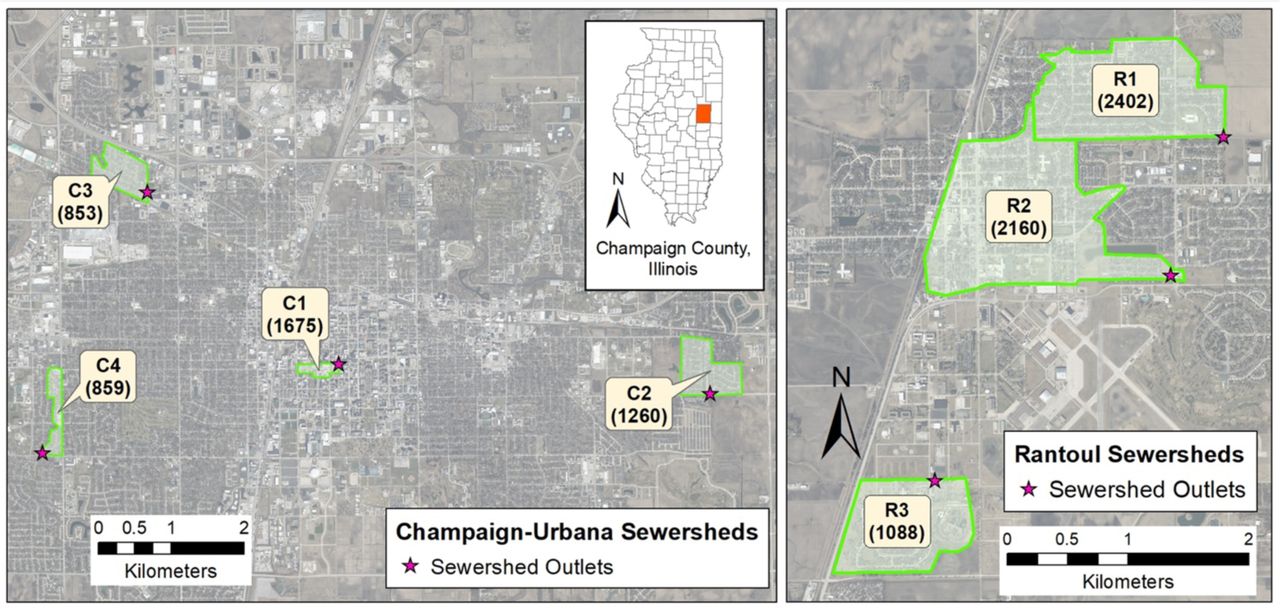
We selected seven sampling points of manholes across Champaign County, IL, USA. These seven sampling points receive sewage discharged from sewersheds whose areas vary from 0.09 to 1.70 km2. Population in each sewershed ranged from 853 to 2402 in 2020 (Fig. 1). We chose an additional sampling point: collecting wastewater generated from a food processing plant. The amount of human fecal matter released in this wastewater is much smaller than the processing water from slaughtering and meatpacking. For this reason, we used this wastewater for process control, evaluating cross-contamination among the sewage samples during the sample processing.

Map of sewersheds in (A) Champaign and Urbana cities and (B) Rantoul city in Illinois. Values in parenthesis are population estimates using block-level US Census 2020 data.
We installed autosamplers (Teledyne ISCO, USA) programmed to collect a 1 to 2 L composite sample comprised of samples pumped at 4-hour intervals for four days. First, the composite samples were transferred to sterile sampling bags (14-955-001, Fisher Scientific, USA) and 20 mL of 2.5 M MgCl2 was added to the samples (i.e., final MgCl2 concentrations from 25 to 50 mM) to coagulate solids including virus particles (Ahmed et al., 2020b; Oh et al., 2022a). Samples were transported on ice to a laboratory at the University of Illinois Urbana-Champaign within three hours. All contact material was sanitized with 10% bleach and 70% ethanol to minimize cross- contamination whenever handling different samples. We monitored the sewersheds from January 2021 to November 2021, during which we collected 254 sewage samples in total. The minimum recommended meta-information on sewage samples is summarized in Table S1.
Sample processing and viral nucleic acid extraction
Upon arrival at the laboratory, supernatants from each composite sample were discarded. The remaining 35 mL of sewage, in which solid particles were concentrated, were transferred to a 50 mL tube (12-565-271, Fisher Scientific, USA). Next, we added 350 μL of 105 gene copies (gc)/μL of bovine coronavirus (BCoV; 16445-1, Merck Animal Health, USA) to the 35 mL of concentrated sewage. After a 10 minutes incubation at room temperature, samples were centrifuged at 10,000 g for 30 minutes (Sorvall™ RC 6 Plus, Thermo Scientific, USA). Supernatants were discarded and a portion of the concentrated sludge (100 μL) was transferred to a sterile 1.5 mL tube (1415-2600, USA Scientific, USA). Total RNA and DNA, including SARS-CoV-2 RNA, were extracted from the sludge with QIAamp Viral RNA mini kit (Qiagen, German) following the manufacturer’s procedure with a minor modification. Specifically, the final volume of extracts was 100 μL. Sewage collection and processing were conducted on the same day, and the RNA samples were stored at -80 ℃ until downstream analysis.
Analysis of viral genomes
Total RNA was diluted serially 10-fold, and six reverse transcriptase quantitative polymerase chain reaction (RT-qPCR) assays (Table S2) were used to analyze sampels for the presence of SARS- CoV-2 RNA. We quantified the N gene (i.e., N1 assay with 2019-nCoV RUO kit, Integrated DNA Technologies, USA) to identify a total SARS-CoV-2 RNA concentration. We also analyzed samples for the presence of the S:A570D and S:P681R mutations present in the Alpha and Delta variants because these were dominant variants in our study area during the time of our sample collection (Oh et al., 2022b). For the data quality assurance, we quantified pepper mild mottle virus (PMMOV), Tulane virus (TV), and BCoV, which were used to normalize SARS-CoV-2 to human fecal matter, determine the impact of PCR inhibitors, and calculate SARS-CoV-2 recovery efficiency, respectively.
The details for RT-qPCR assays are summarized in Table S3, following MIQE guidelines. We analyzed five targets (i.e., N gene, Alpha, Delta, PMMOV, and TV) by Taqman-based RT- qPCR assays. We designed two duplex RT-qPCR assays and one singleplex RT-qPCR to analyze these five targets. Specifically, we used the first duplex RT-qPCR assay to detect total SARS- CoV-2 RNA (i.e., N gene) and the Alpha variant. The second one was to analyze the Delta variant and PMMoV. To validate the two duplex RT-qPCR assays, we compared Cq values of serial dilutions of synthetic RNA/DNA standard controls determined by duplex RT-qPCR and its corresponding singleplex RT-qPCR. We used singleplex RT-qPCR to measure TV RNA. The Taqman-based RT-qPCR started with mixing 5 μL of RNA sample, 5 μL of Taqman Fast Virus 1- step Master Mix (4444432, Applied Biosystems, USA), 1 μL of primers/probe mixture for each assay (i.e., final concentrations of 400 nM for primers and 200 nM for probes), and various volumes of nuclease-free water that fill up the mixture to 20 μL. For example, we added 1 μL of primer/probe for the N gene, 1 μL of primer/probe for the Alpha variant, and 8 μL of nuclease- free water to the RT-qPCR cocktail for the first duplex RT-qPCR assay while 1 μL of primer/probe for TV and 9 μL of nuclease-free water to the RT-qPCR cocktail for the singleplex RT-qPCR assay. The PCR cocktail was placed in 384-well plates (4309849, Thermofisher Scientific, USA) and analyzed by QuantStudio 7 Flex (Thermofisher, USA) with a thermal cycle of 5 minutes at 50℃, 20 seconds at 95℃ followed by 45 cycles of 15 seconds at 95℃ and 60 seconds at 60℃. The PCR standard curves were obtained for every RT-qPCR analysis with 10-fold serial dilutions of synthetic RNA or DNA controls, and average PCR efficiencies for RT-qPCR were 92% (Fig. S1). Four replicates of nuclease-free water were run for every RT-qPCR analysis to identify the contamination of reagents or cross-contamination among reactions. These non-template controls test negative at all RT-qPCR analyses. We also determined the limit of detection (LOD) and limit of quantification (LOQ) for each assay with 20 replicates of serial dilutions of synthetic controls (Table S4) following a previous study (Oh et al., 2022b).
We analyzed BCoV RNA by a SYBR-based RT-qPCR assay. The RT-qPCR mixture for SYBR-based RT-qPCR assay included 3 μL of RNA sample, 0.3 μL of 10 μM forward and reverse primer, 1.275 μL of molecular biology grade water (Corning, NY, USA), 5 μL of 2×iTaq universal SYBR green reaction mix, 0.125 μL of iScript reverse transcriptase from the iTaq™ Universal SYBR® Green One-Step Kit (1725151, Bio-Rad Laboratories, USA). The PCR cocktail was placed in 96-well plates (4306737, Applied Biosystems, USA) and analyzed by an RT-qPCR system (QuantStudio 3, Thermo Fisher Scientific, USA). The RT-qPCR reaction was performed with a thermocycle of 50℃ for 10 minutes and 95℃ for 1 minute, followed by 40 cycles of 95℃ for 10 seconds and 60℃ for 30 seconds. Melting curves were analyzed while the temperature increased from 60°C to 95°C. Based on the melting curves, the primers were specifically bound to the target genome. The SYBR signal was normalized to the ROX reference dye. The cycles of quantification (Cq) were determined by QuantStudio Design & Analysis Software (v1.5.1). The numbers of technical replicates were 4 for synthetic RNA controls and from 3 to 5 for sewage samples. The PCR efficiencies for RT-qPCR were higher than 85% (R2>0.99).
Once RNA concentrations in the final extracts were determined, we calculated RNA concentrations in sewage samples using Eqs. 1-4.


Where CRNA extract, Csludge, and Cinitial sewage indicate RNA concentration in RNA extract, sludge, and initial sewage, respectively. VRNA extract, Vsludge, and Vinitial solution mean volume of RNA extract, sludge, and initial sewage, respectively. RE and CF represent recovery efficiency and concentration factor, respectively.
Testing for PCR inhibitors
We evaluated the impacts of potential remaining PCR inhibitors in the RNA extracts by spiking RNA extracts with TV RNA. TV is a calicivirus that infects rhesus monkies, so TV should not be present in our collected sewage samples. We added 1 μL of 106 gc/μL TV RNA to 10 μL RNA extracts and 10 μL molecular biology-grade water (Millipore Sigma, Burlington, MA, USA). We assumed that if an RNA extract includes PCR inhibitors, a Cq value for TV in the RNA extract will be higher by 1 Cq value or more than in inhibition-free water.
Presentation of viral genome concentrations
If one of the technical replicates for RT-qPCR is undetermined until 45 PCR cycles, then viral genome concentrations are not quantitatively reliable (Safford et al., 2022; Fig. S2A). Hewitt et al. (2022) and Fig. S2B showed that positivity/negativity (Eq. 5) is a better indicator for the actual genome concentrations than the Cq values when samples have undetermined RT-qPCR results. We used standard curves to convert Cq values to concentrations when none of the technical RT- qPCR replicates showed undetermined. On the other hand, when undetermined data was reported, we used positivity to estimate viral RNA concentrations (Eq. 6).


Where CS represents the N gene concentration of samples containing undetermined qPCR results in technical replicates. CL indicates the lowest N gene concentration from samples that do not have undetermined qPCR results. In addition, as suggested in previous studies (Simpson et al., 2021; Wolfe et al., 2021; Zhan et al., 2022), we presented SARS-CoV-2 RNA concentrations normalized to PMMOV for comparisons with clinical epidemiology.
Using BCoV spiked experiments to determine sample composite period
We put 35 mL of sewage sample and 350 μL of 105 gc/μL BCoV particles in a 50 mL sterile tube. The five tubes of the sewage samples containing BCoV were incubated in a water bath where the temperature was maintained at 25℃. We collected samples every 24 hours for five days. The number of BCoV RNA was determined by the extraction method and RT-qPCR assays mentioned above. We assumed that the RNA decay follows the first-order decay model (Eq. 7).


Where Ct and C0 are the concentration of BCoV RNA at time t and zero, k is the first-order decay rate constant. The rate constant is equal to the slope of ln C and the time graph (Eq. 8), which was determined by the linear least-squares regression model.
Clinical epidemiology
The Champaign-Urbana Public Health District (CUPHD) provided daily COVID-19 cases with spatiotemporal information, with which we determined the 7-day average and relative infection case. The relative infection case refers to the number of patients who actively contribute to sewage viral load. The relative infection case is determined by multiplying temporal daily COVID-19 cases by a virus shedding model (He et al., 2020; Hewitt et al., 2022). We determined the COVID- 19 incidence rate for each sewershed by normalizing the COVID-19 occurrence (cases/day) to the conresponding populations.
 We analyzed 138 sequences from the Global Initiative on Sharing All Influenza Data (GISAID), which were reported from Champaign County in 2021 using an algorithm, PRIMES developed by Oh et al. (2022b) to determine the temporal prevalence of SARS-CoV-2 variants in Champaign County.
Statistical analysis
We conducted various statistical analyses to support the credibility of data comparisons. Specifically, BCoV RNA concentrations in sewage with different incubation times were analyzed by Mann-Whitney U Test and a linear least-squares regression model (Fig. S3). PMMOV and BCoV RNA concentrations were not normally distributed, so Kruskal Wallis ANOVA was used to compare these data across the seven sewersheds (Fig. S4 and Fig. S5). The Cq values of serial dilutions determined by multiplex and singleplex RT-qPCR assays were compared by F-tests (Fig. S7). In addition, N/PMMOV was not normally distributed, so we used Spearman’s rank correlation to compare it to clinical epidemiology (Table S5). These statistical analyses were performed using OriginPro (version 2019b). Furthermore, we analyzed the possibility of detecting the SARS-CoV- 2 N gene at a given COVID-19 incidence by a binary logistic regression model. This statistical analysis was performed using the statsmodels library in Python (version 3.8.8) (Seabold and Josef Perktold, 2010) and the algorithm is deposited at https://github.com/Nguyen205/Logistic_regression.
Results and Discussion
Quality assurance and quality control
We first identified what an appropriate sample composite period was to establish an efficient WBE procedure by spiking samples with known amounts of bovine coronavirus (BCoV) RNA and examining its stability over time. Fig. S3 used controlled laboratory conditions and showed the concentrations of BCoV RNA as the incubation time increases. The reduction in BCoV RNA concentrations followed the first-order decay kinetics (R2=1.00) with a first-order decay rate constant of 0.22 day-1, which is within the range of previously reported rate constants for SARS- CoV-2 and PMMOV (Roldan-Hernandez et al., 2022). Under these conditions, BCoV RNA concentrations were not significantly different from initial concentrations to four days post- incubation (Mann-Whitney U Test; p>0.05). Ahmed et al. (2020a) found similar results when using SARS-CoV-2.The temperatures measured at our sampling sites were lower than 25℃ throughout the monitoring period. Therefore, we were assured that coronavirus RNA genomes would remain stable when we collected 4-day 4-day composite sewage samples.
PMMOV RNA concentrations were quantified for each composite sample as an indicator that fecal material was present in a composite sample (D’Aoust et al., 2021). The PMMOV RNA concentrations for all collected samples across the seven sewersheds are different (Kruskal Wallis ANOVA; p<0.05, Fig. S4). This was expected because of the heterogeneity in the sewage composition. Median values of PMMOV RNA concentrations from the seven sewersheds ranged from 6.41 (C2) to 7.05 gc/L (R1), which were similar to those previously reported (Feng et al., 2021). Since PMMOV was detected from all collected sewage samples, our sampling method was indeed successfully collecting human fecal matter from sewer distribution systems.
We used the recovery efficiency for BCoV to evaluate the sample processing procedures (e.g., sludge concentration and RNA extraction). The mean, median, minimum, and maximum recovery efficiencies across the seven locations were 3.4%, 1.5%, 0.02%, and 64%, respectively. The recovery efficiencies were significantly different (Kruskal Wallis ANOVA; p<0.05, Fig. S5). A wide range of recovery efficiency was also reported previously (Feng et al., 2021), and the differences were probably attributed to different sewage characteristics. Pecson et al. (2021) investigated the reproducibility and sensitivity of 36 virus concentration methods performed by 32 laboratories across the U.S. and suggested a threshold of 0.01% of recovery efficiency for exclusion of poorly processed samples. Based on this criterion, none of the samples were screened out due to the low quality of sample processing.
Sewage samples routinely contain PCR inhibitors (Rački et al., 2014). Thus, it is essential to determine the impact of remaining PCR inhibitors in the final RNA extracts. We conducted experiments to determine the presence of RNA inhibitors by spiking samples with Tulane Virus (TV) RNA. Results are shown in Fig. S6. We found all ΔCq values were within 1.0, confirming that PCR inhibitors’ impacts in our RNA samples were negligible after 10-fold dilution.
We used multiplex RT-qPCR assays to quantify the SARS-CoV-2 N gene, the S gene for the Alpha variant, the S gene for the Delta variant, and PMMOV replication gene in the final RNA extracts to save samples, reagents, and time. Figure S7 shows that that Cq values from singleplex and multiplex RT-qPCR were not significantly different for the two sets of multiplex RT-qPCR assays (F-test; p>0.05). Thus, the fluorescence from FAM dye did not affect the HEX channel and vice versa. As a final negative control, we applied the same procedures, including sample collection, processing, and analysis, to wastewater discharged from a food processing plant and sewage samples. We did not detect any SARS-CoV-2 RNA signal (i.e., Cq values were undetermined by 45 cycles of RT-qPCR) from the food processing wastewater samples throughout the monitoring period. This finding suggests no cross-contamination among samples from different sites, so the positive Cq values were true positives.
Comparisons of clinical epidemiology and wastewater-based epidemiology data
WBE has been evaluated based on the goodness of fit to clinical epidemiology determined by statistical models such as a Pearson correlation coefficient or a Spearman rank correlation coefficient (Barua et al., 2022; Li et al., 2021), depending on the data normality. In a similar manner, we compared N/PMMOV ratios to COVID-19 incidence rates determined by three epidemiological parameters: daily COVID-19 cases (Xiao et al., 2022), 7-day average COVID-19 cases (Hoar et al., 2022), and relative infection COVID-19 cases (Hewitt et al., 2022). Then, we evaluated the goodness of fit by Spearman rank correlation (Table S5) between the N/PMMOV ratios and these epidemiological parameters. We found that the relative infection cases yielded higher correlation coefficients than daily cases and 7-day averages at six sewersheds (C1, C2, C3, C4, R1, and R2). Therefore, we used relative infection cases to determine the COVID-19 incidence rate.
The correlation coefficient between COVID-19 incidence rate and N/PMMOV ranged from 0.08 (R3) to 0.72 (C1) across the seven sewersheds (Table S5). Overall, the correlation coefficients showed a considerable variation among the sewersheds. There are several possible explanations for the lack of uniform correlations. First, the average COVID-19 incidence rate was 0.004% throughout the monitoring period, which is equivalent to only a few daily COVID-19 cases in neighborhood-scale sewersheds serving populations of around 1,400 people. Fig. 2A shows no COVID-19 patients were reported at the seven sewersheds for 1,544 days out of 2,104 days of monitoring periods (i.e., 73.4%). One, two, and three or more patients were reported at 18.7, 4.9, and 3.0%, respectively. Individual patients have significant differences in clinical symptoms, viral shedding, and access to COVID-19 tests. For example, Ke et al. (2022) found significant person- to-person variations in viral load and virus shedding duration among COVID-19 patients. A time lag between symptom onset and testing date also varies because people have different access to COVID-19 testing. The fact that the different time lags significantly impact the correlation to the WBE data is demonstrated by the highest correlation coefficient (0.72) at location C1. Most residents of location C1 were undergraduate students enrolled at the University of Illinois Urbana- Champaign, which required students to undergo routine COVID-19 testing. For example, graduate students were required to get tested once a week until August 2021. Undergraduate students were requird to get tested twice a week until May 2021, and then once a week from May to August 2021. While the mandatory COVID-19 testing was lifted for fully vaccinated individuals in September 2021, many residents in campus town were still required weekly testing. Therefore, compared to other sites, the reported COVID-19 cases at C1 were much closer to the actual infection cases. The individual heterogeneity in clinical symptoms including virus shedding and access to COVID-19 tests will become more significant as the number of COVID-19 cases decreases. Second, SARS- CoV-2 RNA was present at a low concentration in sewage samples. The SARS-CoV-2 N gene concentrations are summarized in three groups (Fig. 2B); the N gene was not detected; the N gene was detected in at least one of the qPCR replicates, but the concentrations were below LOQ; the N gene concentrations were above the LOQ. We found that 92% of sewage samples showed concentrations below the LOQ. By definition, the concentrations below LOQ are not quantitatively reliable, and the concentrations may differ from the actual virus concentrations. Therefore, we concluded that the unclear relationship between the WBE and the clinical epidemiological data was attributed to a low number of COVID-19 cases in sewersheds and low SARS-CoV-2 concentrations in sewage.

Stacked histograms for (A) COVID-19 daily cases in sewersheds and (B) SARS-CoV-2 concentrations in sewage.
A COVID-19 warning system for neighborhood-scale sewersheds with low COVID-19 incidences
We developed a COVID-19 warning system for a high COVID-19 incidence by setting a threshold of N/PMMOV to separate the monitoring periods into high- or low-risk. Specifically, the sewershed was classified as a high-risk period if N/PMMOV was higher than the threshold from two consecutive monitoring results. Conversely, this warning was dismissed when the N/PMMOV values were below the threshold for the two samples in a row. We decided to make decisions with two samples with the same results to exclude uncertainty in the measurement.
We applied the COVID-19 warning system with a N/PMMOV threshold of 10-2.0 to the seven sewersheds. Then, we presented the entire monitoring period classified into low (blue) and high (pink) risk periods in Fig. 3. As a result, there were 26 local outbreaks with a COVID-19 incidence rate higher than 0.5% (Table S6), and the COVID-19 warning system alarmed the 19 outbreaks (73% of sensitivity). Also, the warning system assigned 17 high-risk periods for the seven sewersheds, among which 12 high-risk periods were related to the local outbreaks of COVID-19 with higher than 0.5% (71% of specificity). These findings suggest that the high-risk periods determined by the COVID-19 warning system aligned with the local COVID-19 outbreaks at the neighborhood-scale sewersheds.

Comparisons between clinical epidemiology (COVID-19 incidence rate) and wastewater- based epidemiology (N/PMMOV). Open symbols represent WBE results (i.e., rectangles for the N gene, circles for the Alpha variant, and triangles for the Delta variant). We assigned about 10-4 of N/PMMOV to samples tested negatives for the N gene to differentiate these samples from samples not measured. Black solid curves show the COVID-19 incidence rates. The horizontal dashed lines show the threshold N/PMMOV of 10-2.0. The monitoring period is separated either into the high-risk (pink) or the low-risk (blue).
We also found that the sensitivity and specificity of the COVID-19 warning system to the local outbreaks changed with different thresholds of N/PMMOV. Fig. 4 showed the high-risk periods at C1 with different thresholds. We found that several low-risk periods changed to the high-risk as the threshold decreased. For example, November was a low-risk period with a N/PMMOV threshold of 10-1.8 (Fig. 4A) but switched to a high-risk period with a threshold of 10-2.0. Likewise, C1 is classified as a low-risk period in April with a threshold of 10-2.0, but it changes to a high-risk period when the threshold decreases to 10-2.1. As a more extended period is classified into the high-risk, the sensitivity increases while the specificity decreases. Fig. S8 and S9 show the COVID-19 warning systems applied to the seven sewersheds with the thresholds of 10-1.9 and 10-2.1, respectively. We found that the sensitivity of the warning system increased from 54% to 81% while the specificity decreased from 75% to 61% as the thresholds changed from 10-1.9 to 10-2.1. This finding suggests that we can increase the possibility of detecting local outbreaks by decreasing the thresholds, although the probability of not including the outbreak in high-risk periods may increase (i.e., decreases in specificity).

Application of the COVID-19 warning system to location C1 with different thresholds; (A) 10-1.8, (B) 10-2.0, and (C) 10-2.1 of N/PMMOV. The high-risk and the low-risk periods are presented in red and blue shades, respectively.
We also compared WBE data to the county-wide COVID-19 incidence rate. Fig. 5A shows the COVID-19 incidence rate in Champaign County, which includes all seven sewersheds during the same monitoring period as our WBE program. There were four county-wide outbreaks in descending order of disease incidence rate in September, November, February, and April (Arrows in Fig. 5A point each peak). According to our COVID-19 warning system, all seven sewersheds were high-risk periods in September when the disease incidence was the highest during the monitoring period (the Delta variant outbreak) (Fig. 3). Four sewersheds (C1, C2, R1, and R2) were high-risk periods in November (the beginning of the 2022 winter outbreak). Also, four sewersheds (C1, C3, R1, and R2) were high-risk periods in February (the end of the 2021 winter outbreak). Finally, only one site (C3) was the high-risk period in April when disease incidence was the lowest among the four county-wide outbreaks. The location C3 showed clear peaks of the COVID-19 incidence rate from April to June (Fig. 3C), supporting that this high-risk period is a true positive. The finding that the number of sewersheds in high-risk periods is related to the scale of the county-level outbreaks confirms the credibility of the COVID-19 warning system.

COVID-19 clinical epidemiology data from Champaign County. (A) COVID-19 incidence rate and (B) the prevalence of SARS-CoV-2 variants. The red dashed line in (A) indicates a 0.14% of incidence rate with which viruses in sewage discharged from a county-scale sewershed are expected to be detected with 90% probability. The variant prevalence in (B) was determined based on genome sequences deposited at GISAID (n=138).
The high-risk period at C3 from April to June further highlighted the advantage of the COVID-19 warning system. We determined a sensitivity of our WBE procedure, defined as the COVID-19 incidence rate at which viruses in sewage are detected at 90% probability. The data from C1 was used for a binary logistic regression analysis because the COVID-19 incidence rate is most reliable in C1 due to the mandatory COVID-19 testing. We found that the COVID-19 incidence rate is a reliable predictor to explain the probability of SARS-CoV-2 N gene detection (McFadden; p<0.001). Based on the logistic regression curve in Fig. 6, the WBE sensitivity was 0.14% (or one infection case out of 715 residents). Meanwhile, the COVID-19 incidence rate of the county-wide outbreak in April peaked at 0.15%. In addition, the incidence rate was less than the WBE sensitivity (0.14%) from February 20 to July 27. If the WBE had been applied to the entire county, local outbreaks such as the high-risk period at C3 from April to June would have been overlooked. This finding suggests that wastewater surveillance should be performed at neighborhood-scale sewersheds to discern local outbreaks when the COVID-19 incidence rate is low.

Probability of detecting SARS-CoV-2 N gene in sewage samples from location C1. Black closed-circles present COVID-19 incidence rates on the x-axis. Either 1 or 0 was given to the y- value when sewage samples tested positive or negative for SARS-CoV-2, respectively. Logistic regression curves with a 95% confidence interval are presented in a red solid line and shade. McFadden’s Pseudo R-squared of the regression analysis was 0.34 (p<0.001), which is considered a good fit (McFadden, 2021). The Black dotted line indicates that the 0.14% incidence rate results in a 90% probability.
We also applied RT-qPCR assay data that specifically detected the Alpha and Delta SARS-CoV- 2 variants to the sewage samples (Fig. 3). In our sewersheds, the Alpha variant was first detected on January 27, and it continued to be reported until June 23. Also, the Delta variant was detected from June 3 to the end of the sampling (Dec. 2, 2021). In general, the periods when the Alpha and the Delta variant were detected aligned with the prevalence of SARS-CoV-2 variants determined by genome sequencing of clinical samples collected from COVID-19 patients in Champaign County, IL, USA (Fig. 5B). Furthermore, we found that Delta variant’s shedding into the sewersheds might have increased the COVID-19 incidence rates. For example, five sites (C2, C3, C4, R1, and R2) were classified as the high-risk period as soon as the Delta variant was detected. In addition, the local outbreak in June at C3, the only high-risk period from the seven sewersheds, was also associated with the Delta variant. This finding suggests that variant-specific RT-qPCR assay can be combined with the COVID-19 warning system to determine the introduction of emerging or dominant SARS-CoV-2 variants in neighborhood-scale sewersheds even at a low COVID-19 incidence.
Implication
We developed a COVID-19 warning system that is activated when the ratio of N/PMMOV concentrations are higher than 10-2.0 for two consecutive analyses. The COVID-19 warning system showed 73% sensitivity and 71% specificity to neighborhood-scale outbreaks with an incidence rate higher than 0.5%. Note that these specific sensitivity and specificity values should be interpreted with caution. For example, the sensitivity varies depending on how we define a local outbreak of interest. Although we chose an incidence rate of 0.5% for studies here, a higher COVID-19 incidence rate such as 0.75% may be more appropriate for other regions. When we examine local outbreaks with an incidence rate higher than 0.75% into account (12 outbreaks in total), 10 outbreaks are now included in the high-risk period, and sensitivity increases from 71% to 83%. In addition, it is likely that there were unreported COVID-19 cases in our sewersheds. For example, the CDC estimates actual COVID-19 infections are from 6 to 24 times higher than reported cases (Havers et al., 2020). These unreported COVID cases might have accounted for the false-positive scenarios where the high-risk periods were made without the local outbreaks. If so, the true specificity becomes higher than 71%.
Although the N/PMMOV threshold of 10-2.0 was used for our seven sewersheds, the COVID-19 warning system can be applied with different thresholds to the other sites considering regional characteristics such as local public health policies and the community’s acceptance of the COVID-19 risk (Dryhurst et al., 2020; Turska-Kawa and Pilch, 2022). Intensive care unit (ICU) occupancy rate, influenced by vulnerable populations and ICU bed capacity, may be one of the regional characteristics that should be considered to determine a threshold for the COVID-19 warning system. If some regions had experienced a high ICU occupancy rate during the COVID- 19 pandemic, COVID-19 put enormous stress on the local medical systems. Similar scenarios could happen again in the future. According to CDC, the maximum ICU occupancy rate significantly differs from site to site (http://covid.cdc.gov/covid-data-tracker). For example, in the state of Illinois (USA), some counties, such as Cook County and Champaign County, have managed ICU beds well during the COVID-19 pandemic, showing 35% of maximum ICU bed occupancy. On the other hand, other counties, including Rock Island County (85%) and Effingham County (70%), experienced a larger burden on ICU beds during the COVID-19 pandemic. Therefore, these counties may need to be more vigilant about the COVID-19 outbreak by setting a lower threshold.
Applying WBE to neighborhood-scale sewersheds may cost more than large size sewersheds for monitoring the entire administrative area. To efficiently monitor multiple neighborhood-scale sewersheds, the WBE can be deployed to some representative places of diverse societal characteristics, such as socioeconomic status, demographics, or land use category, so that we can minimize the number of monitoring sites while obtaining information about the COVID-19 incidence representative of the entire area. The COVID-19 pandemic disproportionally has impacted people depending on demographic and socioeconomic status (Bassett et al., 2020; Krieger, 2020). Thus, those underserved regions could be chosen for wastewater surveillance. For example, we chose the six sewersheds (C2, C3, C4, R1, R2, and R3) based on areas that reported fewer cases of COVID-19 testing than the average testing in the Champaign County to attempt to supplement clinical testing data, while we selected another sewershed to represent the highly- tested campus area (location C1) (Table S7). In addition, sample collection frequency can be optimized to operate WBE within a budget. Schoen et al. (2022) found that a sampling frequency of once every 4 days is not significantly different from daily sampling in estimating clinical epidemiology data. We collected 4-day composite samples to have a less frequent sampling frequency, once every 8.2 days.
Our findings on the COVID-19 warning system have significant implications for public health. COVID-19 might be moving from a pandemic to an endemic phase (Veldhoen and Simas, 2021), which involves a difference in disease surveillance strategy. In an endemic phase, we may not be able to get as accurate statistics on COVID-19 by the clinical diagnosis as we did in the pandemic phase because people will be less likely to visit hospitals to get tested or medical support. This is because the illnesses may be self-limiting (Veldhoen and Simas, 2021). People also may have less accessibility to testing sites and use rapid COVID-19 test kits instead at home (Kost, 2022). In this context, WBE will play a pivotal role in the COVID-19 surveillance because WBE provides unbiased information about all residents in the sewershed. However, unlike during the pandemic, the COVID-19 will be mostly managed at a much lower incidence level in the endemic phase. At the same time, we may see intermittent COVID-19 outbreaks due to an emerging new variant or waning immunity as we have seen measles or influenza outbreaks (Katzourakis, 2022). Lak et al. (2021) and Shi et al. (2021) discovered that local COVID-19 outbreaks can spread through the surrounding regions resulting in other outbreaks. Rader et al. (2020) explained the fast virus transmission to the surrounding areas with frequent contact among residents. These studies highlight the necessity of early detection of local COVID-19 outbreaks (Cariti et al., 2022; Wu et al., 2022a). This study shows that local outbreaks would not be detected if WBE is applied to a large-sized sewershed. Therefore, the COVID-19 warning system can be applied to neighborhood- scale sewersheds to identify covert local outbreaks in advance and the introduction of emerging SARS-CoV-2 variants, which provides a warning for large-scale outbreaks.
Conclusion
In this study, we applied WBE to seven neighborhood-scale sewersheds (an average catchment population was 1471) for eleven months. We found that WBE data from neighborhood-scale sewersheds may be poorly correlated to clinical testing data when COVID-19 incidence is low. Thus, we developed a COVID-19 warning system for high COVID-19 risk when the SARS-CoV- 2 N gene concentration in wastewater is higher than a threshold, which can be assigned in collaboration with public health officials. We demonstrated that the COVID-19 warning system can discern neighborhood-scale COVID-19 outbreaks that a county-scale WBE would not detect due to the low disease incidence. We also identified that the shedding of a new COVID-19 variant (i.e., the delta variant) to neighborhood-scale sewersheds even at the low disease incidence, leading to local COVID-19 outbreaks. Our findings highlight that WBE should be applied to neighborhood-scale sewersheds when COVID-19 incidence is maintained at a low level.
Data Availability
All data produced in the present work are contained in the manuscript
Acknowledgment
We acknowledge the funding from the Grainger College of Engineering and the JUMP-ARCHES program of OSF Healthcare in conjunction with the University of Illinois. The authors also acknowledge Hayden Wennerdahl and Kip Stevenson for sampling deployment, and Yuqing Mao, Matthew Robert Loula, Aashna Patra, Kristin Joy Anderson, Mikayla Diedrick, Hubert Lyu, Hamza Elmahi Mohamed, Jad R Karajeh, Runsen Ning, Rui Fu, and Kyukyoung Kim for sewage sampling and processing.
References


