
ABSTRACT
Currently, several western countries have more than half of their population fully vaccinated against COVID-19. At the same time, some of them are experiencing a fourth or even a fifth wave of cases, most of them concentrated in sectors of the populations whose vaccination coverage is lower than the average. So, the initial scenario of vaccine prioritization has given way to a new one where achieving herd immunity is the primary concern. Using an age-structured vaccination model with waning immunity, we show that, under a limited supply of vaccines, a vaccination strategy based on minimizing the basic reproduction number allows for the deployment of a number of vaccine doses lower than the one required for maximizing the vaccination coverage. Such minimization is achieved by giving greater protection to those age groups that, for a given social contact pattern, have smaller fractions of susceptible individuals at the endemic equilibrium without vaccination, that is, to those groups that are more vulnerable to infection.
Introduction
The pandemic of the severe acute respiratory syndrome coronavirus 2 (SARS-CoV-2) is still imposing incredible pressure on many countries’ healthcare and economic systems.
Nations in America, Europe, Asia, and Africa have faced large numbers of deaths due to COVID 19, and a continued crisis situation. The only good news in this dark situation is that vaccines are becoming available from different companies all over the world. Some countries are currently evaluating the efficacy and effectiveness of developed vaccines, while some other countries have already started their vaccination campaign. In particular, as of July 2021, more than 60% of the people in countries like Canada, United Kingdom, and Israel have received at least one dose of the vaccination, while only about 30% of people in India and Mexico have received one dose at least1. These examples give an idea of the heterogeneous situation of the vaccination campaign in the world. Additionally, it is very likely that many vaccines will provide a short-lived immunity, so after 12-18 months from receiving the vaccine, its effect may vanish and individuals will become susceptible again.
While during the ongoing pandemic most countries agree to vaccinate first public health personnel and people in long term care facilities, the limited availability of vaccines and the logistic complexities are still posing big questions on when and how the vaccination campaign will be completed. Some countries estimate that herd immunity, assessed at around 70% of the population vaccinated, will be reached in three years if vaccination rates are kept constant at their current levels. This type of news are further discouraging people, who have been experiencing more than one year of pain and economical distress.
Countries are now developing immunization plans to face the challenge of distributing millions of vaccines, some of which require very special maintenance conditions. These plans include the definition of priority schemes to start the distribution process and, since it is very likely that not all people will be vaccinated for different reasons, understanding how vaccine distribution among population age segments impacts the obtained herd immunity is of primary importance.
A vaccination strategy can be developed to obtain different goals such as minimizing deaths, minimizing number of cases, minimizing severe cases requiring hospitalization, etc.2. For instance, in a very recent paper3, the authors consider five different vaccine prioritization strategies. Among their findings, it was shown that giving priority to adults ages 20-40 years minimizes the cumulative incidence, while mortality is minimized by giving priority to adults ages 60 and more. Another very recent article4 investigates two criteria for vaccination priority based on age: lives saved and years of future life saved. While in general these two criteria can be in conflict, in the case of COVID-19, vaccinating the oldest first saves the most lives and simultaneously also maximizes years of remaining life expectancy.
In our case, for a given supply of vaccine we aim at finding the minimum vaccination rate for each age segment that guarantees the basic reproduction number R0 to be smaller than one, so stabilizing the dynamics at the disease-free equilibrium. We hope that a specific vaccination rate for each age-group can lead to a total vaccination rate that is smaller than the critical vaccination rate that brings R0 = 1 when homogeneous average contact patterns are considered.
The problem of vaccination strategies to achieve herd immunity has been studied for several infectious diseases and for many years5–7. Recently, an aged-structured SEIR model has been developed to asses the feasibility of herd immunity and a drastic reduction of the transmission rate8. The model revealed that obtaining heard immunity was not a practical objective and social distancing needed to be maintained and adapted for an extended period. Almost at the same time, it was studied how herd immunity is influenced by population heterogeneity9. The model of COVID-19 transmission was a SEIR model and the population was divided in six age groups with heterogeneous contacts fitted to different social activities. In this setting, it is shown that herd immunity can be reached at around 43% instead of the traditional value of 60% that appears when R0 = 2.5 under a homogeneous mixing of the population.
In another approach to vaccination10, the authors have investigated how much vaccine is required by any given country, year by year, to create herd immunity to block SARS-CoV-2 transmission, assuming immunity is short lived (waning immunity). To answer this question, a simple model is developed showing the percentage of the population in the first year of an epidemic that must be vaccinated and the percentage that must be vaccinated once the system reaches equilibrium after a few years. Results show that in year 1 a much larger fraction of the population needs to be vaccinated, being most of the population susceptible, compared with the population fraction to be vaccinated in subsequent years, to create effective herd immunity.
In this paper, we deal with the question of the challenges associated to creating herd immunity to SARS-CoV-2 infection by an age-structured vaccination program in the case of waning immunity but taking into account the contact rates among age segments8, 9. In particular, we develop a model similar to the one considered by Brett & Rohani8, and derive from it the expression for the vaccination rates that lead to the maximum vaccination coverage of the population for a limited supply of vaccine. Having waning immunity implies that continuous vaccination campaigns are needed to preserve the herd immunity. Furthermore, considering the contact pattern among age groups in several countries, we compute two different sets of rates: 1) the per age-group vaccination rates that minimize R0 with the constrain that the total vaccination rate is the same as the critical rate under uniform vaccination, and 2) the age-group vaccination rates that guarantee R0 = 0.996. Since the minimum R0 corresponding to the first set will be clearly smaller than 1, the vaccination rates of the second set will be smaller than those in the first set, thus achieving the herd immunity at a lower level of population vaccination. For example, to reach herd immunity in Italy, a total vaccination coverage of 60% of the population is required in the case of random homogeneous vaccinations. However, if age-group contact patterns are considered, only 55% of the population needs to be vaccinated to reach a stable disease-free equilibrium, with a non-negligible saving. We have also verified that these results hold when considering a high but not complete success rate for vaccines, and a variable duration of immunity on different age groups.
To our knowledge, this is the first study on the combined impact of age-group contact patterns and short-lived vaccination immunization on the fraction of the population that needs to be vaccinated in each age-group in order to minimize the basic reproduction number. We are able to quantify the importance of specific contact patterns in different countries through a reduction of the vaccination coverage, which can go from 62% coverage in the homogeneous settings to 53% in the age-dependent vaccine distribution in Peru. Even though we are aware that these numerical results are obtained on the base of measured and consequently noisy contact patterns, nevertheless our mathematical model reveals the critical role played by the age-based contact patterns in efficiently administering vaccines and can be useful in encouraging the population to see a possible end of the pandemic by vaccination.
The model
In this paper we consider a deterministic epidemic model with continuous vaccination where individuals are classified in three age groups: youngsters, adults, and the elderly. Within each age class, individuals are classified according to their disease status: susceptible, infectious, recovered, and vaccinated. It is assumed a loss of immunity in recovered and vaccinated individuals at rates δi and  , respectively. Moreover, the probability that the vaccine successfully protects against infection is assumed to be age-dependent and it is denoted by pi (i = 1, 2, 3).
The number of infections in age group i caused by are individuals of age group j is β cijSiIj/Nj, where Si is the number of susceptible individuals in age group i, Ij/Nj is the fraction of infected individuals in age group j, β is the transmission probability through an infectious contact, and C = (cij) is the social contact matrix. C gives the (mean) number of contacts per unit time between a susceptible individual of age group i and individuals of age group j, and is the central ingredient of the model since it reflects how individuals mix with each other in different countries.
To model the limited capacity of a public health system or situations of vaccine shortage as those occurring in low-income countries where only 1% of people has received at least one dose of a COVID-19 vaccine as of July 20211, a fixed number w of individuals is assumed to be vaccinated per unit of time (constant vaccination rate) and, moreover, we will assume an age-dependent targeting of vaccination3,6. So, if wi denotes the number of vaccines assigned to age group i per unit of time (vaccination rate of age group i), then wi Si/Ni is the number of susceptible individuals in age group i vaccinated per unit of time when vaccination is made regardless of disease status11. In particular, if we do not consider age, then under a uniformly random vaccination of a population it follows that wi = w fi with fi = Ni/N, i.e., wi is proportional to the fraction of the population in age group i, with ∑i wi = w. In such a case, the vaccination term in the equation for the susceptible individuals in age group i is given by wi Si/Ni = w fi Si/Ni = w Si/N. So, any strategy that departs from this uniform vaccination will be given by a vector (w1, w2, w3) of vaccination rates of each age group satisfying  .
.
According to these hypotheses, assuming an arbitrary vaccination strategy  , and ignoring the demographics of aging, birth, and death given the short timescale of an epidemic, the equations governing its dynamics are
 with Si + Ii + Ri +Vi = Ni, i = 1, 2, 3.
Writing the system in terms of fractions (si = Si/Ni, yi = Ii/Ni, ri = Ri/Ni, and vi = Vi/Ni) and neglecting the last equation because it is redundant, we have
 with si + yi + ri + vi = 1, and
  is the per capita vaccination rate of age group i. Note that, from the constraint
  and the definition of
  , it follows that
  , the mean per capita vaccination rate in the population.
The previous relationship among the per capita vaccination rates of each age group implies that, if the population fraction of an age group i is lower than the number  of available vaccines per person and per unit of time
  , then
  is required when vaccines are mainly targeted at this age group (i.e., when
  for j ≠ i). Roughly speaking,
  corresponds to situations in which there are more available vaccines per unit of time than people to be vaccinated in the i-age group (remember we are assuming a constant vaccination rate w).
The disease-free equilibrium and vaccination strategies
The disease-free equilibrium (DFE) of system (1) is  with
with
 and
and  . Therefore, at this equilibrium, only susceptible and vaccinated individuals are present.
The basic reproduction number at the DFE, here denoted by  to distinguish it from the one for the model without vaccination, is the largest eigenvalue of the next-generation matrix12
 where
where  is given by (2), C is the social contact matrix, and 1/γi is the mean infectious period of infected individuals of age group i. So, given the constraint on the per capita vaccination rates
  , we will consider
  as a function of
  and
and  :
:  .
.
From (2) we can compute the condition on  for having a maximum vaccination coverage of the population at the DFE, which is equivalent to minimize the fraction of susceptible population at this equilibrium,
  . Precisely, the condition
  and the positivity of the rates amount to
 with
with  satisfying
  . So, from (3) one easily obtains an explicit expression for the vaccinations rates
  leading to the maximum vaccination coverage under the constraint of having a given amount of vaccine per unit of time, which turns out to be a global maximum. In particular, it follows that, if the rate of immunity loss
  is the same for the vaccinated individuals of all the age groups and the probability of being protected after vaccination pi is also the same across age groups, then the vaccination rates that guarantee the maximum fraction of vaccinated population are
  , i.e., they correspond to a uniformly random vaccination of the population irrespective of age and disease status.
By definition, under such a vaccination strategy, the probability of being vaccinated per unit of time is the same for any individual regardless of age. In this case, the differential equation governing the dynamics of the susceptible individuals of age group i is
Using  as a tuning parameter, we compute the basic reproduction number
  , and find the critical per capita vaccination rate
  defined by
  . As an example, Fig. 1 shows the behaviour
  with the data from Italy which lead to
  . At this critical value, the vaccination coverage of the population is 60.37%.

 for system (1) at the disease-free equilibrium given by (2). The critical vaccination rate is given by the intersection of
  with the dashed line
  . Parameters: γ1 = 1, γ2 = 1, γ3 = 0.9,
  , p1 = p2 = p3 = 1, and β is scaled such that R0 = 2.5 for the data set from Italy in the absence of vaccinated individuals
  , see Results and Discussion for details.
When the rates  of immunity loss among groups differ from each other, the maximum vaccination coverage at the DFE will be attained for values of the per capita vaccination rates
  that do not correspond to a uniformly random vaccination of the population. These
  are optimal in the sense that they maximize the vaccination coverage; however, they do not guarantee the minimum value of
  at the DFE. This fact, indeed, can be used to define an alternative criterion for an optimal vaccination strategy, namely, the one than leads to the lowest value of
  at the DFE. Under such a strategy, we control the disease by targeting age groups according to their potential contribution to an epidemic outbreak. So, we use the same amount of vaccines per unit of time but, in comparison to the random vaccination, we are vaccinating more individuals from some age groups while other age groups are less vaccinated. This situation corresponds to what has been called an optimal but inequitable distribution of vaccine2.
Methods
Data
The Social Contact Data initiative (http://www.socialcontactdata.org) includes contact matrices for Belgium, Finland, Germany, Italy, Luxembourg, Netherlands, Poland and the UK from POLYMOD13, as well as data from studies on social mixing in other countries14. All data are available on Zenodo at https://doi.org/10.5281/zenodo.1215899, and can be retrieved within R using the socialmixr package. The SOcial Contact RATES (Socrates) data tool at http://www.socialcontactdata.org/socrates/15 enables quick and convenient retrieval of these social contact matrices. Using the Socrates data tool, we have selected six countries for our numerical evaluations: Belgium, Germany, Italy, the Netherlands, Peru, and Zimbabwe. All the European data-sets are from the POLYMOD project13. The contact matrix for Peru is from16 and the one for Zimbabwe is from17. Furthermore, we have selected three age groups: the first group includes people of age 0 to 17 years, the second group includes people of age 18 to 59 years, and the third group includes people 60 years old and older. For each of these countries and age groups, the Socrates data tool provides the average number of contacts per day. We have selected the countries listed above to represent different contact patterns for the three age groups. All the daily contact matrices and population proportions are reported in the Appendix.
Parameters
The recovery rate and loss of immunity rate are assumed to be the same in the six countries in exam and, also, to be very similar among groups. The recovery rates are γ1 = γ2 = 1 and γ3 = 0.9. Therefore, since these rates are equal to 1 (or very close to it), we can consider that time is measured in units of the infectious period, which is about one week (8 to 10 days) for moderate cases of COVID-19. The loss of immunity rates for recovered (δi) and vaccinated  individuals are δ1 = δ3< δ2 = 1/52. These values of
  say that, on average, individuals between 18 an 60 years have one year (52 weeks) of immunity against the disease, while the length of this period is assumed to be shorter for individuals from the other two age groups (40 weeks; except for Fig. 5 in the Appendix, where it is equal to 26 weeks).
For each country, the transmission rate β is obtained by imposing that R0 = 2.5 at the beginning of the epidemic when vaccinated individuals are not present. In this case, R0 is the largest eigenvalue of the next-generation matrix
The original matrix C is given in terms of contacts per day. Since our unit of time is one week, we multiply the contact matrices in the Appendix by 7 to compute β. However, note that working with these re-scaled contact matrices only affects the value of β (which is divided by 7 when re-scaled contact matrices are used) but not the results we are presenting because the product βcij in the incidence term is invariant to the re-scaling of C.
Given that the disease parameters across the countries are the same, we can assess the impact of the social contact patterns on the spread of the disease and, in particular, on the optimal vaccination strategy. Fig. 2 shows the evolution of the fraction of susceptible individuals during an epidemic without vaccination for the selected parameters. Although the mean fraction is very similar in the three examples, we can see that the smallest fraction of susceptible individuals corresponds to a different age group, suggesting that the vulnerability of the age groups depends on the demography and on the contact pattern in each country.

Examples of evolution of susceptible individuals during an epidemic given by (1) without vaccination with initial condition (si(0), yi(0), ri(0)) = (0.9999, 0.0001, 0) for i = 1, 2, 3. Parameters: γ1 = 1, γ2 = 1, γ3 = 0.9, δ1 = 1/40, δ2 = 1/52, and δ3 = 1/40. For each country, β is scaled such that R0 = 2.5 for the corresponding data set in the absence of vaccinated individuals.
Results
Critical rates under uniformly random vaccination
For all the data sets, the critical per capita vaccination rate under the uniformly random vaccination  when perfect protection is assumed. The specific critical rate values and vaccination coverage for each country are reported in Table 1 under full protection of the vaccine (the two left columns), and probabilities p1 = 1, p2 = 0.95, and p3 = 0.9 of being protected after vaccination (the two right columns). In both scenarios, Peru is the country with the largest critical per capita vaccination rate (3.54% and 3.59%, respectively), which leads to the highest vaccination coverage of the population (62.03% and 61.48%, respectively). We can interpret these values of the coverage as the herd immunity level required for Peru under a uniformly random vaccination.
Vaccination coverage (in %) adopting the uniformly random vaccination strategy at the critical per capita vaccination rate  (in %) with a 100% vaccine efficacy (left), and with p1 = 1, p2 = 0.95, p3 = 0.9 (right). Parameters: γ1 = 1, γ2 = 1, γ3 = 0.9,
  . For each country, β is scaled such that R0 = 2.5 without vaccination.
Table 1 shows that, as expected, the critical vaccination rate increases when there is a fraction of people who are not completely protected after being vaccinated (pi < 1). It also shows a small decrease in the vaccination coverage for all the data sets except for the one from Zimbabwe. Note that the vaccination coverage depends in a nonlinear way on the probability pi of being protected after vaccination.
Vaccination strategies
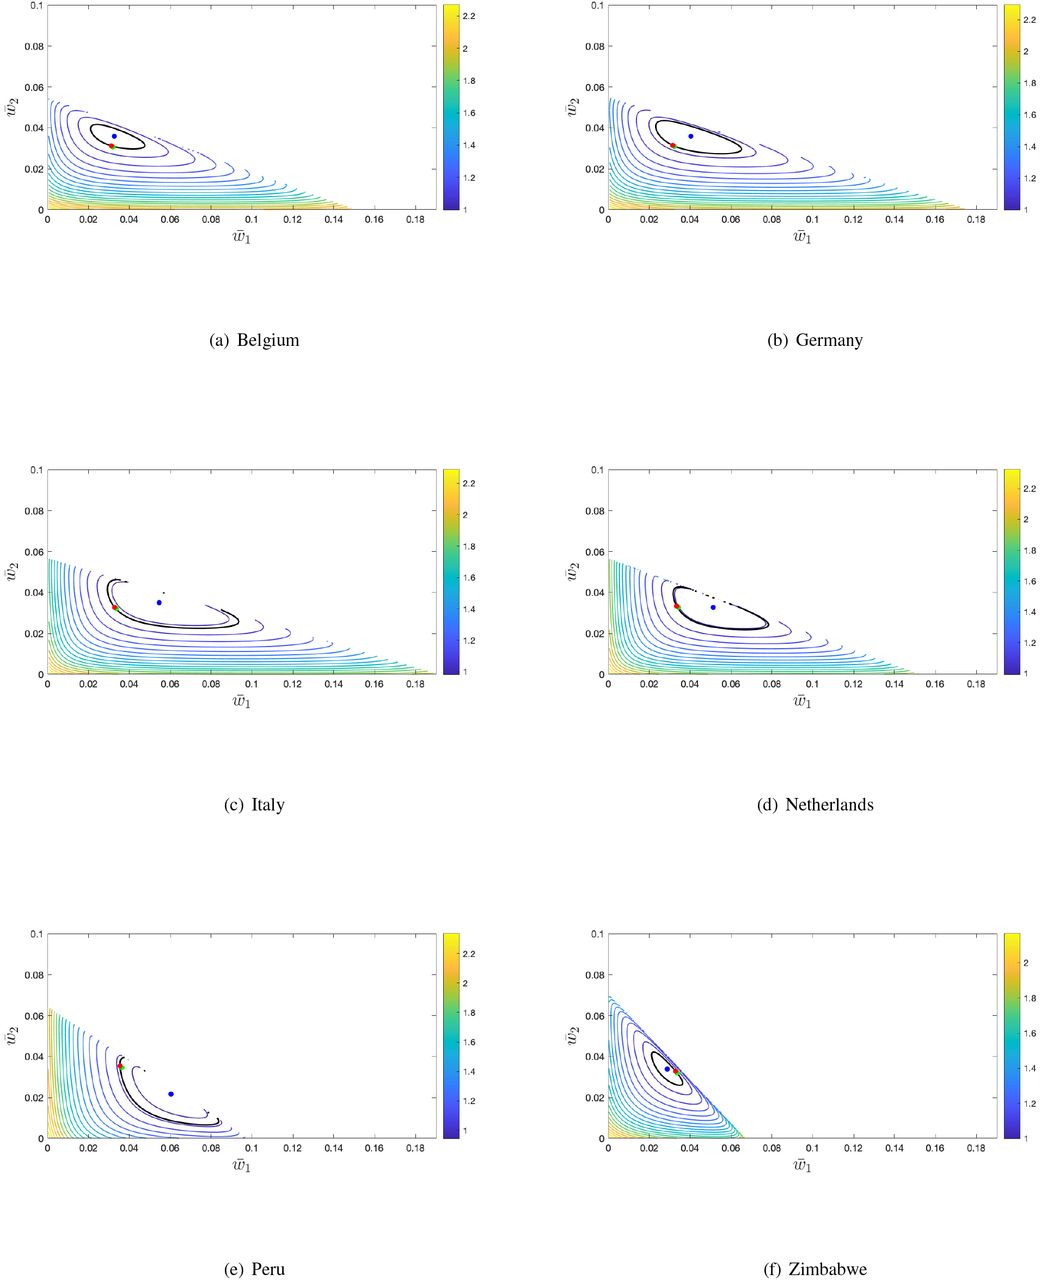
In Fig. 3 we show the contour plots of  as a function of
  and
and  for the six data sets. In this figure, we assume that the mean vaccination rate
  and 100% of vaccine efficacy. Because of the constraint on the three
  , the interior boundary of each plot corresponds to
  , i.e., to
  .
.

Contour levels of  at the DFE of system (1) with pi = 1 (i = 1, 2, 3). Black level curve corresponds to
  . Blue point: Minimum of
  . Red point:
  under uniformly random vaccination:
  . Green point:
  at the disease-free equilibrium with the maximum vaccination coverage. Parameters: γ1 = 1, γ2 = 1, γ3 = 0.9,
  , and
, and  for each data set. For each country, β is scaled such that R = 2. 5 in the absence of vaccinated individuals.
It is interesting to observe that the population fraction of the second age group (18 to 59 years), f2, varies narrowly from 0.46 (Zimbabwe) to 0.59 (Netherlands). This is why the range of values of  goes from 0 to 0.055-0.071 in all panels of Fig. 3 (its maximum value is
  . By contrast, the values of
  (and, so, those of
  ) show a greater variability. The more extreme situation appears in the data from Zimbabwe with the highest population fraction in the first group (0-17 years) (f1 = 0.49,
 ), and the lowest fraction in the third group (60+ years) (f3 = 0.04,
  ).
).
With respect to the vaccination strategies shown in the panels of this figure, the (red) point  corresponds to the uniformly random vaccination with
  and, as expected, it is very close to the one that maximizes the vaccination coverage (green point) because we are assuming very similar rates of immunity loss for the vaccinated individuals of the three age groups. However, increasing the differences between these rates results in greater distances between both points, as it can be observed in Fig. 5 (Appendix), where the probabilities pi are also different for each age group. In both figures,
  1 at the maximum coverage (green point) for the data sets from Belgium (1.0028, 1.0037) and Germany (1.0020, 1.0017), whereas
  at this point for the data sets from Italy (0.99786, 0.99024), the Netherlands (0.99538, 0.98184), and Peru (0.99001, 0.97032). For the data set from Zimbabwe,
  .0008 in Fig. 3 and
  in Fig. 5.
In Table 2, we can see that, as just explained above, the per capita vaccination rates  computed from (3) are all very close to
  with
with  (because
  ). Moreover, these rates lead to the same vaccination coverage as the uniformly random vaccination with
  (cf. Table 1). But, remarkably, they are clearly different from the vaccination rates
  defining the minimum value of
  for the same value of
  (blue point in Fig 3).
Mean vaccination coverage (in %) at the vaccination strategy  (in %) leading to the minimum R0 at the DFE, and at the vaccination strategy
  (in %) computed from Eq. (3) leading to the maximum mean vaccination coverage. In both cases, the mean per capita vaccination rate
  , and 100% vaccine efficacy is assumed. Parameters: γ1 = 1, γ2 = 1, γ3 = 0.9,
  , and
, and  . For each country, β is scaled such that R0 = 2.5 in the absence of vaccinated individuals.
In Fig. 3, we also observe that there is a distance between the  blue point and the R0 = 1 black curve, which is more evident in some of the six plots. This distance creates the opportunity for vaccination rates that can still guarantee a locally stable DFE but with a total vaccination rate below the critical rate obtained under the assumption of a uniformly random vaccination.
To illustrate this fact, in Fig. 4, we show contour plots for  such that the rounded value of the minimum R0 is equal to 0.996. As expected, in these figures this minimum (blue point) is very close to the R0 = 1 curve because, now, we are administering a lower number of vaccines. Considering Italy, for example, we obtain
  , which, compared with
  , is equivalent to a reduction of the vaccination rate of 13.7%. Such a reduction of the vaccination rate can correspond to non-negligible savings. Peru is the country, among the ones considered, which gains the larger vaccination rate reduction, from 0.0354 to 0.0284, with a vaccination reduction of 19.8%. Table 3 summarizes the vaccination rates for
  and
and  for the selected countries and the corresponding vaccination coverage. When we look for a vaccination strategy to bring the system to the disease-free equilibrium, taking into account the country’s contact patterns per age-group provides an opportunity to reduce the critical vaccination rate compared with the one needed considering homogeneous mixing. This has also a consequence on the estimation of the herd immunity coverage for each country. The consideration of contact patterns at the level of age groups, reducing the required vaccination rate, reduces also the level of vaccination coverage required, reducing in turn the herd immunity levels, as it is also shown in this table.
Vaccination coverage (in %) at the critical per capita vaccination rate  (in %) under the uniformly random vaccination strategy, and at the mean per capita vaccination rate
  (in %) at the DFE for which R0 ≈ 0.996. 100% vaccine efficacy is assumed in both cases.

Contour levels of  at the DFE of system (1) with pi = 1 (i = 1, 2, 3) and for
  , a value for which R0 ≈ 0.996. Black level curve corresponds to
  . Blue point: Minimum of
  . Red point:
  under uniformly random vaccination:
  . Green point:
  at the disease-free equilibrium with the maximum vaccination coverage. Parameters: γ1 = 1, γ2 = 1, γ3 = 0.9,
  . For each country, β is scaled such that R0 = 2.5 in the absence of vaccinated individuals.
Discussion and conclusions
During an ongoing epidemic like COVID-19, priorities are focused on immunizing in a short time as many people as possible, those working in front-line healthcare staff, in essential services, and those whose health conditions predispose to severe morbidity from infection. In contrast, in the long term, R0 can play a role in defining the minimum vaccination coverage for preventing new epidemic invasions6, 10 by reaching the so-called herd immunity. It is currently not clear whether many countries could achieve such a herd immunity for COVID-19. Several reasons have been proposed for that: the limited availability of vaccines in many countries, the fact that immunity might not last forever, or the appearance of new variants of the virus that could change the herd-immunity threshold itself18. There is also a critical hesitation against vaccination arising from the spread of misinformation on the Internet19, which has been called COVID-19 infodemic20.
In this paper, we have assumed a limited supply of vaccines conferring waning immunity to deal with some of these issues. The aim is to see how herd immunity can be achieved in partially vaccinated populations whose individuals are classified in (three) age groups when their contact patterns are taken into account. Moreover, by assuming similar disease rates for all age groups and countries, we have been able to assess the impact of social contact patterns on the critical vaccination coverage. Such an impact has been analyzed by obtaining the set of per capita vaccination rates that minimizes R0 under the constraint that the vaccine’s availability is given by the vaccination rate leading to a critical vaccination coverage (R0 = 1) under a uniformly random vaccination. Even though this is a strong constraint, the first observation is that this set defines a vaccination strategy that reduces R0 to values that are clearly below 1 ( for the data set of Peru). So, our first conclusion is that there is room for an improvement in the vaccine distribution when demographic and social aspects are considered. We estimate the vaccine reduction achieved following the R0-minimization strategy by decreasing the total availability of vaccines per unit of time in such a way that the minimum of R0 is close to 1 (here
  .
.
A second conclusion is that, by adopting a vaccination strategy that minimizes R0 at the DFE with vaccinated individuals, we are giving higher protection to those age groups that are more vulnerable to contract the infection in the absence of vaccination due to their social contact pattern. This vaccination strategy is in sharp contrast to the one that yields the maximum mean coverage of the population, which only depends on the rate of immunity loss and the probabilities of successful protection against infection. Precisely, age groups with the highest/lowest per capita vaccination rates at the minimum R0 (see Table 2) correspond to those with the smallest/highest fractions of susceptible individuals at the endemic equilibrium without vaccination (cf. Fig. 2 for the data sets from Belgium, Peru, and Zimbabwe). The data set from Zimbabwe is particularly interesting since it is the only data set where the highest per capita vaccination rate corresponds to the 60+ years age group, even though the fraction of population that it represents (4.4%) is the smallest one in all data sets. However, the per capita number of contacts of this age group is much higher than the ones of the same age group in the rest of the data sets we have considered (see contact matrices in Appendix).
The results presented in the paper provide a first insight into the role of contact patterns in the spread of an infectious disease like COVID-19 and in the definition of an optimal vaccination strategy. The values of the disease parameters have been chosen to approximately mimic the COVID-19 infectious period (one week) and the current estimates of the possible duration of the immunity (about one year). For our study, we used a simple SIRV(accinated) epidemic model that neglects relevant aspects of the COVID-19 dynamics, such as, for instance, the existence of a latent period and different levels of disease severity. Nevertheless, our analysis mainly focuses on the basic reproduction number for populations where only susceptible and vaccinated individuals are present. Therefore, the inclusion of more non-infectious compartments in the model will not change the paper’s main conclusions.
Data Availability
All data produced in the present study are available upon reasonable request to the authors
Author contributions statement
Both authors conceived the research, analysed the results, and wrote the manuscript. J.S. developed the formal analysis of the model and its numerical implementation.
Competing interest
The authors declare no competing interests.
Acknowledgments
The work of CS has been supported by the National Science Foundation under Grant Award IIS-2027336. JS has been partially supported by Grant No. PID2019-104437GB-I00 of the Agencia Estatal de Investigación, Ministerio de Ciencia e Innovación of the Spanish government.
Appendix
Tables
In Table 4, we report the contact data matrices used to derive our results15. Contact data have been downloaded with the default settings, such as all contacts for day type, contact duration, contact intensity and all genders. Reciprocity, weigh by age, weigh by week/weekend, include supplemental professional contacts, and all locations have been checked.
Daily contact matrices used in the numerical integration.
In particular, reciprocity means that contacts are reciprocal and, hence, the total number of contacts per unit of time of individuals of age group i with individuals of age group j has to be equal to total the number of contacts per unit of time of individuals of age group j with individuals of age group i. This is equivalent to impose that cij fi = cji fj where C = (ckl) is the contact matrix and fk is the fraction of the population in the age group k15.
For each country, the population fraction fk of each age group used in our analysis is shown in Table 5.
Population fraction for each age group in the considered countries.
Additional contour plots
To complement the contour plots presented in the main text, Fig. 5 shows a choice of values of the parameters that increases the heterogeneity among the three age groups: lower waning rates of immunity for the age groups 1 and 3, and slightly different probabilities of successful protection of the vaccine for each age group. Such heterogeneity implies that the vaccination strategy that maximizes the vaccination coverage under the constraint  (green points) is now clearly distinguishable from the uniformly random vaccination strategy (red points).

Contour levels of  at the DFE of system (1) with p1 = 1, p2 = 0.95, and p3 = 0.9. Black level curve corresponds to
  . Blue point: Minimum of
  . Red point:
  under uniformly random vaccination:
  . Green point:
  at the disease-free equilibrium with the maximum vaccination coverage. Parameters: γ1 = 1, γ2 = 1, γ3 = 0.9,
  . For each country, β is scaled such that R0 = 2.5 in the absence of vaccinated individuals.
References


