
ABSTRACT
Background While CDC guidance for K-12 schools recommends indoor masking regardless of vaccination status, final decisions about masking in schools will be made at the local and state level. The impact of the removal of mask restrictions, however, on COVID-19 outcomes for elementary students, educators/staff, and their households is not well known.
Methods We used a previously published agent-based dynamic transmission model of SARS-CoV-2 in K-12 schools to simulate an elementary school with 638 students across 6 scenarios: combinations of three viral infectiousness levels (reflecting wild-type virus, alpha variant, and delta variant) and two student vaccination levels (0% and 50% coverage to reflect potential authorization in this age group). For each scenario, we varied observed community COVID-19 incidence (0 to 50 cases/100,000 people/day) and mitigation effectiveness (0-100% reduction to in-school secondary attack rate), and evaluated two outcomes over a 30 day period: (1) the probability of at least one in-school transmission, and (2) the increase in total cases among students, educators/staff, and their household members between in-person and remote instruction.
Results Over 30 days in the simulated elementary school, the probability of at least one in-school SARS-CoV-2 transmission and the number of projected infections in the immediate school community varied widely. In one scenario with the delta variant and no student vaccination, assuming that baseline mitigation measures of simple ventilation and handwashing reduce the secondary attack rate by 40%, if decision-makers seek to keep the monthly probability of an in-school transmission below 50%, additional mitigation (e.g., masking) would need to be added at a community incidence of approximately 4/100,000/day. Once students are vaccinated, thresholds shift substantially higher.
Limitations The interpretation of model results should be limited by the uncertainty in many of the parameters, including the effectiveness of individual mitigation interventions and vaccine efficacy against the delta variant, and the limited scope of the model beyond the school community. Additionally, the assumed case detection rate (33% of cases detected) may be too high in areas with decreased testing capacity.
Conclusion Despite the assumption of high adult vaccination, the risks of both in-school SARS-CoV-2 transmission and resulting infections among students, educators/staff, and their household members remain high when the delta variant predominates and students are unvaccinated. Mitigation measures or vaccinations for students when available can substantially reduce these risks. These findings underscore the potential role for responsive plans, where mitigation is deployed based on local COVID-19 incidence and vaccine uptake.
INTRODUCTION
CDC guidance for K-12 schools recommends in-person education for all students, with COVID-19 mitigation measures including distancing, ventilation, and most recently, indoor masking regardless of vaccination status.1 Children under 12 are not currently eligible for COVID-19 vaccines. Because CDC issues guidance rather than mandates, decisions will be made at the local and state level about masking in K-12 schools. In communities with high vaccination rates and low COVID-19 incidence, and in communities where masking is less widely accepted, schools are considering removing mask requirements, including for children <12. The impact of the removal of mask restrictions on COVID-19 outcomes for elementary students, educators/staff, and their households is not well known.
METHODS
We used an agent-based dynamic transmission model of SARS-CoV-2 in K-12 schools. Model structure and data inputs are described in previous publications; Table S1 describes parameterization specific to this analysis.2 We simulated an elementary school (30 separate classes, 638 students, 60 educators/staff) across 6 different scenarios: combinations of three viral infectiousness levels (reflecting wild-type virus, alpha variant, and delta variant) and two student vaccination levels (0% and 50% coverage to reflect potential authorization in this age group). We assumed that 70% of adults (educators/staff and adult household members of both students and educators/staff) were vaccinated.
We evaluated two primary outcomes of interest over a 30-day period: 1) probability of any in-school SARS-CoV-2 transmission, and 2) increase in the number of total infections among students, educators/staff, and their household members (“immediate school community”) between in-school and remote instruction. For each scenario, we varied observed community COVID-19 incidence (0 to 50 cases/100,000 people/day, 33% of cases detected) and mitigation effectiveness (0-100% reduction to in-school SAR). The full multilayer mitigation measures recommended in 2020-21 reduced wild-type SAR by 90-100%.1,3 Without clinical data for individual mitigation measure effectiveness, we show examples based on particle and aerosol studies and expert opinion as an approximate estimate; these ranges are highly uncertain (Supplemental Table). (Additional outcomes, including hospitalizations in the immediate school community, and scenarios varying vaccine uptake among adults, are available online at https://github.com/abilinski/BackToSchool2/tree/master/5-Drafts/Paper3.)
RESULTS
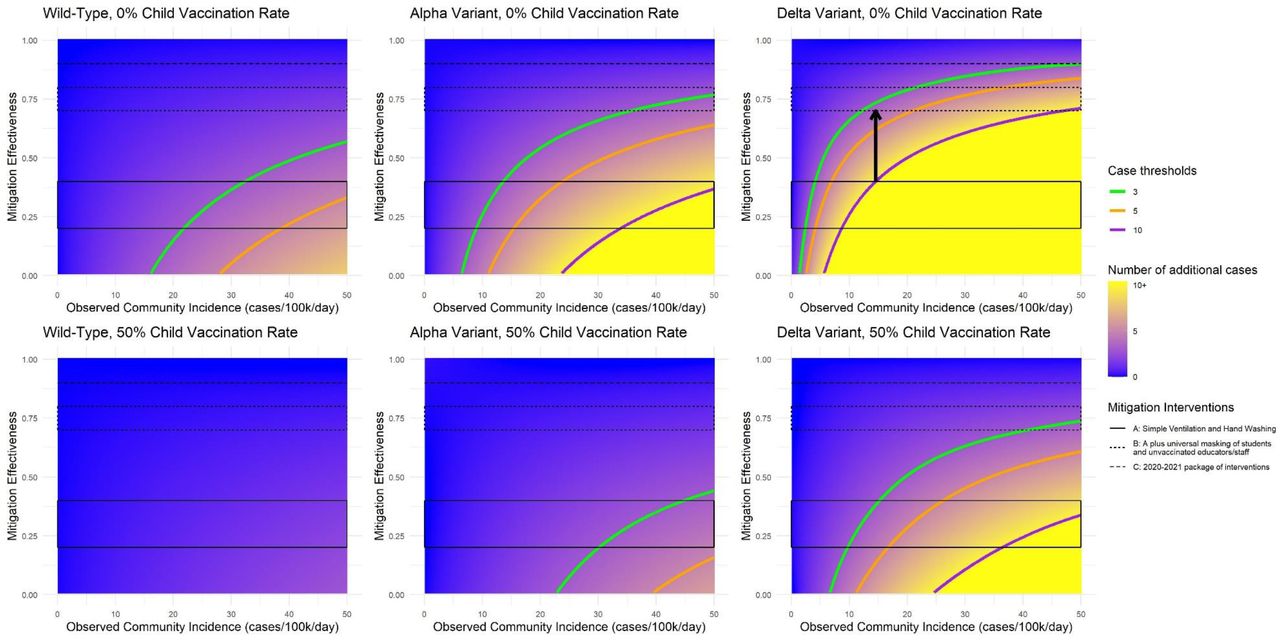
Over 30 days in the simulated elementary school, the probability of at least one in-school SARS-CoV-2 transmission and the total number of projected infections in the immediate school community varied widely (Figures 1 and 2). Assuming that simple ventilation and handwashing are 40% effective, with the delta variant and no student vaccination, if decision-makers seek to keep the monthly probability of an in-school transmission below 50%, additional mitigation (e.g., masking) would need to be added at a community incidence of approximately 4/100,000/day (Figure 1, blue shaded areas). Using a more lenient threshold, to maintain total additional infections in the immediate school community below an average of 10 per month, masks would be needed at a community incidence of approximately 16/100,000/day (Figure 2, blue shaded areas); the community incidence cutoff is lower at more conservative thresholds (e.g., 8/100,000/day for an average of 5 cases per month). Once students are vaccinated, thresholds shift substantially higher.
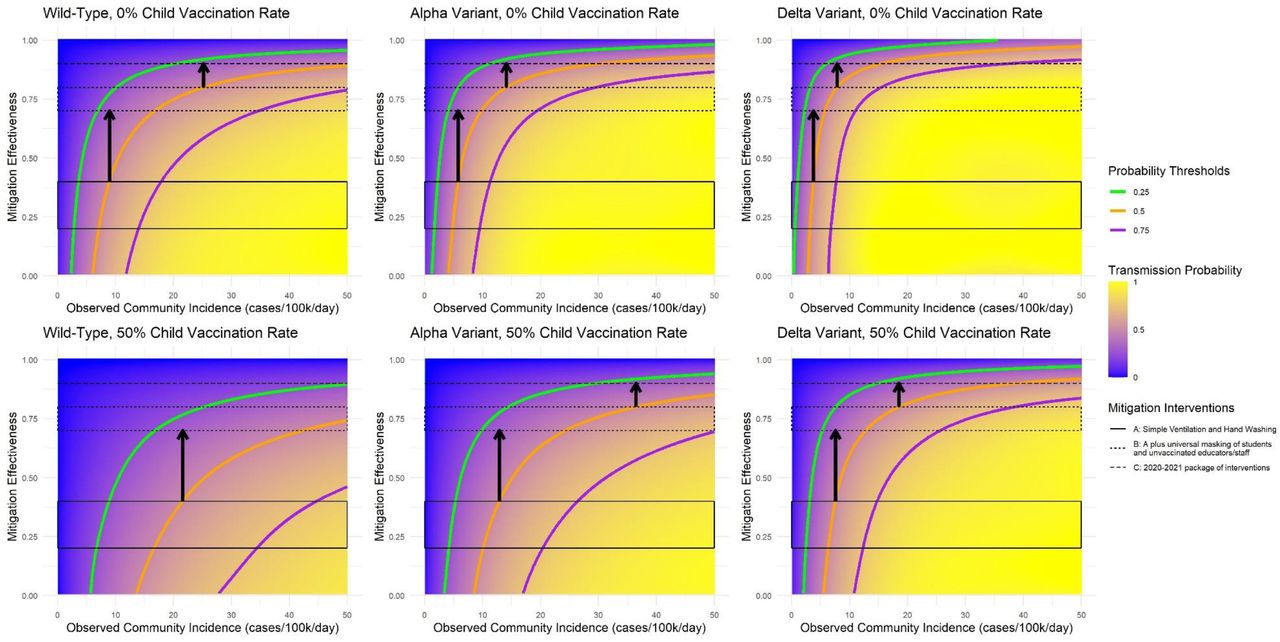
The blue-to-yellow color scale depicts the smoothed model-predicted probability of at least one in-school SARS-CoV-2 transmission over a 30-day period. Panels reflect increasingly transmissible variants from left to right and increasing student vaccination coverage from top to bottom. All panels reflect 70% vaccine uptake among adults (educators/staff and adult members of student and educator/staff households). The horizontal axis shows observed community COVID-19 incidence in cases/100,000 people per day. The vertical axis shows mitigation effectiveness, applied as a relative risk reduction to the fully unmitigated attack rate for each variant. Bands of mitigation effectiveness reflect approximate assumptions for three types of interventions: A includes simple ventilation and handwashing only; B adds universal masking of students and educators/staff to A; C reflects the full package of interventions widely used in the 2020-21 school year (adding distancing, daily surface cleaning, cohorting, and restrictions on shared items). The contour lines represent thresholds for different probability levels; probabilities are lower than the threshold above the contour line and higher below it. The arrows indicate the community COVID-19 incidence rate at which a school might opt to move to the next more intensive mitigation strategy (i.e., 40% to 70% and 80% to 90% effectiveness), if the goal is to maintain the probability of the one in-school transmission per month below 50%.

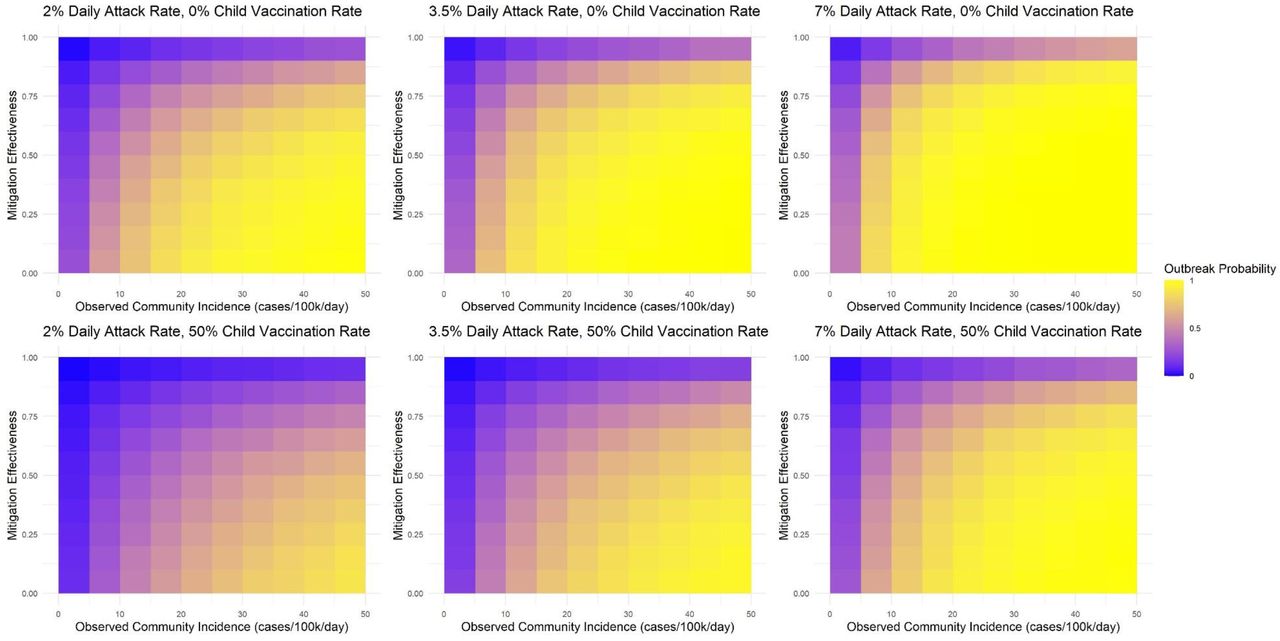
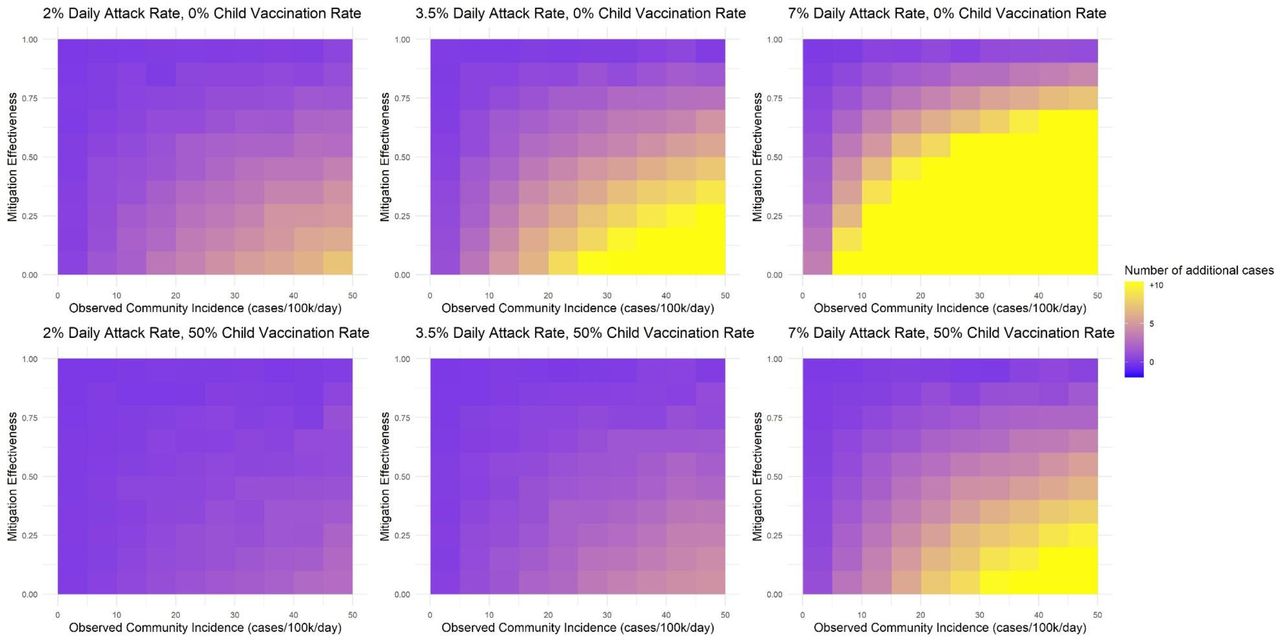
The blue-to-yellow color scale depicts the smoothed average additional number of model-predicted infections over 30 days among members of the immediate school community (defined as students, educators/staff, and their household members) with in-person learning compared to a counterfactual scenario of remote-only learning. These are shown because decision-makers may tolerate some risk of in-school transmissions (Figure 1) but may wish to avoid a large increase in total infections among members of the immediate school community. Panels reflect increasingly transmissible variants from left to right and increasing student vaccination coverage from top to bottom. All panels reflect 70% vaccine uptake among adults (educators/staff and adult members of student and educator/staff households). The horizontal axis shows observed community COVID-19 incidence in cases/100,000 people per day. The vertical axis shows mitigation effectiveness, applied as a relative risk reduction to the fully unmitigated attack rate for each variant. Bands of mitigation effectiveness reflect approximate assumptions for three types of interventions: A includes simple ventilation and handwashing only; B adds universal masking of students and educators/staff to A; C reflects the full package of interventions widely used in the 2020-21 school year (adding distancing, daily surface cleaning, cohorting, and restrictions on shared items). The contour lines represent thresholds for different numbers of average predicted cases; numbers are lower than the threshold above the contour line and higher below it. The arrows indicate the community COVID-19 incidence rate at which a school might opt to move to the next more intensive mitigation strategy (i.e., 40% to 70% and 80% to 90% effectiveness), if the goal is to maintain the total number of additional infections in the immediate school community below 10 in a 30-day period.
DISCUSSION
Despite high adult vaccination, the risks of both in-school SARS-CoV-2 transmission and resulting infections among students, educators/staff, and their household members remain high when the delta variant predominates and students are unvaccinated. Mitigation measures or vaccinations for students when available can substantially reduce these risks. Risks related to SARS-CoV-2 infection are only one of many factors guiding K-12 school planning, and interpretation of model results should be limited by the uncertainty in many of the parameters, including the effectiveness of individual mitigation interventions and vaccine efficacy against the delta variant, and the limited scope of the model beyond the school community.4 In addition, the assumed case detection rate of 33% may be too high in areas with decreased testing capacity. Recommended thresholds can be scaled accordingly; for example, in an area with 16.5% detection, a threshold of 4 cases/100,000 would become 2 cases/100,000. These findings underscore the potential role for responsive plans, where mitigation is deployed based on local COVID-19 incidence and vaccine uptake.
Data Availability
Model code and replication files are publicly available on GitHub.
FUNDING
The authors were supported by the Centers for Disease Control and Prevention though the Council of State and Territorial Epidemiologists (NU38OT000297-02: AB, JAS), the National Institute of Allergy and Infectious Diseases (R37AI058736-16S1: AC; K01AI141576: MCF; and K08127908: EAK), the National Institute on Drug Abuse (3R37DA01561217S1: JAS), and Facebook (unrestricted gift; JG, AB, JAS). The papers’ contents are solely the responsibility of the authors and do not represent the official views of the funders.
DISCLOSURES
The authors have no disclosures.
SUPPLEMENT
Methods
To generate Figures 1 and 2, we generated 550,000 paired samples of observed community incidence and mitigation effectiveness using Latin hypercube sampling to draw from a joint independent uniform distribution with limits of 0 to 60 case notifications/100k/day and 0 to 100% mitigation. For each scenario in each paired sample, we ran the model presented in Bilinski et al.1 using the model code available at https://github.com/abilinski/BackToSchool2/tree/master/3-Scripts/Paper3, varying the following parameters: (1) baseline daily adult-to-adult secondary attack rates of 2% (reflecting the wild-type virus), 3.5% (alpha variant), and 7% (delta variant); (2) child vaccination coverage of 0% and 50%; adult vaccination coverage of 50% and 70%; and (4) remote and in-school instruction. We assumed reduced transmission and susceptibility for children and for asymptomatic adults (Table S1). To calculate in-school transmissions presented in Figure 1, we analyzed only model runs for in-person instruction and calculated the number of transmissions occurring in the school building (classrooms, staff rooms, and random interactions). To calculate average additional infections among the immediate school community during in-school instruction relative to remote instruction, for each paired sample, we subtracted the total number of infections during remote instruction from the number of total infections during in-school instruction.
To generate smoothed heatmaps and associated contour line estimates, we fit regressions to the raw model output for each outcome and associated scenario (e.g., more than one in-school transmission in the wild-type, 0% child vaccine, 70% adult vaccine scenario) as a function of observed community incidence and mitigation effectiveness. We tested five specifications: linear, quadratic, cubic, and quartic polynomials, as well as linear regression with a log transformation on each predictor:
Linear specification: Outcome = β0 + β1Incidence + β2Mitigation + β3Incidence. *Mitigation
Quadratic specification: Outcome =

Cubic specification: Outcome =
Quartic specification: Outcome =
Log specification: Outcome = β0 + β1Incidence + β2Mitigation + β3Incidence. * InMitigation


For each scenario, we selected the regression which minimized the root mean-squared prediction error in a hold-out test set containing 55,000 (10%) of the samples.
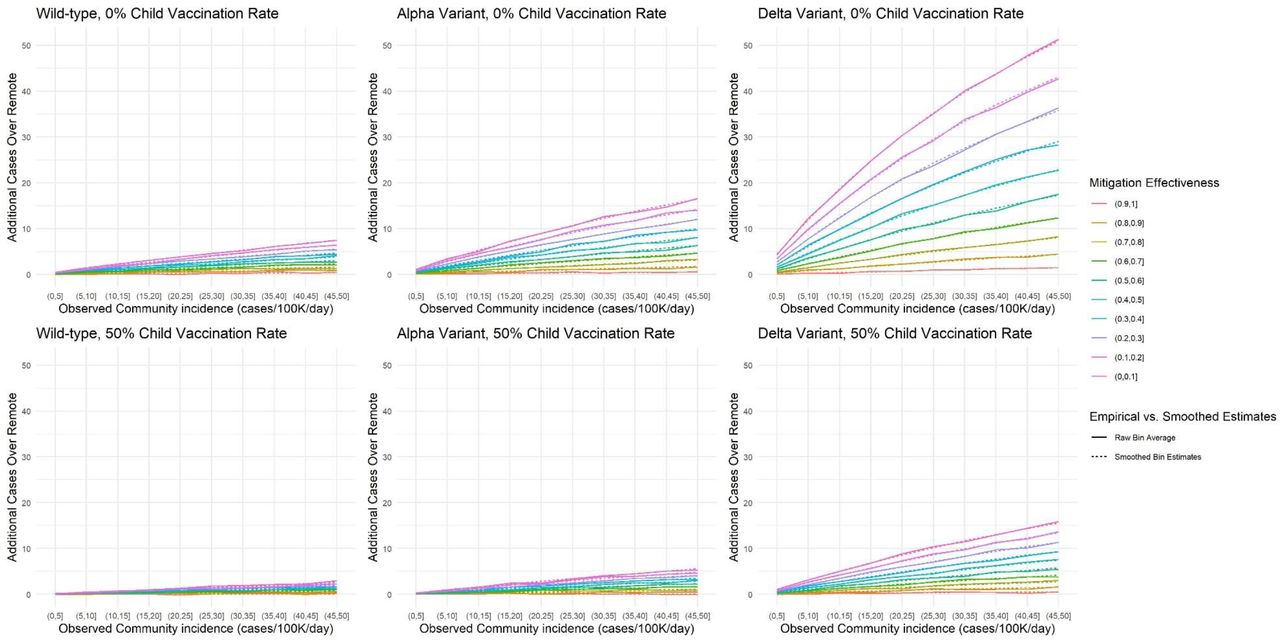
To assess how well the smoothing functions fit the expected value of the model output, we calculated the R2 between binned averages of the model-generated outcomes in an out-of-sample test set and the average outcome predicted by the selected smoothing function across the range of community incidence and mitigation values. We evaluated the fit for two different bin sizes: “large” bins, with a bin width of 5 for community incidence and 0.1 for mitigation effectiveness, and “small” bins with a bin width of 1 for community incidence and 0.1 for mitigation effectiveness (Table S2). While noise persists in the additional infections outcome for scenarios with lower infection rates (wild type and alpha) due to a larger relative impact of model stochasticity (which is more pronounced in the small bins), these do not impact the substantive conclusions presented in the letter. For additional context on the smoothing process, we present empirical and smoothed bin estimates (for both bin sizes) for the additional infections outcome in Figures S5-S8; raw binned heatmaps are presented in Figures S9-S16. Figures S5-S8 show that despite stochasticity, the smoothing functions used for the heatmaps (Figures 1-2, S1-S2) do not deviate from the raw model output in a way that impacts letter conclusions.
Estimates of R2 were made on an out-of-sample test set.
Supplemental Figures

Model-predicted probability of at least one in-school SARS-CoV-2 transmission over 30 days in a simulated elementary school setting, with 50% ADULT VACCINATION COVERAGE. This figure replicates Figure 1, with 50% adult vaccination coverage in contrast to 70%. Note that the observed community incidence cutoff for the 50% transmission threshold in the delta variant scenario with a 0% child vaccination rate is about 4/100,000/day. Also note that the model does not directly account for the effect of adult vaccination levels on observed community incidence – a community with lower vaccination rates is likely to be at a higher community incidence (i.e., to the right on the x-axis) and vice versa.

Model-predicted average number of additional cases over 30 days in the immediate school community (students, educators/staff, and their household members) during in-person instruction compared to remote instruction in the simulated elementary school setting, with 50% ADULT VACCINATION COVERAGE. This figure replicates Figure 2, with 50% adult vaccination coverage in contrast to 70%. Note that the observed community incidence cutoffs for the 5 and 10 additional cases thresholds in the delta variant scenario with a 0% child vaccination rate are about 15/100,000/day and 7/100,000/day, respectively. Also note that the model does not directly account for the effect of adult vaccination levels on observed community incidence – a community with lower vaccination rates is likely to be at a higher community incidence (i.e., to the right on the x-axis) and vice versa.

Average increase in hospitalizations among parents, teachers, staff, and adult family members per 100k, relative to remote instruction, with 70% adult vaccination.

Average increase in hospitalizations among parents, teachers, staff, and adult family members per 100k, relative to remote instruction, with 50% adult vaccination

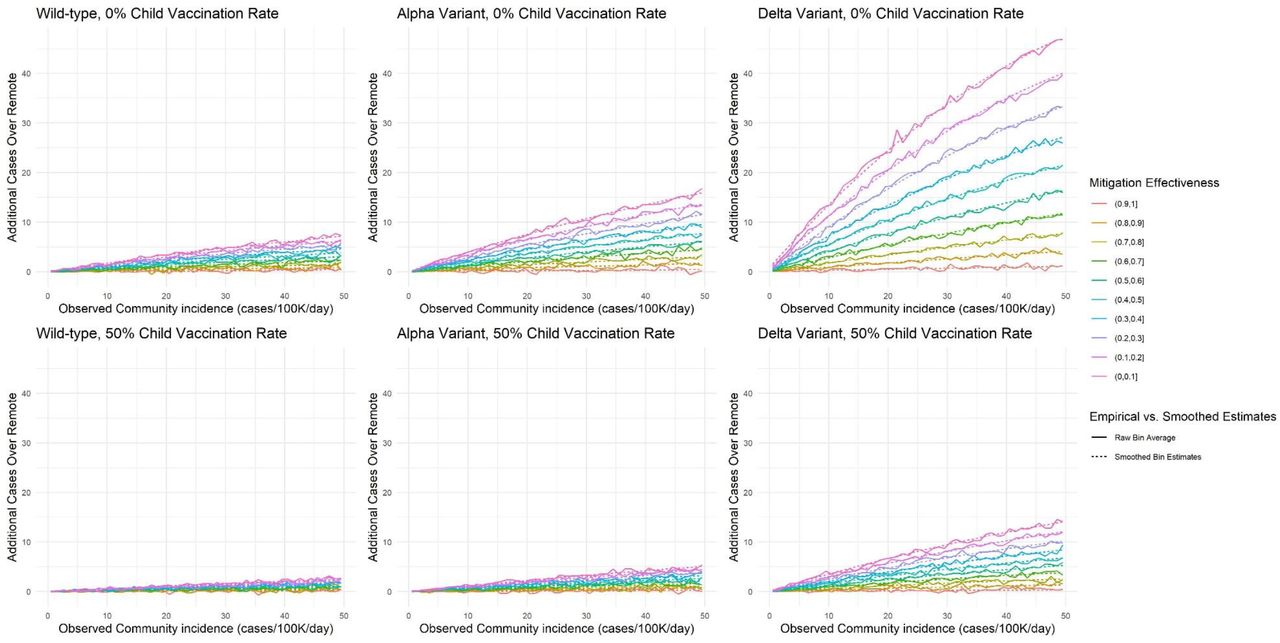
Model-predicted average number of additional cases over 30 days in the immediate school community (students, educators/staff, and their household members) during in-person instruction compared to remote instruction in the simulated elementary school setting, with 70% ADULT VACCINATION COVERAGE. This figure includes both the raw binned averages of the model output for large bins and the smoothed estimates for each bin (calculated at the midpoint).

Model-predicted average number of additional cases over 30 days in the immediate school community (students, educators/staff, and their household members) during in-person instruction compared to remote instruction in the simulated elementary school setting, with 70% ADULT VACCINATION COVERAGE. This figure includes both the raw binned averages of the model output small bins and the smoothed estimates for each bin (calculated at the midpoint).
Model-predicted average number of additional cases over 30 days in the immediate school community (students, educators/staff, and their household members) during in-person instruction compared to remote instruction in the simulated elementary school setting, with 50% ADULT VACCINATION COVERAGE. This figure includes both the raw binned averages of the model output for large bins and the smoothed estimates for each bin (calculated at the midpoint).

Model-predicted average number of additional cases over 30 days in the immediate school community (students, educators/staff, and their household members) during in-person instruction compared to remote instruction in the simulated elementary school setting, with 50% ADULT VACCINATION COVERAGE. This figure includes both the raw binned averages of the model output for small bins and the smoothed estimates for each bin (calculated at the midpoint).
Model-predicted probability of at least one in-school SARS-CoV-2 transmission over 30 days in a simulated elementary school setting, with 70% ADULT VACCINATION COVERAGE. This figure is a raw binned heatmap for large bins corresponding to Figure 1.

Model-predicted probability of at least one in-school SARS-CoV-2 transmission over 30 days in a simulated elementary school setting, with 70% ADULT VACCINATION COVERAGE. This figure is a raw binned heatmap for small bins corresponding to Figure 1.

Model-predicted probability of at least one in-school SARS-CoV-2 transmission over 30 days in a simulated elementary school setting, with 50% ADULT VACCINATION COVERAGE. This figure is a raw binned heatmap for large bins corresponding to Figure S1.

Model-predicted probability of at least one in-school SARS-CoV-2 transmission over 30 days in a simulated elementary school setting, with 50% ADULT VACCINATION COVERAGE. This figure is a raw binned heatmap for small bins corresponding to Figure S1.

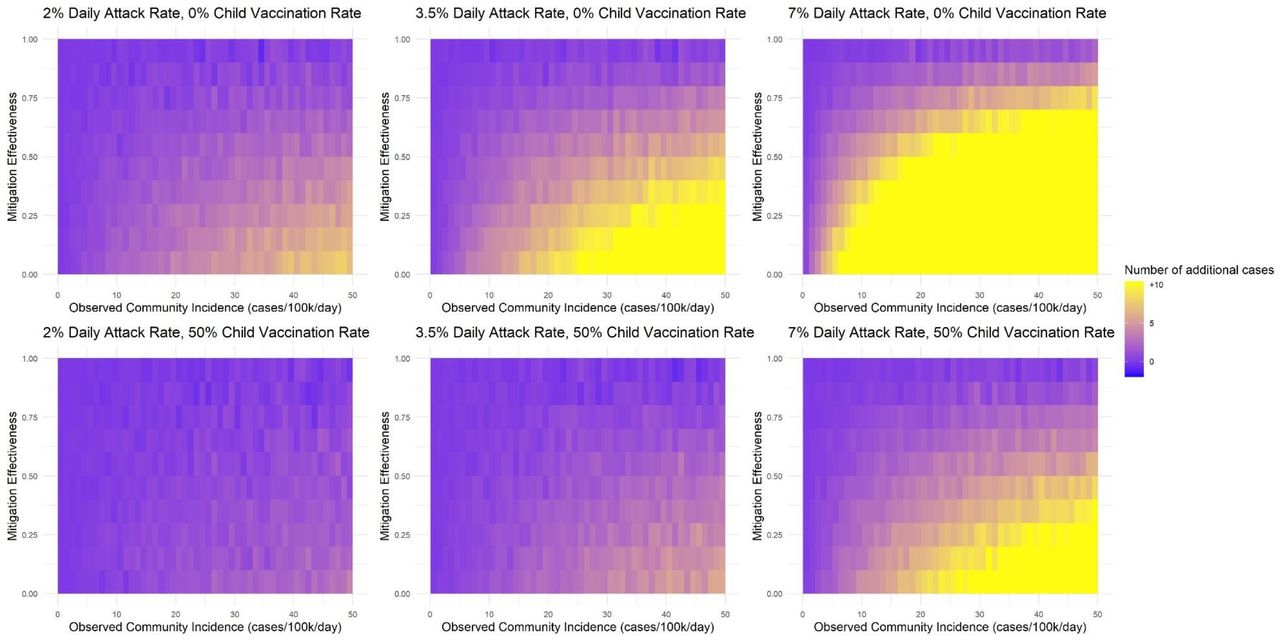
Model-predicted average number of additional cases over 30 days in the immediate school community (students, educators/staff, and their household members) during in-person instruction compared to remote instruction in the simulated elementary school setting, with 70% ADULT VACCINATION COVERAGE. This figure is a raw binned heatmap for large bins corresponding to Figure 2.

Model-predicted average number of additional cases over 30 days in the immediate school community (students, educators/staff, and their household members) during in-person instruction compared to remote instruction in the simulated elementary school setting, with 70% ADULT VACCINATION COVERAGE. This figure is a raw binned heatmap for the small bins corresponding to Figure 2.

Model-predicted average number of additional cases over 30 days in the immediate school community (students, educators/staff, and their household members) during in-person instruction compared to remote instruction in the simulated elementary school setting, with 50% ADULT VACCINATION COVERAGE. This figure is a raw binned heatmap for the large bins corresponding to Figure S2.
Model-predicted average number of additional cases over 30 days in the immediate school community (students, educators/staff, and their household members) during in-person instruction compared to remote instruction in the simulated elementary school setting, with 50% ADULT VACCINATION COVERAGE. This figure is a raw binned heatmap for small bins corresponding to Figure S2.
ACKNOWLEDGEMENTS
We are grateful to Dr. Sandra B. Nelson and Dr. Shira Doron for expert opinion on mitigation measure effectiveness.


