
Abstract
Early waves of the SARS-CoV-2 pandemic were driven by importation events and subsequent policy responses. However, epidemic dynamics in 2021 are largely driven by the spread of more transmissible and/or immune-evading variants, which in turn are countered by vaccination programs. Here we describe updates to the methodology of Covasim (COVID-19 Agent-based Simulator) to account for immune trajectories over time, correlates of protection, co-circulation of different variants and the roll-out of multiple vaccines. We have extended recent work on neutralizing antibodies (NAbs) as a correlate of protection to account for protection against infection, symptomatic COVID-19, and severe disease using a joint estimation approach. We find that NAbs are strongly correlated with infection blocking and that natural infection provides stronger protection than vaccination for the same level of NAbs, though vaccines typically produce higher NAbs. We find only relatively weak correlations between NAbs and the probability of developing symptoms given a breakthrough infection, or the probability of severe disease given symptoms. A more refined understanding of breakthrough infections in individuals with natural and vaccine-derived immunity will have implications for timing of booster vaccines, the impact of emerging variants of concern on critical vaccination thresholds, and the need for ongoing non-pharmaceutical interventions.
Introduction
Towards the end of 2020, several trends developed that challenged the structure of many existing models of SARS-CoV-2 and COVID-19. First, variants of concern (VOC) emerged with phenotypic differences from the ancestral wild-type virus. These differences conferred increased transmissibility, increased severity, and/or the ability to partially evade existing immunity (Cele et al., 2021; Weisblum et al., 2020). Additionally, multiple vaccines with different properties and performance characteristics have been issued emergency use authorizations and are being rolled out around the world.
By the time that vaccines and variants emerged, there were already a plethora of COVID-19 models that had been successfully applied to help understand paths of transmission and the way interventions were likely to affect these (Hinch et al., 2020; Ferguson et al., 2020; Davies et al., 2020; COVID et al., 2020; Balcan et al., 2010; Chinazzi et al., 2020; Flaxman et al., 2020; Kerr et al., 2020). These models helped to guide the local and global response to COVID-19. However, the urgency with which they were developed meant that although they were appropriate for the analysis of the initial stages of the epidemic, they were not set up to be able to answer the new questions that started to emerge along with variants of concern and vaccines. Subsequently, a new set of models began to emerge that were better suited for the analysis of the impacts of co-circulating variants, either from a theoretical standpoint (Fudolig and Howard, 2020; Khyar and Allali, 2020; Arruda et al., 2021) or located within particular contexts. In particular, Faria et al. (2021) extended the statistical modeling approach used in Flaxman et al. (2020) to include two co-circulating variants in Manaus, while Davies et al. (2021) extended the stochastic compartmental model from their earlier work (Davies et al., 2020) to include two co-circulating variants in the UK. Similarly, several studies have emerged that modified existing COVID-19 models to answer critical questions around vaccine prioritization (Bubar et al., 2021; Matrajt et al., 2020; Buckner et al., 2021), but without focusing on how vaccine prioritization within a particular setting may depend on factors such as pre-existing immunity levels, the presence of new variants, or the specific vaccines available for use.
As with other pathogens that consist of multiple co-circulating variants (such as malaria, dengue, and influenza), there are numerous modeling approaches available, ranging in complexity from full history-based models that track each possible combination of immune-boosting events that an individual could have, to status-based models that only track current immune state (Kucharski et al., 2016). In general, the choice of which approach to use involves trade-offs between biological realism and model parsimony. When modeling a novel pathogen like SARS-CoV-2, there is limited data on the immune responses of individuals with different infection histories, so these trade-offs are further complicated by uncertainties about which immunological aspects are necessary to capture. As a result, there are benefits to taking a versatile modeling approach that simultaneously avoids over-reliance on data that may not yet be available, while also providing flexible options for making use of such data when it does become available.
In this paper, we outline the approach that we have taken for extending Covasim (COVID-19 Agent-based Simulator; (Kerr et al., 2020)) to account for the emergence of variants of concern, the decay of immunity over time that may lead to a loss of sterilizing immune protection, and the use of multiple vaccines. Following (Khoury et al., 2021), we model protective efficacy as a function of neutralizing anitbodies (NAbs), informed by data from vaccine efficacy and re-infection studies. We have extended the (Khoury et al., 2021) methodology by estimating efficacy for infection, symptomatic COVID-19 and severe disease jointly and calculating conditional efficacy for symptom blocking and severity-blocking given infection. This methodology allows us to directly model NAbs as a correlate of protection. Over the past year as variants and vaccines began to emerge, incorporating these factors into the tool as standard features became a high priority.
Covasim was developed as a tool for both researchers and health decision-makers to simulate the effects of different policy options for responding to COVID-19, and follows the overarching design principle that common tasks should be simple while still allowing for complex and highly detailed custom analyses (Kerr et al., 2020). To illustrate the features of the modeling approach we have taken, we present three short case studies where we use Covasim to investigate questions around the relative fitness advantages of different variants in different contexts, to construct phylogenetic trees, and to evaluate critical vaccination thresholds in the presence of immune-escaping variants.
Methods
Model overview
Covasim is an open-source agent-based model developed by the Institute for Disease Modeling with source code and documentation available at https://covasim.org. Covasim simulates individuals interacting via population networks over time, and tracks disease transmission and progression as well as the effects of interventions including symptomatic and asymptomatic testing, isolation, contact tracing, and quarantine, as well as other non-pharmaceutical interventions (NPIs) such as physical distancing, hygiene measures, and protective equipment such as masks. A comprehensive overview of the methodology underlying the model is provided in Kerr et al. (2020); in this paper we confine ourselves to a brief overview of the core concepts, focusing on the changes included in the release of version 3.0 of the model, which relate to intra-host immune memory, co-circulating variants, and vaccines.
The model’s mutually exclusive disease states are pictured in Fig. 1. Individuals begin in the naive compartment, meaning that they have no history of SARS-CoV-2 infection. Individuals who contract SARS-CoV-2 for the first time then progress through the stages of infection: exposed, infectious (asymptomatic, presymptomatic, mild, severe, or critical), before either recovering or dying, with the probabilities of disease progression dependent on age. Individuals are allowed to recover from any of the disease stages, but only critically ill individuals have a non-zero probability of dying. The model includes individual heterogeneity in infectiousness and in the time spent in each disease state.

Model schematic illustrating the movement of individuals through mutually exclusive disease states in Covasim 3.0.
Recovered individuals are assumed to be susceptible to reinfection, but their relative susceptibility is modified by a factor that reflects the degree of protective immunity afforded by their prior infection; details on how this factor is calculated are provided in the following section. The model also provides an option to switch off this behavior, so that recovered individuals retain lifelong sterilizing immunity. Choosing this option means that the model reduces to the structure described in Kerr et al. (2020) and produces results consistent with Covasim releases prior to 3.0.
As well as belonging to these disease states, agents in the model also have individual attributes that govern their movement through the model over time, such as age, infection history, vaccination history, and whether they have been tested, diagnosed, or contact-traced. As will be discussed below, vaccination also moderates the relative susceptibility to infection and subsequent symptomatic and severe disease, and individuals can be vaccinated in any state of the model. For example, an individual could be in the naive state, meaning they have no history of infection, but be vaccinated and have vaccine-derived neutralizing antibodies that protect against infection.
Agents within the model interact with each other within contact networks, which typically stratify contacts in household, workplace, school, and community layers, with the probability of transmission and the efficacy of isolation and quarantine all varying by layer.
Immunity
Immunologic memory, including neutralizing antibodies, CD4+ and CD8+ T cells and memory B cells, is the basis for protection against infection and disease (Dan et al., 2021). Neutralizing antibodies bind to viral proteins, blocking infection, while CD8+ T cells target virus cells, moderating disease severity. We are modeling the generation and subsequent decay of neutralizing antibody (NAb) within individuals following SARS-CoV-2 infection and vaccination (Edara et al., 2021; Wajn-berg et al., 2020). In the absence of standardized assays to measure NAbs, normalization against a convalescent serum standard has been suggested as a method for providing greater comparability between results from different assays (Kristiansen et al., 2021).
Individuals are assumed to have no protective neutralizing antibodies against SARS-CoV-2 initially (Gouma et al., 2021). Upon first infection, individuals draw an initial NAb level from a log-normal distribution (log2(NAb0) ∼ 𝒩 (0, 2)), following the distribution used in Khoury et al. (2021). Individuals’ initial NAb levels are adjusted based on the symptoms they experience throughout their infection, with asymptomatic infection assumed to reduce the average NAb level by 15% and severe infection assumed to increase it by 50%, again following Khoury et al. (2021). Similarly, vaccination is assumed to generate an initial NAb level drawn from a lognormal distribution (log2(NAb0) ∼ 𝒩 (μvx, 2)), where μvx depends on the vaccine administered (see Table 2).
Default variant parameters. Transmissibility and severity for each variant are quantified relative to wild-type variants. Relative immunity refers to the reduction in neutralization with each variant relative to wild-type variants; the reduction in protective efficacy against infection or disease is then calculated using the mechanisms described in the Immunity section and depicted in Figure 2. We also incorporate other estimates of cross-immunity effects where available, e.g. Cele et al. (2021) estimate that infection with B.1.351 is associated with a 2.3-fold reduction in neutralization with wild-type variants.
Variant-specific model vaccine parameters. These parameters are provided as defaults in the model to modify NAb trajectories. NAb levels are mapped to protection against infection as well as symptomatic and severe disease. NAb distributions from Khoury et al. (2021) and NAb reductions from Abdool Karim and de Oliveira (2021) or assumed where no data was available.
For individuals who have some prior immunity, both reinfection and vaccination are known to boost the level of NAbs, although the exact degree of boosting is not yet well understood. We provide a parameter that can be used to control the degree of boosting, and set it to a default value of 150% for reinfections. Vaccination is assumed to boost by Bvx, where Bvx is a vaccine-specific boosting factor (see Table 2).
NAbs grow linearly until they reach their peak after three weeks and then follow a two-part exponential decay, with a 100 day half-life in the first 250 days and an exponentially decaying decay rate until a 10-year half life is achieved (Khoury et al., 2021). See Fig. 2F for example immune trajectories that might come out of the model. We assume the same immune kinetics for all individuals and for all types of immunity (naturally-derived and vaccinal). Model users can vary the default parameters to explore different parameters or functional forms.
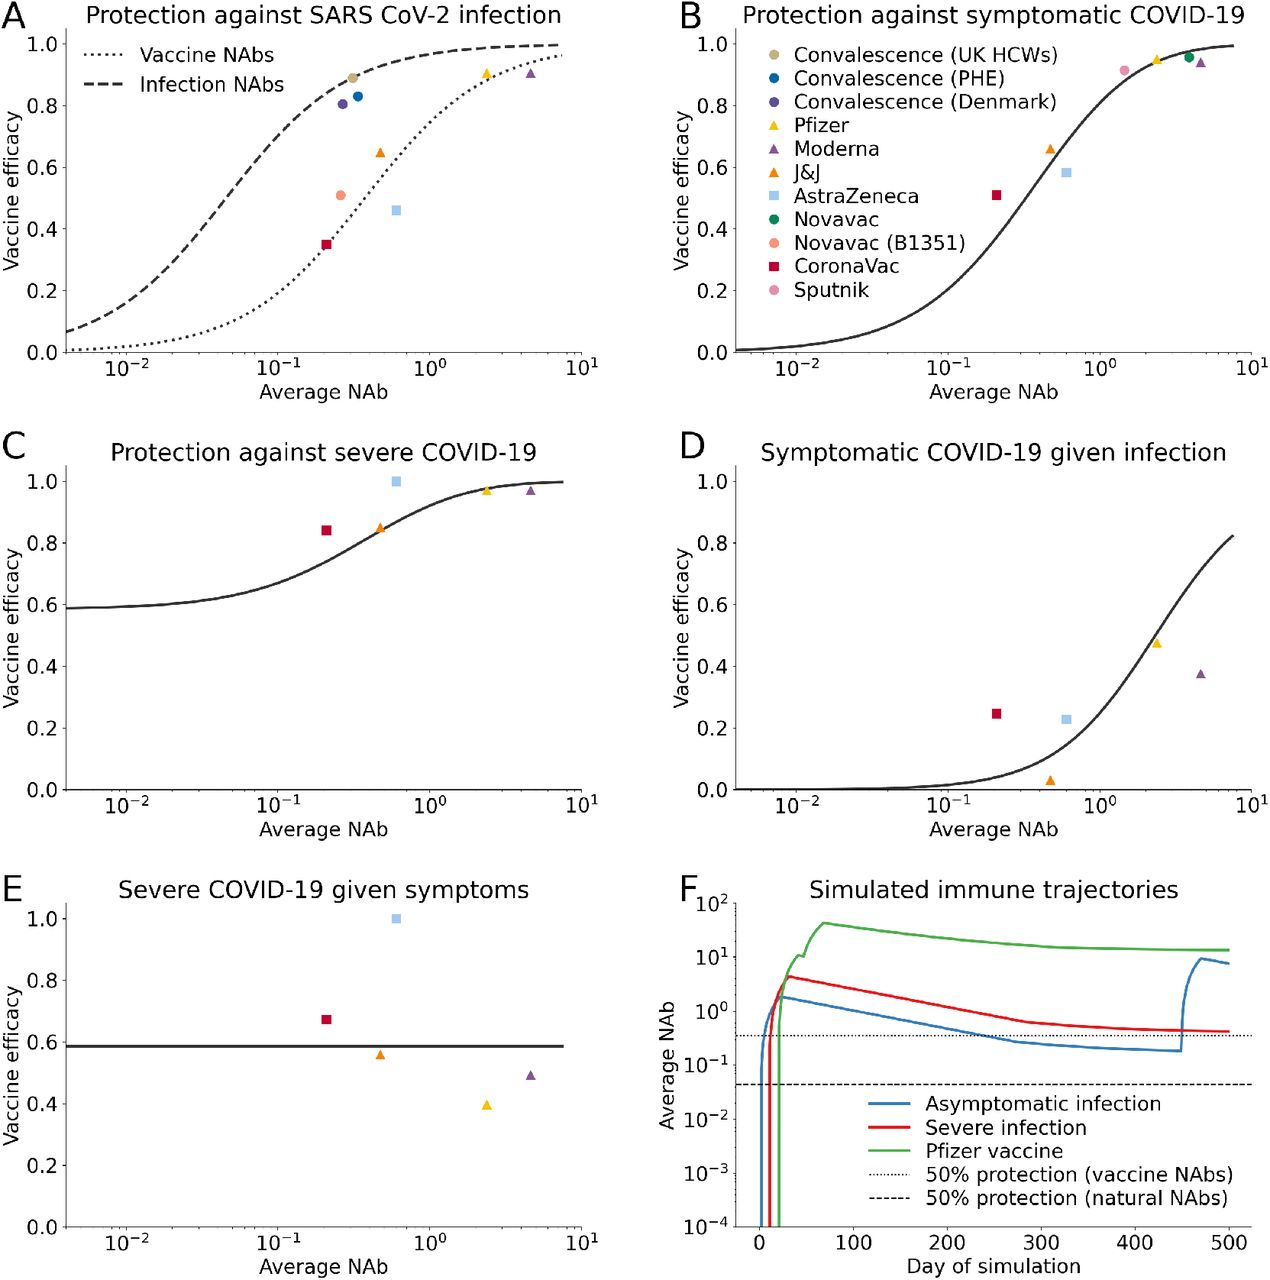
Immunity modeling in Covasim. We have jointly estimated the relationship between neutralizing antibodies and vaccine efficacy against SARS-CoV-2 infection, symptomatic and severe disease using data from vaccine trials and convalescent cohorts. NAbs are normalized relative to human convalescent sera. A description of our fitting methodology is available in the Appendix. (A) Fitted efficacy against infection as a function of natural- and vaccine-derived NAbs. (B) Fitted efficacy against symptomatic COVID-19 as a function of NAbs. (C) Fitted efficacy against severe COVID-19 as a function of NAbs. (D) Implied efficacy against disease conditional on a breakthrough infection as a function of NAbs. (E) Implied efficacy against severe disease conditional on a breakthrough symptomatic infection as a function of NAbs. (F) Possible immune trajectories that might come out of the model.
We keep track of the most recent NAb-conferring event for each individual, storing information about the variant with which they were infected or the vaccine they received. In order to map NAb level to protective efficacy, we use vaccine immunogenicity and efficacy trial data as well as data on reinfection in health care workers (see Table 4). We re-normalized the average NAb for each of the vaccine trial cohorts as well as the re-infection datasets to account for waning that may have occurred between collection of NAb assays in the immunogenicity studies and vaccine efficacy trial endpoints using the antibody kinetics model described above, yielding an average 50% reduction in average NAb level compared to those reported in Khoury et al. (2021).
We are modeling three types of immunity: protection against infection, protection againstsymptomatic disease, and protection from severe disease. Once we consider the impact of waning immunity, we find that it’s challenging to fit protection against infection with a single curve for both vacccine- and natural infection-derived immunity. Therefore, we chose to estimate these with separate intercepts and shared slopes. Separate fits can be supported by the role of N-specific antibodies which are missing from vaccines and may mechanistically explain why natural NAbs look more effective than vaccine against infection (Castillo-Olivares et al. (2021)). We jointly estimated the relationship between NAbs and protective efficacy against infection, symptoms, and severe disease using a least-squares optimization. We fit four linear regressions on a logit-log scale (logit(VEinf) ∼ log(NAb)) to generate a continuous function relating NAbs to reduction in SARS-CoV-2 infection risk (from natural infection and vaccine-derived), symptomatic disease, and severe disease (Fig. 2A-C), and then used this model to infer the relationship between NAbs and symptom reduction for individuals with a breakthrough infection and reduction in severe disease for individuals with a symptomatic breakthrough infection (Fig. 2D-E). Further details on our joint estimation can be found in the supplemental appendix. For infection-derived NAbs, this mapping is interpreted as a reduction in the risk of being reinfected by the same variant that an individual was last infected with, a reduction in the risk of symptomatic COVID-19 with the same variant of prior infection, and a reduction in the risk of developing symptoms by the same variant that an individual was last infected with; cross-immunity for different variants is described in the following section.
We find that conditional on a breakthrough infection, reduction in symptoms is weakly correlated with NAbs and conditional on a symptomatic breakthrough infection, reduction in severe disease is uncorrelated with NAbs, indicating that there may be other immune mechanisms, such as T-cell response, that provide protection against severe disease (Tarke et al., 2021).
Variants
Agents in the model are infected with and can transmit a unique variant with variant-specific properties. We do not allow for the possibility of co-infection, nor do we model the de-novo emergence of new variants. (We choose to refer to variants and not strains, as variant is the more general term in common use for SARS-CoV-2 clades defined by specific genetic variations; however, since the model focuses on phenotypic changes among variants, strain would also be an appropriate alternative.)
Susceptible agents who come into contact with an agent infected with variant v will acquire variant v with probability proportional to βv. The precise probability that transmission occurs depends on the relative susceptibility and transmissibility of both agents, which in turn depends on the current viral load and symptoms of the infected agent, the level and source of any pre-existing neutralizing antibodies within the susceptible agent and the protective efficacy of those antibodies to variant v, as well as the use of any non-pharmaceutical interventions by either agent.
Different variants can also be associated with different relative probabilities of disease progression. Since Covasim also includes age-linked disease progression and mortality probabilities (see Table 2 in Kerr et al. (2020)), each variant is assigned a relative scale factor which is then applied to these age-dependent probabilities.
The Covasim model comes pre-populated with parameter values capturing available evidence on the relative transmissibility and severity of several known variants (see Table 1). Likewise, the model captures available evidence on the cross-immunity that infection with wild-type variants confer against infection with other known variants (see Table 1 for parameter values and Fig. 2D for the neutralizing titer shift that may occur with an immune evading variant). Users can also add custom variants to the model (see Covasim Documentation for tutorials).
The Covasim model retains the level of NAbs for each individual as well as the most recent NAb-conferring event. We therefore rely upon the last source of immunity to determine risk of infection and are unable to capture the impact of multiple sources of immunity. We have adopted this Markovian property due to both the computational burden of storing the entire infection history for all individuals in the model and data limitations that would not enable us to parameterize the impact of all possible combinations of NAb events on risk of infection. At the time of writing, there was not yet sufficient data to justify tracking individuals’ full immune history within the model, so we take a more parsimonious modeling approach based on the most recent infection.
Vaccines
The immunity model can account for the effect of single or multi-dose vaccines with variant-specific protection against infection, symptoms, and severe disease in addition to reduced transmissibility of breakthrough infections. As described in the Immunity section above, for individuals with exist-ing immunity, vaccination confers a boost to their current NAb level by a vaccine-specific scaling factor Bvx, while individuals without pre-existing immunity are assigned a peak NAb level drawn from a log-normal NAb distribution. For each vaccine, NAbs increase linearly from the day of first dose until the vaccine’s peak efficacy, at which point they begin to decay. Second doses of the vaccine boost current NAbs by the same vaccine-specific scaling factor Bvx.
Variant-specific protection is implemented as an additional scaling factor reducing an agent’s NAb level that is input to the mapping shown in Figure 2F. The model provides vaccine parameters for the Pfizer, Moderna, AstraZeneca, Janssen, and Novavax vaccines (see Table 2) along with the capability to add custom vaccine profiles. In addition, the model will be updated to include new default vaccines as these are released.
The default first or single dose allocation scheme employed in Covasim is a constant per-day probability configured to a specified day or set of days during the simulation. Additional doses are then scheduled by the interval associated with the vaccine type. Covasim also employs methods to target vaccination via e.g. age prioritization or individual attributes. A single simulation can simultaneously simulate the effect of multiple vaccines.
The vaccine implementation described here is provided via Covasim’s interventions module. However, the model can support a variety of vaccine scenarios including daily dose quotas, NAb effect delays different than the dose intervals, and alternate protection mappings. This flexibility can help address region-specific policy and vaccination program design.
Results
Case study 1: how well do variants compete in different epidemiological contexts?
Over the first year of the pandemic, countries around the world mounted diverse responses to their national COVID-19 epidemics. Very broadly, we consider three archetypal epidemic profiles associated with these responses: near-zero transmission, moderate transmission, and widespread transmission, as summarized in Table 3.
Description of epidemiological profiles for case study
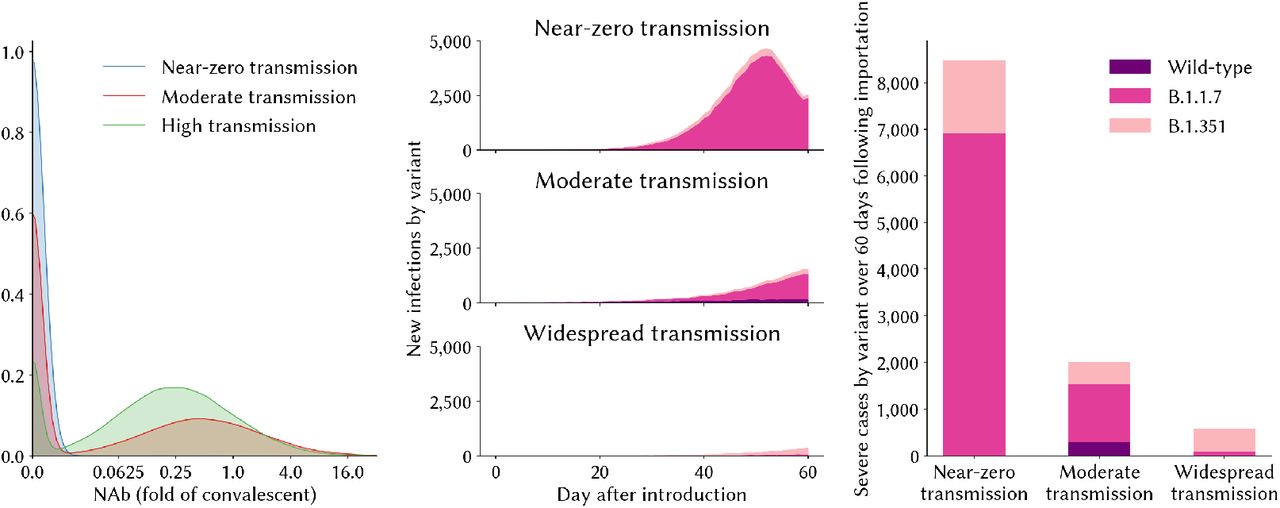
In each of these three contexts, the relative fitness advantages of a more transmissible variant (such as B.1.1.7) compared to a neutralization resistant variant (such as B.1.351) would be expected to differ. We explore this with the model by simulating a population of 100,000 agents under each of these three alternative policy regimes over the 10 months from March 1, 2020 until December 31, 2020, giving rise to three alternative epidemic trajectories and corresponding levels of individuals’ neutralizing antibodies by December 31, 2020 (Fig 3). On January 1, 2021, we then seed 10 infections of variant B.1.1.7 and 10 infections of B.1.351 into the population, and simulate transmission over 60 days assuming no countermeasures are in place over this period, and that B.1.351 is no more transmissible than wild-type variants. We find that in the context of near-zero prior immunity, B.1.1.7 spreads much more rapidly, making up >90% of infections in the 60 days following introduction (Figure 3). By contrast, in the high-transmission setting where significant proportions of the population have already been exposed to wild-type infection, B.1.351 gains a stronger hold due to its immune-evading advantage.

Variant competition in different epidemic contexts. (A) The distribution of NAbs relative to convalescent serum in the population prior to the introduction of new variants; (B) the relative shares of new infections over the 60 day evaluation period, by variant; (C) the cumulative number of severe cases in each setting over the 60 day evaluation period, by variant.
Case study 2: how do immune-escaping variants affect critical vaccination thresholds?
For this example, we again simulate a population of 100,000 agents under the “controlled transmission” setting described above. Specifically, we assume that 40% of the population have some immunity from a prior infection with wild-type SARS-CoV-2 after 10 months of the epidemic, and there are NPIs in place that reduce the average daily transmission probability by 50% relative to no restrictions. As in the previous case study, we then seed 10 cases of variant B.1.351 into the population, and simulate transmission over 60 days assuming no countermeasures are in place over this period, and that B.1.351 is no more transmissible than wild-type variants. We then suppose that AstraZeneca is being distributed to the population, and we calculate the impact of lifting these restrictions after having achieved different vaccination thresholds, depending on whether B.1.351 is circulating among the population or not.
The presence of B.1.351 makes a considerable difference to the vaccination threshold that needs to be attained before NPIs could be lifted without resulting in a resurgence of infections. In this scenario, our estimates show that even high levels of vaccination coverage would not completely eliminate transmission or disease if B.1.351 were present in the population (see Fig 4).
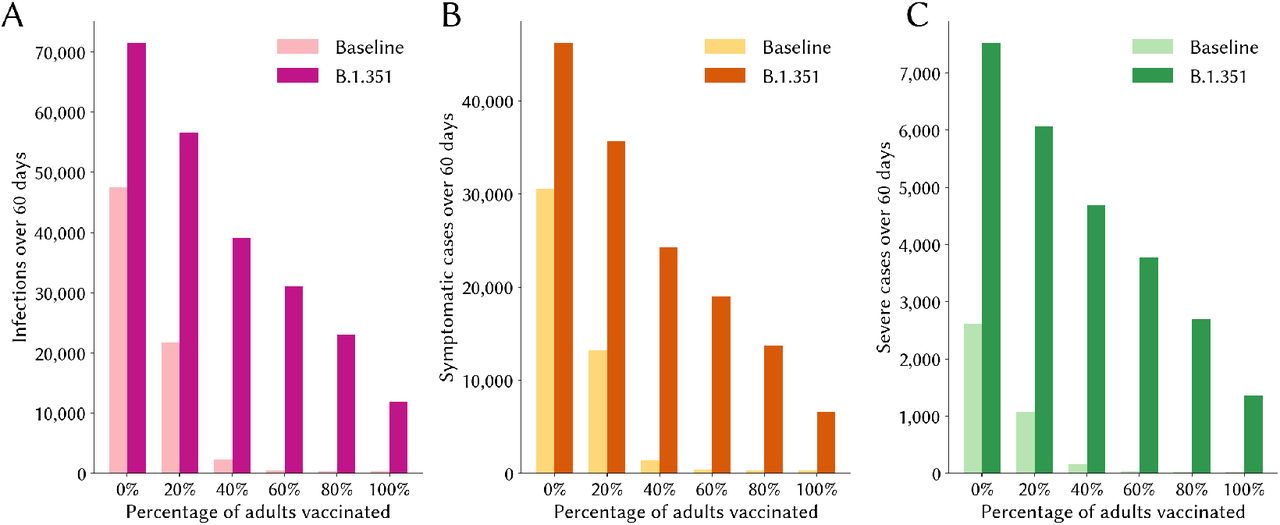
Epidemic impact of lifting restrictions after having reached different vaccination thresholds. The numbers of infections (panel A), symptomatic cases (panel B) and severe cases all fall rapidly as the percentage of adults vaccinated increases in the baseline scenario. However, even under high levels of vaccination coverage, ongoing transmission and disease persist if B.1.351 is circulating.
Case study 3: what can we learn from transmission and phylogenetic trees?
Transmission trees are important tools for the analysis of epidemic dynamics. Covasim contains a method for building transmission trees. It also maintains an infection log with all the infection events in a given simulation. We can take advantage of these tools for epidemic analysis when working with multiple variants and vaccination interventions.
To illustrate an approach for working with trees in Covasim, we consider three scenarios:
Wild variant is introduced on day 0 and P.1 variant is introduced on day 60.
Wild variant is introduced on day 0 and vaccination starts on day 30.
Wild variant is introduced on day 0, vaccination starts on day 30, and P.1 variant is introduced on day 60.
In all of these scenarios, we simulate a population of 100,000 people and 10 seed infections for each variant. A target of 15% of the population is vaccinated in scenarios 2 and 3. The results after 180 days for each of these scenarios is shown in Fig 5.

Epidemic curves for the scenarios in case study 3. The figures show how a scenario with no vaccination (i.e., Scenario 1) leads to a higher number of infections and deaths than one with vaccination campaigns (Scenarios 2 and 3). The effect of multiple variants is also shown by the increased number of cases in Scenarios 1 and 3, which include both wild and P.1 variants.
We can build transmission trees directly from Covasim using a built-in analyzer. We can also build a tree by directly processing the transmission log. Depending on the number of nodes, the size of the transmission tree, and the visualization tools available, it may be useful to focus on a sampled tree instead of the full tree. The most basic sampling strategy is to randomly sample transmission events or nodes from the full tree. We could also use more targeted sampling strategies. One of these strategies is to randomly sample events on specific dates. This could be useful for comparisons with sampled diagnoses and sequencing data. To illustrate this strategy, assume that we sample a number of events every 10 days starting on day 30. We sample 3 events on each of those days from day 30 to 80. Then we increase the sampled events to 5 until day 130. After that we keep sampling 10 events on each of the remaining sampling days. This sampling strategy results in the trees shown in Fig 6. One may also want to sample based on other criteria, for example, from individuals that would render a PCR test positive on a given date, from the death events, etc.

Sampled transmission trees for the scenarios in case study 3. We can randomly sample a given number of events in particular dates to match, for example, actual samples collected from genome sequencing (see for example, Hadfield et al. (2018)). Branch lengths are proportional to number of days between infection events. A visual inspection of the trees allow us to identify patterns in the transmission of competing variants. For example, these trees show only infections with the wild variant early in the epidemic, with P.1 infections starting to show more prominently after 60 days. The tree on the left is built assuming that the wild and P.1 variants have a common ancestor on day 0. The tree on the right simulates a mutation giving rise to a new variant from an existing transmission chain (in this example, we assume that P.1 started from a mutation on one of the infections that occurred around day 60).
It is worth noting that, when using the number of days between events as the branch length, we should expect the sampled tree to look topologically similar to the corresponding phylogenetic tree. We should be careful, however, on the way we join sub-trees that characterize different virus variants, as the assumptions introduced in this process could lead to very different results about common ancestors for nodes in the tree. In some cases, we may have some additional information about some variants arising from mutations of some other variants. In this case, it would be more accurate to join the sub-trees of a descendent sub-tree to an internal node from the parent sub-tree. For example, if we believe that P.1 resulted from a mutation of an existing wild infection around day 60, we could select one of the infections occurring on day 60 as the parent of the seed P.1 infections. In this case, the tree would look as is shown in the tree on the right of Fig 6.
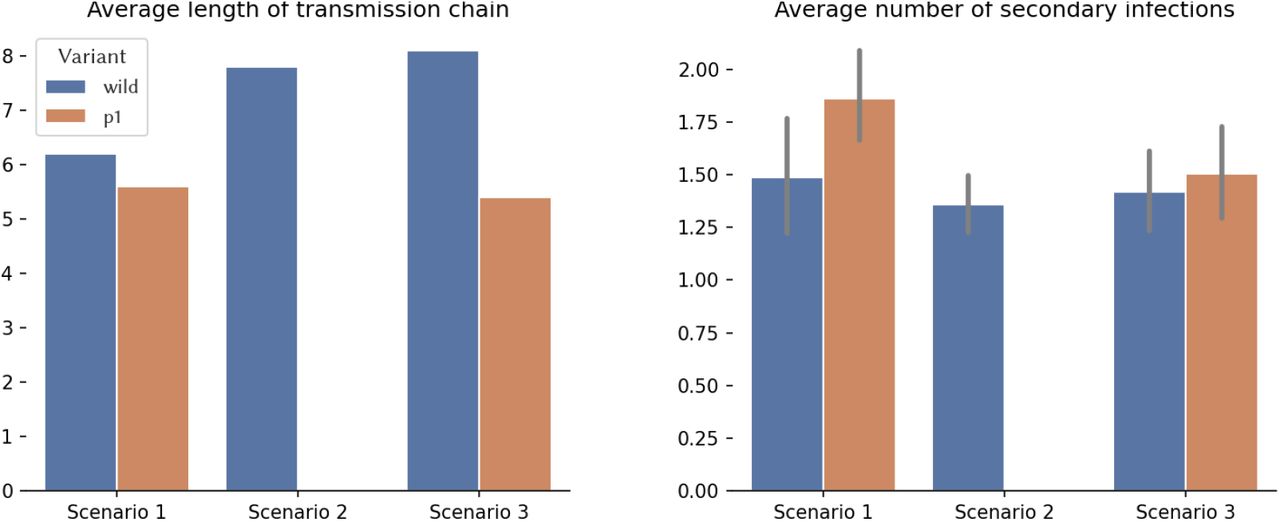
Visual inspection of trees may be cumbersome and sometimes very limited. This is especially true when there are many transmission events that lead to an overcrowded tree. We may rely then on computing and visualizing summary statistics. There are potentially hundreds or even thousands of summary statistics that can be computed from a tree. The selection of informative summary statistics depends on the type of analysis being performed. As an example, consider the length of the transmission chain and the number of secondary transmissions for each variant in our scenarios (see Fig 7). Note that these statistics allow us to infer (from our scenarios) that the P.1 variant is more transmissible than the wild variant, showing that the tree topology reflects the (assumed) dynamics. We can also verify that vaccination campaigns can help reduce transmissibility, but they have to be timely (in the figure, the mild vaccination campaign that begins after heavy transmission with the wild type variant is ongoing has little effect on the epidemic; however, it does have an important effect on reducing transmission of P.1).

Example of summary statistics obtained from the transmission trees for the scenarios in case study 3.
Discussion
As efficacy results from COVID-19 vaccine trials began to appear in late 2020, there was new optimism that the worst of the pandemic may have passed. However, this optimism was quickly curtailed by the simultaneous discovery of mutations of SARS-CoV-2 that led to extreme epidemic resurgences around the world, including in countries that had already experienced high epidemic burdens. These two developments implied a considerable shift in the COVID-19 epidemic landscape, and called for new modeling approaches to help guide responses.
As evidence builds that vaccine efficacy varies considerably across vaccines and variants (Ikegame et al., 2021; Kustin et al., 2021; McCallum et al., 2021; Shen et al., 2021), and while questions around the duration of protection afforded by both vaccination and infection linger (Doria-Rose et al., 2021; Cele et al., 2021; He et al., 2021; Hansen et al., 2021; Madhi et al., 2021; Liu et al., 2021), there will be an increasing need for models that can account for these factors. Theoretical and context-specific studies demonstrate that existing frameworks for modeling co-circulating variants and waning immunity can be usefully applied to COVID-19 models, but a more flexible and generic approach is needed to inform policy decisions in diverse real-world settings. To our knowledge there is no unified modeling framework for COVID-19 that incorporates the ability to model co-circulating variants, imperfect immune memory, and multiple vaccines, although the OpenABM-Covid19 model (Hinch et al., 2020) is currently being extended in these directions. By extending Covasim’s existing framework, we were able to leverage the model’s considerable computational efficiency, meaning that simulating scenarios that incorporate these elements takes no longer than a simple simulation with a single variant and perfect sterilizing immunity, thus overcoming many of the complexities of multi-variant modeling outlined in Kucharski et al. (2016).
Among other diseases for which co-circulating variants and vaccines play an important role, the most well-examined example is influenza, which is known to mutate in a way that renders antibodies from previous infections or vaccinations progressively less effective (Davenport et al., 1953; Gupta et al., 1998). These aspects of influenza lead to extremely complex epidemic dynamics, and several modeling approaches have been developed to aid in understanding these. These include individual-based models that track each agent’s entire histories of infection (Ferguson et al., 2003), history-based compartmental models that construct separate compartments for each possible sequence of prior infections a person may have had (Andreasen et al., 1997), and status-based compartmental models that assign people to compartments based on whether or not they are immune to particular variants without capturing the degree of immunity (Kryazhimskiy et al., 2007). Many additional examples of such models are contained in the review by Kucharski et al. (2016).
We demonstrate the potential of our modeling approach via three case studies. In the first, we show that the dominance of any particular variant depends strongly on the epidemic history within a particular context. In the second, we show that the presence of immune-escaping variants significantly increases critical vaccination thresholds, and in the third, we show how our model can generate transmission trees that enrich our understanding of epidemic dynamics in the presence of multiple variants. These case studies are primarily intended to be illustrative of the model’s capabilities, and ongoing studies using our model are currently investigating questions around variants and vaccines in specific contexts, including the UK, Kenya, South Africa, and Brazil.
Our modeling approach has several limitations. Although we explicitly account for the fact that individuals with some neutralizing antibodies from prior infection or vaccination are less likely to develop symptomatic or severe disease, we do not account for the possibility that the duration of disease may also be reduced or that secondary infections may have a reduced viral load, although there is some evidence to this effect (Gouma et al., 2021; Levine-Tiefenbrun et al., 2021). We do not model the emergence of new variants, although previous studies have attempted this for influenza (Bush et al., 1999; Gupta et al., 1998; Bedford et al., 2012; Koelle and Rasmussen, 2015; Wen et al., 2020) and similar approaches could possibly be applied for SARS-CoV-2. Our modeling approach relies on estimating a relationship between neutralizing antibodies and different correlates of protection, and the data used to establish these estimates are scarce and uncertain, especially for low levels of neutralizing antibodies. We do not specifically model cellular immune responses, although they are likely to also influence disease symptomaticity and severity (Tarke et al., 2021; McMahan et al., 2021). We have modeled antibody kinetics based upon studies of immune decay in patients up to 8 months after SARS-CoV-2 infection, using a two-part exponential decay. An alternative approach taken by (Pelleau et al., 2021) uses a mathematical model of the immunological process underlying the generation and waning of antibody responses following infection. Their study analyzed immune kinetics from multiple cohorts of patients 11 months following SARS-CoV-2 infection. Compared to (Khoury et al., 2021), the antibody kinetics model estimated in (Pelleau et al., 2021) grows and decays more rapidly before quickly plateauing. As a result, this parameterization would allow less rapid reinfection than (Khoury et al., 2021). As new and growing evidence emerges, we expect to revise both our parameter values and some of the methodology described here to reflect our best understanding of the science.
Data Availability
All data and code are freely available.
Acknowledgments
Thanks to Joshua Herbeck, Amanda Izzo and Jennifer Schripsema for their thoughtful review and guidance as well as David Khoury and Miles Davenport for their responsive and helpful correspondences.
Appendix
Appendix
Relating NAbs to protective immunity
We broke vaccine efficacy into conditional parts to match the stages of the infection process. Vaccine efficacy against infection, VEinf, is the first stage that modulates the probability of infection given exposure. For people who get infected, symptomaticity is modulated by the conditional vaccine efficacy given infection, VEsymp|inf. This is defined from the more commonly reported marginal efficacy against symptoms, VEsymp in (Eq 1) as:

Conditional on being infected and having symptoms, the (conditional) efficacy against severity, VEsev|inf,symp is defined similarly from the commonly reported marginal efficacy against severity

In order to estimate the relationship between neutralizing antibodies and correlates of protection, we jointly fit four regressions and used empirical bootstrapping with 5,000 samples to estimate the 90% confidence interval:


 where enatinf,i, einf,i, esymp,i, and esev,i represent the model error terms VEnatinf,i, VEinf,i, VEsymp,i, and VEsev,i respectively represent the reported vaccine efficacy against infection, symptomatic infection, and severe disease from trial i, and NAbi represents the average level of neutralizing antibodies across participants in trial i. This formulation assumes both the efficacy against infection and the conditional efficacy against symptoms given infection are logit-log, and thus the marginal efficacy against symptoms is the more complex function above. The conditional efficacy against severity was modeled similarly.
In the absence of individual-level data, we leveraged the cohort estimates from various vaccine trials and convalescent data sets that report both immunogenicity as well as an associated reduction in the risk of infection and symptoms (Table 4). In order to compare the immunogenicity data with the efficacy endpoints, we accounted for any waning that may have occurred across the timescales reported. We find that accounting for waning would reduce the relative NAbs by nearly 50%, thereby making a large influence in our fit.
We fit Eqs 4, 5, and 6 jointly by minimizing the following objective function:

 where wi represents the total number of infected individuals in trial i, which in balanced trials is the quantity that most strongly affects vaccine efficacy estimate precision.
Fitting was performed using the lmfit package in Python.
Vaccine and convalescent data used to fit relationship between NAb and protective efficacy.


