
Abstract
Objectives In the personalisation of hearing aid fittings, gain is often clinically adjusted to patient preferences using live speech. When using brief sentences as stimuli, the minimum gain adjustments necessary to elicit preferences (‘preference thresholds’) were previously found to be much greater than typical adjustments in current practice. The current study examined the role of duration on preference thresholds.
Design Participants heard 2, 4 and 6-s segments of a continuous monologue presented in pairs. Participants judged whether the second stimulus of each pair, with a ±0-12 dB gain adjustment in one of three frequency bands, was “better”, “worse” or “no different” from the first at their individual real-ear or prescribed gain.
Study Sample Twenty-nine adults, all with hearing-aid experience.
Results The minimum gain adjustments to elicit “better” or “worse” judgments decreased with increasing duration for most adjustments. Inter-participant agreement and intra-participant reliability increased with increasing duration. The effect of duration, however, decreased with increasing duration, with no increase in agreement or reliability for 6-s vs. 4-s segments.
Conclusions Providing longer stimuli improves the likelihood of patients providing reliable judgments of hearing-aid gain adjustments, but the effect is limited, and alternative fitting methods may be more viable for effective hearing-aid personalisation.
Introduction
In the treatment of hearing loss, clinicians fit hearing aids to reach a balance between audibility and comfort for each patient. The balancing act begins with prescribed gains across frequencies based on each patient’s pure-tone thresholds. These prescribed gains, based on average data, are then personalised through adjustments made by the clinician using patient feedback (Anderson et al., 2018; Jenstad et al., 2003; Kuk, 1999; Thielemans et al., 2017). The patient’s feedback is often based solely on the effect the adjustments have on the perception of the clinician’s voice, the most readily available stimulus in any clinic.
We have previously shown what gain adjustments are discriminable for short sentences presented in quiet. Median just-noticeable differences (JNDs) for gain increments in broad low-, mid- and high-frequency bands were 4, 4 and 7 dB, respectively (Caswell-Midwinter and Whitmer, 2019). Using the same speech corpus, we have subsequently shown what gain adjustments are necessary to elicit preferences (Caswell-Midwinter and Whitmer, 2020). Median preference thresholds ranged from 4-12 dB for gain decrements and 5-9 dB for increments in the same broad low-, mid-, and high-frequency bands. In Caswell-Midwinter and Whitmer (2019), it was posited that the greater JNDs for speech in quiet re speech-shaped noise were due to the spectro-temporal sparsity of the speech. That is, for a given gain adjustment in any given band, the clean speech signal provided a smaller number of glimpses of the adjustment than speech plus noise. In Caswell-Midwinter and Whitmer (2020), it was further hypothesised that the large preference thresholds were due in part to the short duration of the stimuli. Although patients typically make quick comparisons on adjustments in the clinic, audiologists may talk for longer, which might elicit more frequent and reliable preferences.
Previous psychophysical research has shown durational effects on level discriminability, albeit mostly limited to short pure-tone stimuli. Increasing the duration of a 0.5 or 8-kHz tone up to 2 s can improve level discrimination in normal-hearing listeners (Florentine, 1986), and improves discrimination in fixed and roving pedestal level conditions (Oxenham and Buus, 2000). For the discrimination of a tone’s level within a complex (i.e., profile analysis), performance improves up to a duration of 100 ms (Green et al., 1984; Dai & Green, 1993). The ability to discriminate a gain adjustment in particular band(s) of speech bears partial resemblance to increment detection, the detection of a temporary increase or ‘bump’ in level in an ongoing sound. Valente et al. (2011) showed that increasing the duration of the standard tone decreased the threshold more than increasing the duration of the increment of a tone. In all past studies of level discrimination and increment detection with varying duration, though, performance improves with frequency (e.g., Moore et al., 1997), whereas the discriminability of gain adjustments decreases with the frequency band of the adjustment for speech (Caswell-Midwinter and Whitmer, 2019). There is some evidence of a duration effect with broadband stimuli: studying the detection of an 8-dB peak at 3.5 kHz in a broadband noise, Farrar et al. (1987) found that thresholds decreased as duration increased up to 300 ms, the maximum duration tested. Isarangura et al. (2019) found that spectral modulation detection thresholds in a broadband noise carrier also decreased with increasing duration but were asymptotic by 200 ms. For speech stimuli, the evidence of duration effects on level discrimination is scant; in a study of overall level discrimination of speech, the threshold for words (mean duration 450 ms) was only significantly worse (greater) than for sentences (mean duration 1533 ms) when participants were aided (Whitmer and Akeroyd, 2011).
In sound-quality evaluations such as comparing the adjustments of hearing-aid settings, a balance must be struck in sound-sample duration. The sample must be long enough in order to perceive the acoustic changes, but also short enough to be able to compare the adjusted sound with the previous (reference) sound. International Telecommunication Union (ITU) recommendations for subjective sound-quality evaluations note that for paired comparisons, durations should not exceed 15-20 s due to “short-term human memory limitations,” but can be “a few seconds” (ITU, 2019, p. 6). These memory limitations – the ability to maintain features of the first sound for comparison to the second (e.g., auditory sensory memory trace; Sams et al., 1993) – are often measured as the effect of the inter-stimulus interval (ISI) duration. In the clinic, the adjustment is often without any gaps outwith natural pauses in ongoing speech. The memory limitation for comparing ongoing stimuli, as experienced in the clinic, has been previously modelled as modest exponential decay over many seconds, albeit for pure-tone stimuli (Durlach and Braida, 1969; Massaro, 1970). Despite qualitative recommendations and a long history of auditory memory research (cf. Cowan, 1984), the effect of duration on preferences for speech stimuli, as presented in the clinic during hearing-aid adjustments, is not known.
On the basis of the foregoing evidence, we hypothesize that extending the duration of the stimulus will elicit more frequent and reliable preferences for gain adjustments. The current study used most of the same methods, including most of the same participants, as Caswell-Midwinter and Whitmer (2020) did when measuring preferences for gain adjustments. The main difference is the primary experimental contrast: stimulus duration. To avoid potential memory confounds, the maximum stimulus duration was 6 s (cf. ITU-R 2003); the minimum was 2 s (vs. 0.855-2.3 s in the previous study). To better mimic elements of a clinical session, there were five other methodological differences. First, the stimuli were consecutive segments from a continuous story instead of repeated (within a trial) sentences. Second, the gain adjustment was always the second interval on each trial, not randomised. Third, the number of gain adjustments was reduced from six (±4, 8 & 12 dB) to four (±6 & 12 dB). Fourth, there was no ISI. Finally, given the lack of agreement or reliability in using descriptors (e.g., “tinny”) to describe the effect of a gain adjustment in Caswell-Midwinter and Whitmer (2020), the current study only measured preferences.
Methods
Participants
Twenty-nine adults (14 female) were recruited from a sample who had previously participated in a gain discrimination experiment (Caswell-Midwinter and Whitmer, 2019). The median age was 68 years (range 51-74 years). The median better-ear four-frequency (0.5, 1, 2 & 4 kHz) pure-tone threshold average (BE4FA) was 35 dB HL (range 12-56 dB HL). The median sensation level for amplified stimuli, averaged across the same four frequencies, was 35 dB SL (range 15-51 dB SL). None of the participants had a conductive loss (i.e., all participants’ average air-bone threshold differences were less than 20 dB; British Academy of Audiology, 2016).
For 19 participants habitually wearing hearing aids at the time of the study, the real-ear insertion gain provided by their hearing aids in their better ear was measured and used as their gain prescription. For ten participants who were not currently wearing hearing aids, linear NAL-R gain prescriptions (Byrne and Dillon, 1986) for their better ear were used. Median hearing-aid experience was 10 years (range 2-35 years). Twenty-six of the 29 participants took part 18 mos. earlier in the aforementioned preference experiment with short sentences (Caswell-Midwinter and Whitmer, 2020).
All participants had alos performed visual letter and digit monitoring tasks during a previous study (min. 18 mos. prior to current study) as an estimate of their cognitive abilities (specifically working memory; Gatehouse et al., 2006). The tasks involved identifying sequences at two different ISIs (1 and 2 s); a full description is in Caswell-Midwinter and Whitmer (2019b). The resulting d’ measures were averaged across letter and digit tasks and ISIs to a single cognitive score.
Stimuli
The stimuli were consecutive segments of a Sherlock Holmes story read by a professional male actor with a Southern English accent (“The Naval Treaty”; Doyle, 2011). The original stimuli were collapsed from stereo to mono and resampled to 24 kHz from an original recording sample rate of 44.1 kHz. Any silent gaps greater than 250 ms were truncated to 250 ms. On each trial, two consecutive segments were presented to the participants’ better ear, both with equal duration of either 2, 4 or 6 s. For each segment, 50-ms linear onset and offset gates were applied. To better mimic adjustments in the clinic, the standard stimulus was always the first stimulus in the pair, and there was no ISI beyond the offset and onset gating.
For the standard stimulus, real-ear or prescribed gain was applied across six frequency bands: a 0.25 kHz low-pass band, four octave bands centred at 0.5, 1, 2 and 4 kHz, and a 6 kHz high-pass band. For the target stimulus, additional gain (ΔGain) of either −12, −6, 0, +6 and +12 dB was applied in one of three broad frequency bands: a low-frequency band combining 0.25 (low-pass) and 0.5 kHz (octave) bands (LF), a mid-frequency band combining 1 and 2 kHz octave bands (MF), and a high-frequency band combining the 4 kHz and 6 kHz (high-pass) bands (HF). Stimuli were generated by convolving each segment with a 140-tap finite impulse response filter optimised for NAL-R equalisation at 24-kHz sample rate by Kates and Arehart (2010). The overall long-term A-weighted presentation level was 60 dB SPL to approximate in-quiet conversation level (Olsen, 1998). Presentation level was verified with an artificial ear and sound level meter (Bruel & Kjaer 4152 and 2260), prior to any prescription or gain adjustment. Audibility of the segments was confirmed with each participant after the first trial.
We additionally analysed the effect of the natural variation in power across the consecutive segments of each trial (i.e., when ΔGain = 0). There were significant mean level differences between the two segments in any given trial as a function of both frequency band and segment duration [F(2,56) = 13.06 & 19.41, respectively]. The differences, however, were small; variation in band-specific level increased from 0.2 dB for the LF band to 0.3 dB for MF and HF bands [t(28) = 4.76; p ≪ 0.001], and variation decreased from 0.3 to 0.2 to 0.1 dB when duration increased from 2 to 4 to 6 s, respectively [t(28) = −2.58 & −4.39; p = 0.015 & 0.0002, respectively].
Procedure
Participants were seated in a sound-isolated booth (IAC Acoustics), and listened to the stimuli through circumaural headphones (AKG K702) without hearing aids. The change in stimulus within each trial from first to second segment was synchronously indicated on a touch screen in front of the participant. Participants were asked on each trial to listen to each presentation and decide “How did the second sound compare to the first sound?” by selecting either the “better”, “worse” or “no difference” button on the touch screen.
There were three segment durations (2, 4 and 6 s) and 13 gain adjustments (±6 and ±12 dB adjustments in the LF, MF and HF bands plus a no-adjustment control), resulting in 39 stimulus conditions. Each stimulus condition was repeated ten times, resulting in 390 trials (3×13×10). The order of presentation was randomised for each participant. The trial run was broken into equal blocks of 130 trials with breaks between. Prior to testing, each participant completed12 practice trials consisting of one trial each of 2-s and 6-s segments with ±12 dB gain adjustments in each of the three bands.
Ethical approval for the study was given by the West of Scotland research ethics committee (18/WS/0007) and NHS Scotland R&D (GN18EN094). All participants provided written informed consent prior to testing.
Results
Preferences
Mean preference ratings – rates of “better,” “worse” and “no difference” judgments – were calculated for each participant for gain adjustments in each frequency band (see Figure 2). A repeated-measures analysis of variance was run on the entire dataset (5 gain adjustments × 3 frequency bands × 3 segment durations) using individual mean combined “better” and “worse” preference rates [P(B||W) = 1 – P(ND)] as the dependent variable (see Table 1). Amount of gain adjustment, frequency band and duration all showed significant main effects on better-and-worse preferences. Better and worse judgments increased with increasing duration, from 2 to 4 s [t(28) = 8.44; p ≪ 0.001] and 4 to 6 s [t(28) = 2.80; p = 0.0092].
Results of the repeated-measures analysis of variance on mean preferences, showing degrees of freedom (df), F-statistics and p values and partial eta-squared effect sizes. Degrees of freedom (df) and probabilities (p) reflect Greenhouse-Geisser (1959) corrections for non-sphericity.
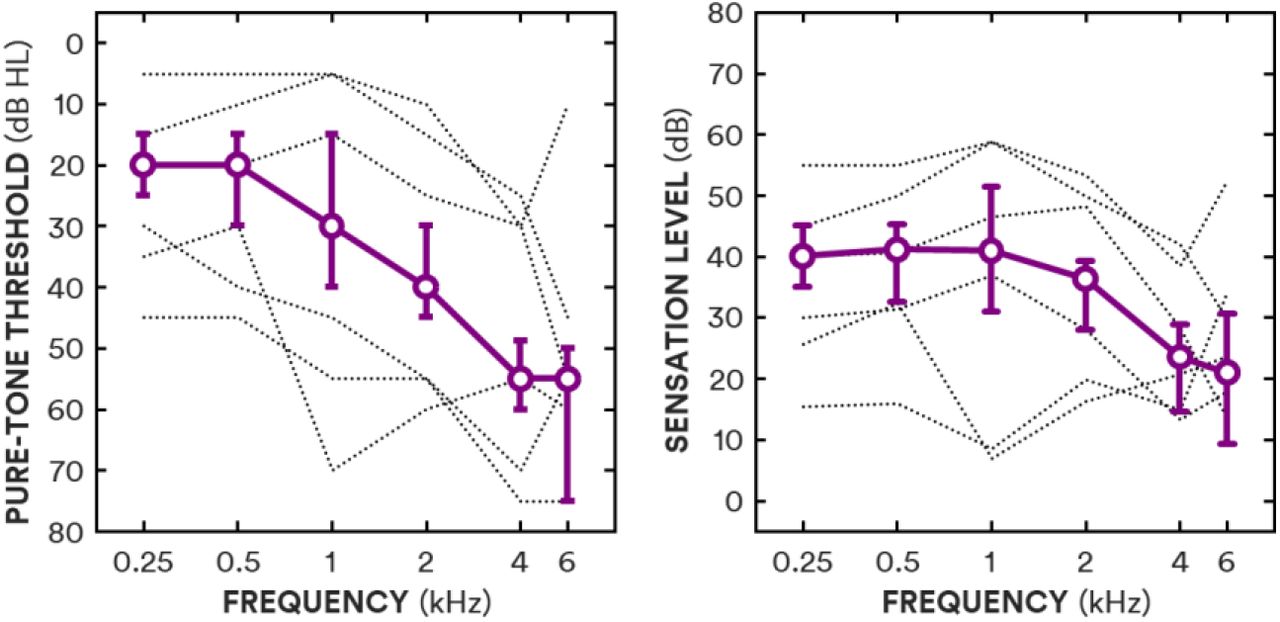
Left panel shows median pure-tone thresholds as a function of frequency (circles, solid line) and interquartile ranges (error bars), with the individual curves for the three lowest and highest average thresholds (dotted lines). Right panel shows median sensation level as a function of frequency (circles, solid line) and interquartile ranges (error bars), with the individual curves for the three lowest and highest average sensation levels (dotted lines).
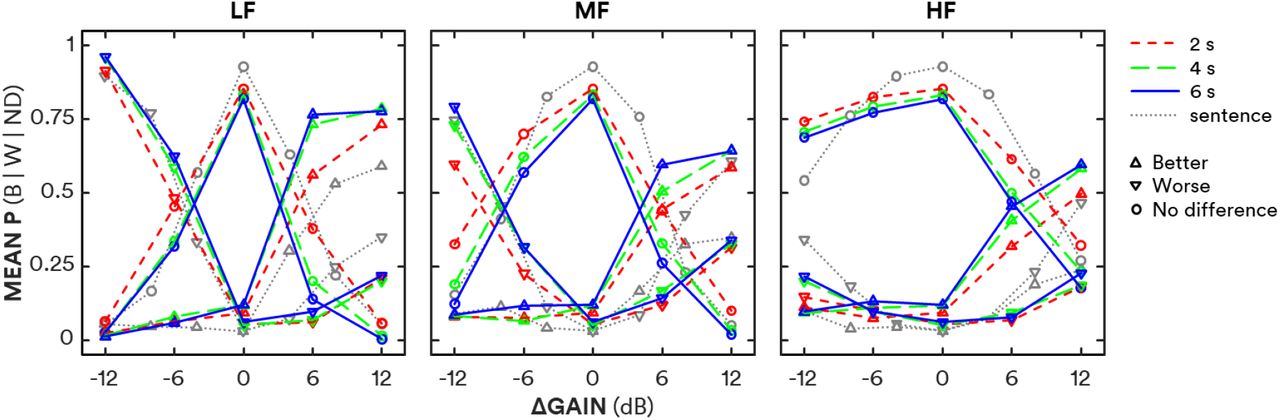
Mean preferences as a function of gain adjustment for low-frequency (LF; ≤ 0.5 kHz), mid-frequency (MF; 1-2 kHz) and high-frequency (HF; ≥ 4 kHz) bands (left, middle and right panels, respectively) with 2-s, 4-s and 6-s durations (red short-dashed, green long-dashed and blue solid lines, respectively). Better, worse and no difference preferences are shown as upward triangles, downward triangles and circles, respectively. Grey dotted lines and symbols show results using short sentences from Caswell-Midwinter and Whitmer (2020).
The greatest rates of “better” and “worse” responses were for LF adjustments. Compared to preferences elicited for short sentences in Caswell-Midwinter and Whitmer (2020; grey triangles and dotted lines in Figure 2), the consecutive segments elicited more “better” and less “worse” ratings for +12-dB adjustments in the MF band [t(59) = 3.11 & −3.10 for better and worse, respectively; p = 0.0028 & 0.0030] and HF band [t(59) = 5.32 & −3.77, respectively; both p < 0.001]. There also appear to be more “better” and less “worse” ratings in the LF band for +12 dB adjustments (comparing grey with coloured triangles in the left panel of Figure 2) in the current study compared to the previous, but these differences were not statistically significant [t(59) = 1.99 & −1.60; both p > 0.05].
Participants were less prone to choose “no difference” when there was no gain adjustment in the current study compared to the previous study. The proportion of no difference responses at ΔGain = 0 was 0.84 across segment durations compared to 0.94 previously for short sentences [t(56) = 3.31; p = 0.0017].
Preference thresholds
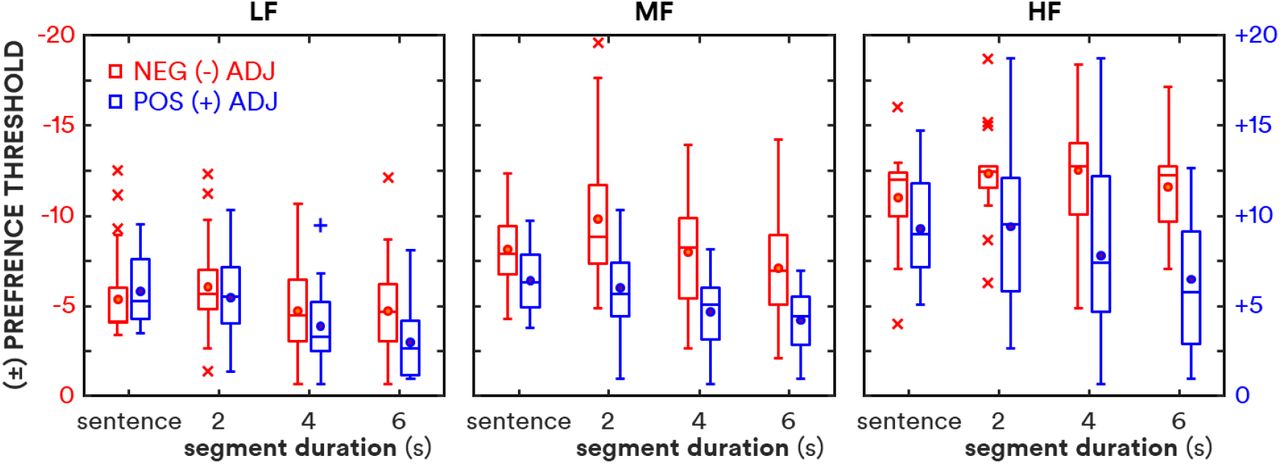
The minimum gain adjustment required to elicit either a “better” or “worse” preference – the preference threshold – was estimated by fitting each individual’s mean better and worse preferences (= 1 – no difference preferences) with a logistic function. Separate functions were fit to negative and positive gain adjustments (i.e., decrements and increments) in each frequency band. The threshold was defined as P(B||W) = 0.55 [P(ND) = 0.45] which corresponds to d’ = 1 for an unbiased differencing observer in a same-different discrimination task (Macmillan and Creelman, 2005). Shapiro-Wilk tests of normality were violated in three of the 18 conditions: 4-s and 6-s LF (+) increment and 2-s MF (-) decrement thresholds (W = 0.91, 0.87 & 0.88, respectively; p = 0.018, 0.0034 & 0.0064); nevertheless, we use Tukey boxplots (Tukey, 1977) in Figure 3 to show the range of preference thresholds for each condition. The Holm-Bonferroni method (Holm, 1979) was used to adjust the rejection probabilities for multiple comparisons where necessary.

Preference just-noticeable differences (JNDs) as a function of stimulus duration: sentences (average duration 1.6 s; Caswell-Midwinter & Whitmer, 2020), 2 s, 4 s and 6 s consecutive segments of a story. Preference thresholds for negative and positive gain adjustments are shown in red and blue, respectively. Dots show means; lines show medians; boxes show interquartile ranges (IQR); whiskers show extent of data < 1.5·IQR; crosses and pluses show outliers for negative and positive adjustments, respectively.
A repeated-measures analysis of variance showed main effects of frequency band, direction (±) of gain adjustment and segment duration (see Table 2). Preference thresholds decreased with segment duration, increased with frequency band and were greater for decrements than increments. There was a significant interaction as frequency band × gain direction; decrement thresholds increased more than increments with increasing (centre frequency) band. There were also a significant albeit modest (η2 = 0.11) interaction between gain direction and duration; preference thresholds decreased generally more for increments than decrements. There was additionally a significant but modest three-way interaction in the MF band: preference thresholds decreased with increasing segment duration more for decrements than increments.
Results of the repeated-measures analysis of variance on preference JNDs, showing degrees of freedom (df), F-statistics and p values and partial eta-squared effect sizes. Degrees of freedom (df) and probabilities (p) reflect Greenhouse-Geisser (1959) corrections for non-sphericity.
Mean thresholds with 95% repeated-measures confidence intervals (Loftus and Masson, 1994) are shown in Table 3. Thresholds significantly decreased with increasing duration for gain increments in the LF, MF and HF frequency bands, and for gain decrements in the for LF and MF bands, respectively; the thresholds for decrements in the HF band (12.1 dB) did not significantly change across durations. The overall rate of change, derived from a linearisation of mean thresholds not including HF decrements, decreased as a function of duration from −0.7 to −0.3 dB/s. That is, preference thresholds decreased more for duration changing from 2 to 4 s than from 4 to 6 s.
Mean preference thresholds and 95% confidence intervals in brackets for all conditions including mean data from Caswell-Midwinter and Whitmer (2020).
The preference thresholds here for 2-s consecutive segments of a continuous story were similar to the thresholds for short sentences in Caswell-Midwinter and Whitmer (2020) with the exception of MF and HF decrements, for which the current thresholds were significantly greater (t = 2.75 and 2.49; p = 0.011 and 0.030, respectively). Thresholds for 2-s stimuli were positively correlated across frequency bands with thresholds in the previous study for both increments and decrements (ρ = 0.55 and 0.72, respectively; both p ≪ 0.001). Preference thresholds were not correlated with age, better-ear four frequency pure-tone average, or hearing-aid experience after applying Holm-Bonferroni (1979) corrections for multiple comparisons (all p > 0.05). HF increment preference thresholds were positively correlated with HF pure-tone thresholds (ρ = 0.44; p = 0.032), and negatively correlated with HF sensation level (ρ = −0.48; p = 0.019). Preference thresholds were not correlated with cognitive score, but the individual decrease in threshold with duration, characterised as the dB/s slope, was negatively correlated with cognitive score (r = −0.50; p = 0.0073). That is, duration had a greater effect on those with greater letter/digit-monitoring ability.
Preference agreement and reliability
Fleiss’ κ (Fleiss, 1971) was used to measure inter-participant agreement, comparing participants’ most frequent judgment of each adjustment condition. To simplify the analysis, judgments were collapsed across adjustments for each direction and frequency band; the ΔGain = 0 condition was not included in the analysis. Fleiss’ κ was 0.39 [0.36-0.42 95% confidence intervals (CI)], 0.50 (0.47-0.53) and 0.50 (0.47-0.53) for segments of 2-s, 4-s and 6-s duration, respectively, representing fair (2 s) and moderate (4 & 6 s) agreement (ibid.). That is, agreement significantly increased from 2-4 s, but not from 4-6 s.
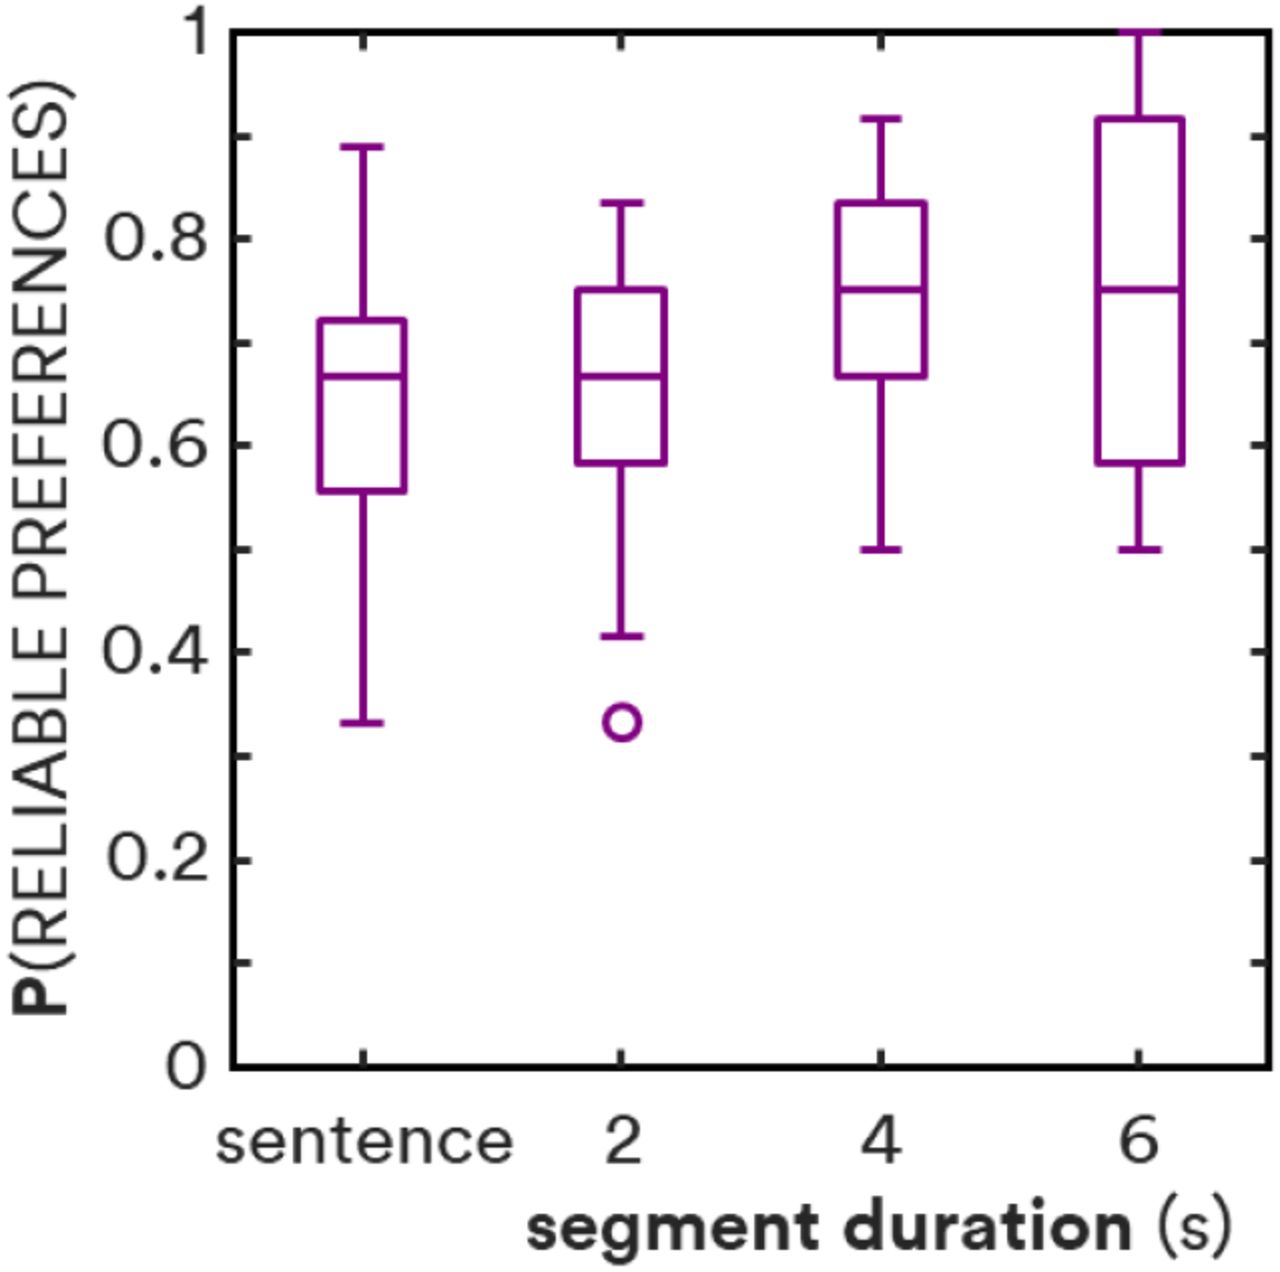
For each participant, a given gain adjustment was considered reliable if it elicited seven or more “better,” “worse” or “no difference” judgments, a reliability threshold based on binomial probability theory (Kuk and Lau, 1995). The ΔGain = 0 condition was not included. Because the proportions of reliable preferences in the current study were not normally distributed based on Shapiro-Wilk tests (W = 0.92, 0.90 & 0.92 for 2-s, 4-s & 6-s stimuli), non-parametric tests were used. Figure 4 shows individual proportions of adjustments with reliable preferences. Reliability increased significantly from a median value of 67% for short sentences and 2-s segments to 75% for 4-s and 6-s segments [χ2 = 11.10; p = 0.011]. There was no significant difference in reliability between sentences and 2-s segments (z = 0.65; p = 0.51) nor 4-s and 6-s segments (z = 0.72; p = 0.47). The percentage of participants with ≥ 90% reliable preferences, however, did increase from 14% at 4 s to 28% at 6 s. Individual reliabilities for short sentences and 2-s stimuli were not correlated, but reliabilities for 4-s and 6-s stimuli were (r = 0.61; p = 0.0004).

Proportion of reliable preferences as a function of stimulus duration. Horizontal lines show medians; boxes show interquartile ranges (IQR); whiskers show extent of data ≤ 1.5·IQR; circles show outliers. Sentence data is from Caswell-Midwinter and Whitmer (2020).
Discussion
By having participants compare and judge consecutive segments of a single-narrator story, we have shown that longer durations promote more frequent and reliable preference judgments for gain adjustments in broad frequency bands. That is, the gain adjustments required to elicit preferences decreased with increasing stimulus duration. Preferences were more frequent, ergo preference thresholds were smaller, for increments compared to decrements, in agreement with Caswell-Midwinter and Whitmer (2020) as well as previous psychophysical literature (Ellermeier 1996; Moore et al. 1989). Preferences were less frequent with increasing centre frequency of the adjustment band, as previously shown for short sentences (Caswell-Midwinter and Whitmer, 2020).
Despite differences in the method, the median preference thresholds in the current study for 2-s segments were similar to the thresholds for 1.6-s average duration sentences in our previous study (Caswell-Midwinter and Whitmer, 2020), and correlated with the previous thresholds. As with the previous study, the strongest preferences were for increased LF gain and against decreased LF gain, as found in self-fitting studies (Keidser and Convery, 2018; Nelson et al., 2018; Vaisberg et al., 2021). The spectral peaks of the stimuli being in the LF band may have influenced discriminability of LF adjustments (Jesteadt et al. 2017), increasing preferences and reliability. There were preference differences between the two studies, with increases in “better” vs. “worse” judgments for MF and HF increments in the current study. The differences in the long-term spectra between the current monologue and previous sentences– 0.9, 0.2 and −5.6 dB in the LF, MF and HF bands, respectively – can explain the increase in “better” preferences for the HF band, but not the MF band.
Participants were less likely to respond “no difference” in the current study where consecutive segments were presented without gain adjustments compared to the previous study (Caswell-Midwinter and Whitmer, 2020) where the same sentence was presented. This difference can be attributed to the comparison of two different speech segments; the naturally occurring differences in the spectrotemporal patterns across the two intervals (without any gain difference) decreases the likelihood of a “no difference” response. The effect of this decrease in no-difference responses on threshold estimation was minimal, decreasing threshold estimates by 0.4 dB on average when comparing with individual no-difference responses for the 26 participants from the previous study. Nevertheless, the change demonstrates a limitation of using sequential stimuli for comparison.
The use of an ongoing story (cf. hearing the same utterance twice) provided a greater degree of participant engagement with the material, as might occur in the clinic, where the patient is selecting parameters for real-world use. Conversely, any greater engagement with the stimulus content, however, may have been detrimental to performing the task. Beyond the decrease in no-difference responses, the effect of comparing different stimuli (two consecutive segments) versus comparing identical stimuli was otherwise small. Using non-repeating intervals may have introduced decision noise, inflating thresholds (cf. Whitmer and Akeroyd, 2011). The natural variations in spectrum between the consecutive segments on any given trial were modest on average, and excluding trials with the greatest inter-stimulus variation in any frequency band only affected particular thresholds, and increased – not decreased – those thresholds modestly (0.2-0.3 dB). That is, there is scant evidence that the natural variation in the consecutive intervals affected the pattern of results.
The delivery of stimuli for appraisal by the patient in the clinic may, however, be different to paired or sequential comparisons. Instead of a pre- and post-adjustment comparison, the appraisal may take the form of a single interval. Single interval ratings of hearing-aid sound quality have shown moderate test-retest reliability (Narendran and Humes, 2003) and good inter-rater reliability (Gabrielsson et al. 1990), but these studies were with stimuli durations of 50-60 s. Using such long stimuli within clinical fine-tuning may not be feasible.
It is not clear from the current results if talking even longer (i.e., for durations > 6 s) would provide even greater discriminability and more reliable preferences. While the thresholds across most conditions decreased significantly from 4-s to 6-s, the trend was asymptotic. The overall rate of change decreased from −0.8 dB/s at 4 s to −0.4 dB/s at 6 s, resembling the modest exponential decay of memory-performance models (e.g., Durlach and Braida, 1969). In line with memory-performance models, there was a negative correlation between participants’ monitoring-task cognitive scores and the rate of decrease in their preference thresholds with increasing duration. That is, the better their cognitive scores, the stronger the effect of stimulus duration on preference thresholds. This suggests that the effect of duration in the judgment of gain adjustments is limited by each individual’s cognitive abilities. The mean preferences were very similar for 4-s and 6-s stimuli (Figure 2), and there was no increase in inter-participant agreement nor intra-participant reliability (Figure 4). It is therefore unlikely for thresholds to decrease, or reliability to increase, much further beyond the results here for 6-s stimuli (cf. Sams et al., 1993).
The improvement in thresholds and reliability with stimulus duration is also small relative to the thresholds and reliabilities themselves. Talking or presenting stimuli for 6 s to a hearing-aid wearer in the clinic will help elicit preferences for adjustments, but those adjustments still need to be large: 3-6 dB for increments, 5-12 dB for decrements. These thresholds are still well above common troubleshooting adjustments, especially for adjustments in the higher frequencies. In the personalisation of hearing aids in the clinic, it is therefore important to not only say more than a few words (e.g., “how’s that sound?”) immediately following an adjustment, but to ensure the adjustment is large enough to elicit reliable feedback. Given these constraints, alternative methods of fitting, such as self-adjustments (Boothroyd and Mackersie, 2017; Nelson et al., 2018), may be more viable for effective hearing-aid personalisation.
Data Availability
Data available upon request
Disclosure Statement
No potential conflict of interest was reported by the authors.
Funding
This work was supported by funding from the Medical Research Council [grant numbers MR/S003576/1 and 1601056]; and the Chief Scientist Office of the Scottish Government.
Acknowledgments
The authors would like to thank David McShefferty for his assistance in conducting the study. This work was supported by funding from the Medical Research Council [grant numbers MR/S003576/1 and 1601056]; and the Chief Scientist Office of the Scottish Government.


