
Abstract
Background African American (AA) men have significantly higher mortality rates from prostate cancer (PC) than individuals of European ancestry (EA). Therapeutically targetable molecular differences may hold the potential to reduce this disparity.
Objective To investigate chromodomain helicase DNA-binding protein 1 (CHD1) deletion both as a cause of aggressive disease and therapeutic vulnerability in the prostate cancer of AA men.
Design, setting, and participants 91 AA and 109 EA prostate cancer cases were analyzed by fluorescence in situ hybridization (FISH) for the deletion of CHD1. Whole exome and whole genome sequencing data from prostate adenocarcinoma cases were analyzed for mutational signatures from AA and EA individuals.
Outcome measurements and statistical analysis Associations with biochemical recurrence were evaluated using Cox proportional hazard regression models. Association between mutational signatures and CHD1 deletion were assessed by Wilcoxon ranked sum tests.
Results and limitations Subclonal deletion of CHD1 is nearly three times as frequent in prostate tumors of men than in EA men. CHD1 deletion is associated with some of the homologous recombination deficiency associated mutational signatures in prostate cancer. In a cell line model CHD1 deletion induced 1-10 kb deletions resembling those induced by BRCA2 deficiency. CHD1 deficient cells showed markedly increased sensitivity to both talazoparib and the radiomimetic bleomycin.
Conclusions CHD1 is more frequently deleted in the prostate cancer of AA men. This deletion is both associated with and induces mutational signatures characteristic of BRCA2 deficiency. CHD1 deficient prostate cancer is more sensitive to talazoparib or bleomycin treatment.
Patient summary Subclonal deletion of CHD1 is more frequent in the prostate cancer of AA men and this could be one of the reasons behind more aggressive disease. CHD1 deletion, however, also constitutes a therapeutic vulnerability to the PARP inhibitor talazoparib. This treatment may significantly improve the outcome of disease in AA men.
Introduction
African American (AA) men have significantly higher incidence and mortality rates from prostate cancer (PC) compared to individuals of European ancestry (EA). Recent studies demonstrated that AA men are at higher risk of progression after radical prostatectomy, even in equal access settings and when accounting for socioeconomic status[1,2]. While the reasons underlying these disparities are multifactorial, these data strongly argue that germline and/or somatic genetic differences between AA and EA men may in part explain these differences.
Comparative analysis of AA and EA prostate tumors have identified several genetic differences. PTEN deletions, ERG translocations and/or ERG over-expression are more frequent in PCs of EA men[3–5]. In contrast, LSAMP and ETV3 deletions, ZFHX3 mutations, MYC and CCND1 amplifications and KMT2D truncations are more frequent in PCs of AA men[6–8]. ERF, an ETS transcriptional repressor, also showed an increased mutational frequency in AA prostate cancer cases with probable functional consequences such as increased anchorage independent growth[9], and SPINK1 expression is also enriched in African American PC[10].
Chromodomain helicase DNA-binding protein 1 (CHD1) deletion is frequently present in prostate cancer. Deletions are associated with increased Gleason score and faster biochemical recurrence[11], activation of transcriptional programs that drive prostate tumorigenesis[12] and enzalutamide resistance[13]. Mechanistically, CHD1 loss influences prostate cancer biology in at least two ways. CHD1, an ATPase-dependent chromatin remodeler, contributes to a specific distribution of androgen receptor (AR) binding in the genome of prostate tissue. When lost, the AR cistrome redistributes to HOXB13 enriched sites and thus alters the transcriptional program of prostate cancer cells [12]. CHD1 also contributes to genome integrity. It is required for the recruitment of CtIP, an exonuclease, to DNA double strand breaks (DSB) to initiate end resection. Upon CHD1 loss this important step in DSB repair is impaired leading to homologous recombination deficiency[14,15]. The functional impact of CHD1 loss is further influenced by the presence of SPOP mutations, which were reported to be associated with the suppression of DNA repair[16].
CHD1 loss is frequently subclonal[17], which makes its detection by next generation sequencing more challenging[18] and it may go undetected depending on the subclonal fraction of cells harboring this aberration. Therefore, the true proportion of PC cases with CHD1 may be underestimated. Thus, we decided to investigate the frequency of CHD1 loss in EA and AA PC by methods more sensitive to detecting subclonal deletions including evaluations of multiple tumor foci present in each prostatectomy specimen.
RESULTS
Subclonal CHD1 deletion is more frequent in African American prostate cancers and associated with worse clinical outcome
CHD1 is frequently subclonally deleted in prostate cancer [17]. Our initial analysis on the SNP array data from TCGA comparing AA and EA PC cases suggested that the subclonal loss of CHD1 may be a more frequent event in AA men (Suppl. Figures 1 and 2). To independently validate this observation, we assessed CHD1 copy number by FISH in tissue microarrays (TMAs) constructed from multiple tumor foci per prostatectomy specimen in a matched cohort of 91 AA and 109 EA patients from the equal-access military healthcare system (Figure 1A, Suppl. Figure 3). Key clinico-pathological features including diagnosis, age, diagnosis PSA levels, pathological stages, Gleason sums, Grade groups, margin status, adjuvant therapy, biochemical recurrence (BCR) and metastasis did not differ between AA and EA cases (Suppl. Table 1A). Consistent with the long-term follow up (median: 16 years) of the cohort, we observed a 40% biochemical recurrence (BCR) and 16% metastasis rate[19]. For each clinical case up to four different cancerous areas were analyzed comprising 4-10 different tissue cores (for details see methods and Suppl. Table 1).
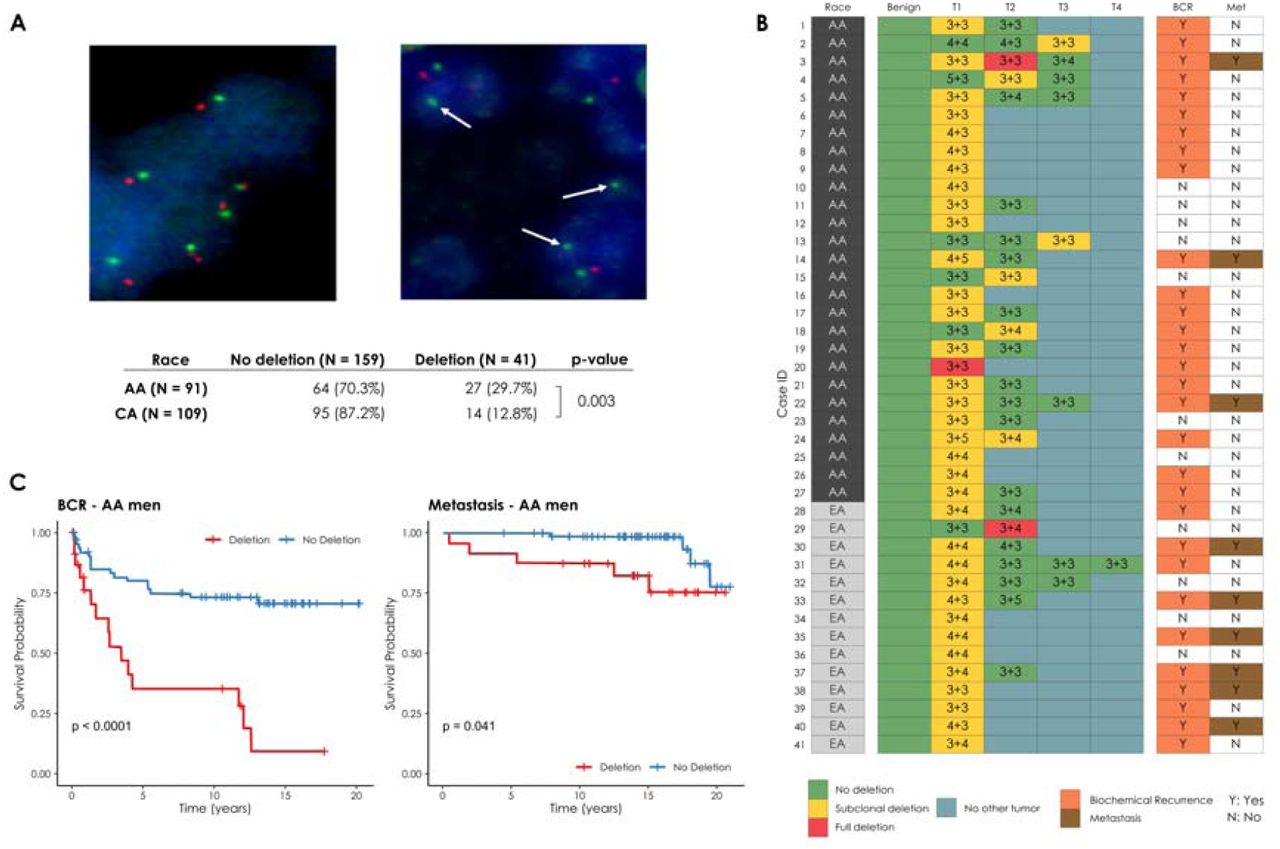
(A) Prostate cancer cells with wild type (diploid) CHD1 (upper left) vs. prostate cancer cells harboring mono-allelic deletion for CHD1 (upper right) are visualized by FISH assay. Orange signal: CHD1 probe; green signal: human chromosome 5 short arm probe; blue color: DAPI nuclear stain. Arrows are representing the lack of CHD1. Representative view fields capture 3-3 cell nuclei at 60X magnification. Inset table summarizes the higher frequency of CHD1 deletion in prostatic carcinoma of AA vs. EA patients. (B) CHD1 deletion is a subclonal event in prostate cancer. Multiple tumor samples from 200 patients were assessed by FISH assay that identified 41 patients with CHD1 deletion (left panel). The heatmap depicts the sampled largest tumor 1 (T1), second largest tumor (T2), and so on. Numbers denote pathological Gleason grade for each tumor. BCR: biochemical recurrence (grey); Met: metastasis (brown). (C) Deletion of CHD1 (clonal or subclonal in any of the nodes) is strongly associated with disease progression in AA prostate cancer patients (N=91). BCR: univariable Kaplan-Meier curve; Metastasis: univariable Kaplan-Meier curve.

(A) HRD-score, the sum of the three genomic scars, HRD-LOH, LST, and ntAI, (B) number of somatic mutations due to single-base substitution signature 3, (C) number of structural variants due to rearrangement signature 5.
The significance of the difference between the means of the “CHD1 loss” and “control” groups were assessed with Wilcoxon ranked sum tests. Below the box plots are the correlations between the approximate levels of loss in CHD1 and the HRD measures are visualized. The standard errors and the corresponding p-values of the correlation coefficients (Pearson) are also indicated. Horizontal lines indicate the uncertainty in the level of loss in each sample. Thick black lines correspond to the 66%, thin black error-bars to the 95% percentile intervals.

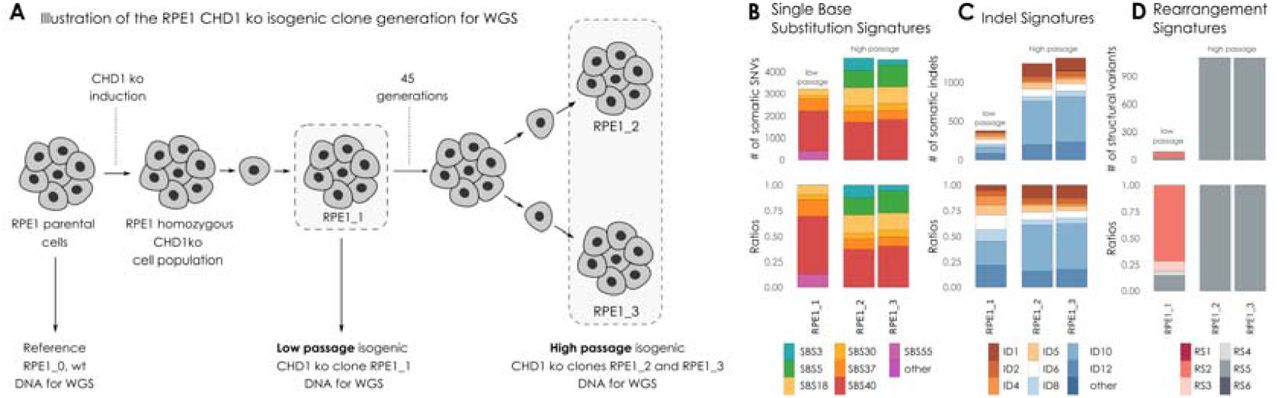
(A) Illustration of the RPE1 CHD1 knock out (ko) isogenic clone generation for whole genome sequencing (WGS). DNA was extracted from RPE1 parental cell line (wild type, wt) and used as a reference genome. CHD1 ko was induced in parental RPE1 cell line. RPE1 CHD1 ko cell population was single cell cloned. Isogenic cell lines displaying homozygous CHD1 ko were identified. DNA was extracted directly from the regenerated population (RPE1_1, low passage stage). Cells were further propagated through 45 generations, then high passage cell population was single cell cloned. DNA was extracted from two isogenic CHD1 ko clones (RPE1_2 and RPE1_3, high passage stage) after propagation. (B) Single Nucleotide Substitution (SBS) signatures, (C) Indel signatures, (D) Rearrangement signatures. The number of mutations indicated originate from the reconstructed mutational spectra.
We detected subclonal CHD1 loss in 27 out of 91 AA cases (29.7%), and 14 out of 109 (11%) EA cases indicating that CHD1 deletion is about three times more frequent in prostate tumors of AA men. Our FISH data confirmed the subclonal nature of CHD1 deletion in prostate cancer cells (Figure 1B). In most cases CHD1 deletion was present in only a subset of tumor cores (see Suppl. Table 1 for details). As a control, we performed FISH staining of PTEN and immunohistochemistry (IHC) staining of ERG in a subset of the cohort (42 AA and 59 EA prostate cancer cases) confirming previously described differences[3,4] (Suppl. Table 1).
Further analyses revealed a significant association between CHD1 deletion and pathologic stages and Gleason sum. Higher frequency of CHD1 deletion was detected in T3-4 pathological stage compared to T2 stage (P=0.043, Suppl. Table 1). Prostate cancer cases with higher Gleason sum scores (3+4, 4+3, 8-10) were seen more frequently in the CHD1 deletion group than in the non-deletion group (P<0.001). In contrast, lower Gleason sum score (3+3) was more often seen in non-deletion cases (P<0.001, table 1c). Notably, CHD1 deletion was strongly associated with rapid biochemical recurrence (Figure 1C) in AA cases (P<0.0001). The multivariate Cox model analysis showed that CHD1 deletion was an independent predictor of BCR in the entire cohort (P=0.0006) after adjusting for age at diagnosis, PSA at diagnosis, race, pathological tumor stage, grade group, and surgical margins. Moreover, a significant correlation between CHD1 deletion and metastasis was also detected in AA patients with Kaplan-Meier analysis (P=0.041). Following adjustment for age at diagnosis, PSA at diagnosis, race, pathological tumor stage, grade group, and surgical margins in the Cox proportional hazards model, CHD1 deletion was significantly associated with metastasis (P=0.047, Suppl. Figure 4). Taken together, our data strongly support the association of CHD1 deletions with aggressive prostate cancer and worse clinical outcomes in AA PC.

(A) Immunoblot shows that CHD1 was successfully knocked out in PC-3 cells. Sensitivity assays of parental wt and chd1 ko clones to PARP inhibitor Olaparib (B), Talazoparib (C), and the radiomimetics bleomycin sulfate (D). Cells viability was measured using PresoBlue ™ reagent. SD of triplicates are shown, p-values were calculated using student’s t-test. p-values <0.05 were considered statistically significant.
Estimating the frequency of subclonal CHD1 loss in next generation sequencing data of AA and EA prostate cancer
Previous publications characterizing the genome of AA prostate cancer cases [9,20] did not report an increased frequency of CHD1 loss as we observed in the FISH-based analysis presented above. Methods to detect copy number variations from WGS or WES data have at least two major limitations. First, subclonal copy number variations (sCNV) can be missed if they are present in fewer than 30%, of the cells[18]. Second, copy number loss can be underestimated with smaller deletions (e.g., <10 kb). Although various tools are available for inferring sCNVs from WES, WGS or SNP array data, such as TITAN[18], THetA[21], and Sclust[22], they are designed to work on the entire genome, and likely miss small (∼1-10kb) CNVs during the data segmentation process. In order to maximize the accuracy of our analysis we performed a gene focused analysis of the copy number loss in CHD1. We considered several factors such as the change in the normalized coverage in the tumors relative to their normal pairs’, the cellularity of the tumor genome, and the approximate proportion of tumor cells exhibiting the loss. We also evaluated whether the deletion was heterozygous or homozygous using a statistical method designed for calling subclonal loss of heterozygosity (LOH) events within a confined genomic region (details are available in the Materials and Methods section, and in the Supplementary Material).
Using this approach in a large cohort (N=530 cases; 59 AA WES, 18AA WGS, 408 EA WES and 45 EA WGS, for details see supplementary material and Suppl. Figures 5-28), we observed that CHD1 is more frequently deleted in AA tumors (N=20; 26%) than in EA tumors (N=73 EA; 16%). Taken together, when next generation sequencing based copy number variations were analyzed with a more sensitive method, CHD1 loss was detected more frequently in the AA cases than in the EA cases (p=0.029, Fisher exact test), which is consistent with our observations with FISH method in the TMA cohort.

(A) HRD-related markers and total number of structural variants in samples with mutations in SPOP, BRCA2 and loss in CHD1 versus the controls. Samples that simultaneously harbor mutations in SPOP and a loss in CHD1 tend to have higher markers. (B) Proportion of cells with intact CHD1 in SPOP mutants and samples identified with CHD1 loss. While the deletion in CHD1 in SPOP mutants is mostly clonal, in samples with wild type SPOP background it is mostly subclonal. The color-code for points in both panels A and B is illustrated in the bottom right corner of the figure.
CHD1 loss is associated with genomic signatures frequently observed in BRCA2 deficient prostate cancers
CHD1 loss was shown to reduce HR competence in cell line model systems[14,23]. Detecting and quantifying HR deficiency in tumor biopsies is currently best achieved by analyzing whole genome sequencing data for specific HR deficiency associated mutational signatures. Those include: 1) A single nucleotide variation based mutational signature (“COSMIC signatures 3[24] and SBS3[25]); 2) a short insertions/deletions based mutational profile, often dominated by deletions with microhomology, a sign of alternative repair mechanisms joining double-strand breaks in the absence of HR, which is also captured by COSMIC indel signatures ID6 and ID8[25] ; 3) large scale rearrangements such as non-clustered tandem duplications in the size range of 1-100kb (mainly associated with BRCA1 loss of function) or deletions in the range of 1kb-1Mb (mainly associated with BRCA2 loss of function)[26]. All of these signatures can be efficiently induced by the inactivation of BRCA1, BRCA2 or several other key downstream HR genes (Suppl. Figures 31-48) [27].
HR deficiency is also assessed in the clinical setting by a large scale genomic aberration based signature, namely the HRD score[28], which is also approved as companion diagnostic for PARP inhibitor therapy. Recently a composite mutational signature, HRDetect[29], combining several of the mutational features listed above was evaluated as an alternative method to detect HR deficiency in prostate adenocarcinoma[30]. In order to further strengthen the link between CHD1 loss, HR deficiency and potentially increased PARP inhibitor sensitivity we performed a detailed analysis on the mutational signature profiles of CHD1 deficient prostate cancer.
We analyzed whole exome and whole genome sequencing data of several prostate adenocarcinoma cohorts (For the detailed results see the Supplementary methods) containing samples both from AA (52 WES and 18 WGS cases) and EA (387 WES and 45 WGS cases) individuals in order to determine whether CHD1 loss is associated with the HRD mutational signatures.
We divided the cohorts into three groups: 1) BRCA2 deficient cases that served as positive controls for HR deficiency, 2) CHD1 deleted cases without mutations in HR genes (Supplementary Figures 22,25 and 29), and 3) cases without BRCA gene aberration or CHD1 deletion (for details see suppl material).
In the WGS cohorts CHD1 deficient cases showed increased HRD score relative to the control cases but lower than the BRCA2 deficient cases (Figure 2A). It is important to emphasize, however, that the HRD score was positively correlated with the estimated fraction of the subclonal loss of CHD1 (Figure 2A, Suppl. Figure 30-31), suggesting that the signal of HRD score was “diluted” likely due to subclonality. The most characteristic HRD associated single nucleotide variation signature (signature 3), was significantly increased in the BRCA2 deficient cases and slightly increased in the CHD1 deficient cases (Figure 2B).
The increase of the relative contribution of short indel signatures ID6 and ID8 to the total number of indels characteristic of loss of function on BRCA2 biallelic mutants was not observed in the CHD1 loss cases (Suppl. Fig. 36-39). This suggests, that the alternative end-joining repair pathways do not dominate the repair of DSBs in those cases.
In the WGS cohort we also determined the number of structural variants as previously defined (Suppl.Fig. 40)[26]. As expected, RS5 was significantly increased in the BRCA2 mutant cases since this signature (an increase in the number of non-clustered 1kb-1Mb deletions) was identified as a specific feature of such tumors. CHD1 deficient cases also displayed a significant increase in RS5 structural variations but the signal showed a strong subclonal dilution (Figure 2C) suggesting that the number of RS5 aberrations may be similar in the BRCA2 and CHD1 deficient cases. Finally, the BRCA2 deficient cases showed high HRDetect scores (Suppl. Figures 41-42). The HRDetect scores were also elevated relative to the controls but significantly lower than the previously published threshold for HR deficiency. However, since the HRDetect scores arise from a logistic regression, which involves the non-linear transformation of the weighted sum of its attributes, even slightly lower linear sums in the CHD1 loss cases compared to the BRCA2 mutant cases can result in substantially lower HRDetect scores (Suppl. Figure 43).
We have previously processed WES prostate adenocarcinoma data for the various HR deficiency associated mutational signatures[30]. When the CHD1 deficient cases were compared to the BRCA1/2 deficient and BRCA1/2 intact cases we obtained results that were consistent with the WGS based results outlined above (Suppl. Figures 44-49).
Deleting CHD1 in cell lines induce some aspects of homologous recombination deficiency-associated mutational signatures
In order to investigate the functional impact of the biallelic loss of CHD1 we created several CRISPR-Cas9 edited cell lines. DNA repair pathway aberration induced mutational signatures can be detected in cell lines by whole genome sequencing[27,31]. This analysis is more efficient if the starting cell line has a diploid genome, such as in the RPE1 (retinal pigment epithelium) cells in which we previously deleted CHD1 using CRISPR-Cas9 editing (Suppl. Figure 50) [14]. We grew single cell clones from these cell lines for 45 generations to accumulate the genomic aberrations induced by CHD1 loss (Suppl. Figures 51-64). Two of such late passage clones and an early passage clone were subjected to WGS analysis (Figure 3A). All the clones retained the BRCA2 wild type background of their parental clone.
CHD1 elimination induced some increase in SBS3 (HR deficiency associated) but more significant increase in SBS5, SBS18 (Figure 3B). Short indels flanked by microhomology (ID6 signature) constitute a robust sign of HR deficiency as a result of microhomology mediated-end joining (MMEJ) repair of DSBs in the absence of HR[32]. CHD1 loss did not induce a significant increase of this mutational signature. Instead, the most significant increase was observed in ID10 (Figure 3C). Large genomic rearrangement signatures showed a significant increase in RS5, the mutational signature strongly associated with BRCA2 loss, which was detected in prostate cancer cases with CHD1 deletion as shown in the previous section (Figure 3D).
Taken together, CHD1 loss in cell line model systems mainly induced deletions of 1-10 kb, but only modestly induced the other types of mutational signatures that are associated with the loss of key members of the HR machinery.
CHD1 deficient cell lines show increased sensitivity to talazoparib and the radiomimetic agent bleomycin
CHD1 deficient cancer cells have an increased sensitivity to the PARP inhibitor olaparib[14]. While this synthetic-lethal relationship is worth investigating, the olaparib sensitivity of CHD1-deficient is relatively mild. PARP inhibitors were initially thought to exert their therapeutic activity by inhibiting the enzymatic activity of PARP, but it was later revealed that trapped PARP on DNA may have a more significant contribution to cytotoxicity (reviewed in[33]). Therefore, we tested the efficacy of the strong PARP trapping agent talazoparib in the prostate cancer cell line PC-3 with or without CRISPR-Cas9-mediated CHD1 deletion. CHD1 knock out clones were identified by immunoblotting (Figure 4A). Consistent with previous reports, deleting CHD1 induced an approximately 5-fold increase in olaparib sensitivity (Figure 4B)[14]. In contrast, the sensitivity to talazoparib increased by about 15-20-fold in the same CHD1 deficient PC-3 cells (Figure 4C). These data suggest that trapped PARP may have a more toxic effect in cells with CHD1 deficiency.
Consistent with the significant functional evidence linking CHD1 deletion and HR repair of DSBs, CHD1 deficient cells also showed increased sensitivity to irradiation[14]. We investigated, whether this increased sensitivity also applies to chemotherapy agents that induce DSBs, such as radiomimetic drugs. As shown in Figure 4D, CHD1 deficient cells show significantly increased (5-fold) sensitivity to bleomycin, the most frequently used radiomimetic therapeutic agent.
The impact of SPOP mutations on the clonality of CHD1 deletions and HR deficiency associated mutational signatures
SPOP mutations and CHD1 deletions show a strong tendency to co-exist in prostate cancer[34] and SPOP mutations have been shown to suppress key HR genes[16]. Therefore, we investigated whether the presence of SPOP mutation in a CHD1 deficient prostate cancer is associated with a further increase of HR deficiency associated mutational signatures. We identified cases with SPOP mutations or CHD1 deletions only, cases with both SPOP mutations and CHD1 deletions and cases without either of those aberrations (Figure 5A). Cases with both mutations showed significantly higher levels of signature SBS3, RS5 and the total number of large-scale structural rearrangements relative to cases with either mutation alone. It should be noted, however, that the proportion of cells with CHD1 deletions tended to be significantly higher in SPOP mutant cases than those with CHD1 deletions without SPOP mutations. Thus, considering the previously demonstrated impact of CHD1 subclonality on the intensity of HR deficiency associated mutational signatures (Figure 2), it is possible that the presence of SPOP will intensify HR deficiency associated mutational signatures by enhancing the proportion of CHD1 deficient cells in a tumor (Figure 5B).
DISCUSSION
The presence of functionally relevant subclonal mutations in various solid tumor types is well documented[35,36]. Deletions present only in a minority of tumor cells are difficult to detect unless more targeted analytical approaches are applied. Here we present one example of such detection bias with significant functional relevance. We used a FISH based approach to detect CHD1 deletion in PC. Consistent with the previously described subclonal nature of CHD1 loss, we found that while this gene is often deleted in prostate cancer, it is rarely deleted in every tumor cell. When we took the subclonal nature of CHD1 loss into consideration a significant racial disparity emerged, with an approximately 3-fold increase in the frequency of CHD1 deletion in AA PC patients. This loss was also significantly associated with early biochemical recurrence. Since CHD1 loss is associated with a more malignant phenotype, the significantly higher frequency of CHD1 loss in AA PC may account for the diverging clinical course observed in PC between men of African and European Ancestry. It is possible that CHD1 loss is in fact more frequent in EA PC as well but with a lower focal density than in AA cases. This is certainly a limitation of our study, but with the sensitivity thresholds we established the difference between AA and EA are significant.
Several studies pointed out a potentially intimate link between CHD1 loss an homologous recombination deficiency[14,15,23]. Interestingly, CHD1 null cells showed only a modest (3-fold) increase in sensitivity to PARP inhibitor or platinum-based therapy[14,15,23]. This suggested that CHD1 loss may not lead to the same level or the same completeness of HR deficiency as that detected upon loss of function of BRCA1 or BRCA2. The loss of function of those key HR genes usually leads to various DNA repair deficiencies such as stalled fork destabilization or reduced capacity of DSB repair. The presence of those DNA repair deficiencies can often be detected by different types of DNA aberration profiles and they can be associated with an up to 1000-fold increase in PARP inhibitor sensitivity. The modest increase in PARP inhibitor sensitivity suggests that CHD1 loss may lead to some but not all DNA repair aberrations usually associated with loss of function of BRCA1/2. Indeed, CHD1 deficient tumors and cell line models displayed strong signals of the BRCA2 deficiency associated structural variation signature (SV5), but only modest or no increase of the single nucleotide variation or short indel based signatures. This suggests, that CHD1 loss “mimics” some but not all of the consequences of BRCA2 deficiency. The precise mechanistic nature of this similarity needs further biochemical studies.
Identification of synthetic lethal agents with CHD1 deficiency is expected to benefit those prostate cancer cases that harbor this aberration. In early clinical studies, patients with CHD1 deficient prostate cancer responded to PARP inhibitor and platinum-based therapy[23]. However, the subclonal nature of CHD1 loss we have highlighted here may have considerable clinical consequences. Tumors with CHD1 loss in a significant subset of the cells may show significant response to HR deficiency directed therapy. HR deficiency associated mutational signatures are used to prioritize ovarian cancer patients for PARP inhibitor therapy and a similar strategy may be considered for prostate cancer as well. However, as we showed here, the HR deficiency associated mutational signatures are “diluted out” proportionally to the subclonality of CHD1 loss. Therefore, diagnostic cut-off values may need to be readjusted for CHD1 deficient cases. If only a smaller subset of tumor cells harbor CHD1 deficiency, then a synthetic lethal agent may have only a modest benefit in terms of tumor shrinkage. However, as it was suggested recently, CHD1 loss may play a key role developing enzalutamide resistance[13]. Therefore, it is possible that eliminating the subset of CHD1 deleted tumor cells, even if a minority, will significantly delay antiandrogen therapy resistance. Moreover, the majority of specimens analyzed for CHD1 deletions in our study represent treatment naïve primary prostate tumor specimens. It would be reasonable to expect clonal expansion of CHD1 deleted tumor cells in more advanced heavily treated metastatic and castration resistant prostate cancers (CRPC), which calls for further analysis. Therefore, agents with higher specificity for CHD1 deficiency, such as talazoparib or bleomycin, may be used as agents to stave off resistance to antiandrogen therapy. Considering the higher frequency of CHD1 loss in AA PC, such CHD1 directed therapy may stop the early development of more malignant clones and may reduce the racial differences in the overall outcome of prostate cancer.
Materials and Methods
Cohort selection and Tissue Microarray (TMA) generation
The aggregate cohort was composed of 2 independently selected cohort samples from Bio-specimen bank of Center for Prostate Disease Research and the Joint Pathology Center. Wholemount prostates were collected from 1996 to 2008 with minimal follow-up time of 10 years. The first cohort of 42 AA and 59 EA cases was described before[6,37]. Similarly, the second cohort of 50 AA and 50 EA cases was selected based on the tissue availability (>1.0 cm tumor tissue) and tissue differentiation status (1/3 well differentiated, 1/3 moderately differentiated and 1/3 poorly differentiated). All the selected cases had the signed patient consent forms for tissue research applications. Patients who have donated tissue for this study also contributed to the long term follow-up data (mean 14.5 years). Our study was reviewed and approved by institutional review board (IRB) of WRNMMC and Uniformed Services University of the Health Sciences, Bethesda, MD. TMA block was assigned as 10 cases each slide and each case with 2 benign tissue cores, 2 Prostatic intraepithelial neoplasia (PIN) cores if available and 4-10 tumor cores covering the index and non-index tumors from formalin fixed paraffin embedded (FFPE) wholemount blocks. The description of numbers of patients, tumors and tumor cores of combined cohort was in Supplementary table 1d. All the blocks were sectioned into 8 µM tissue slides for FISH staining.
Fluorescence in situ hybridization (FISH) assay
A gene-specific FISH probe for CHD1 was generated by selecting a combination of bacterial artificial chromosome (BAC) clones (Thermo Fisher Scientific, Waltham, MA) within the region of observed deletions near 5q15-q21.1, resulting in a probe matching ca. 430 kbp covering the CHD1 gene as well as some upstream and downstream adjacent genomic sequences including the complete repulsive guidance molecule B (RGMB) gene. Due to the high degree of homology of chromosome 5-specific alpha satellite centromeric DNA to the centromere repeat sequences on other chromosomes, and the resulting potential for cross-hybridization to other centromere sequences, particularly on human chromosomes 1 and 19, a control probe matching a stable genomic region on the short arm of chromosome 5 – instead of a centromere 5 probe - was used for chromosome 5 counting (supplementary figure 1e). The FISH assay of CHD1 was performed on TMA as previously described[6]. The green signal was from probe detecting control chromosome 5 short arm and the red signal was from probe detecting CHD1 gene copy. The FISH stained TMA slides were scanned with Leica Aperio VERSA digital pathology scanner for further evaluation. The criteria for CHD1 deletion was that in over 50% of counted cancer cells (with at least 2 copies of chromosome 5 short arm detected in one tumor cell) more than one copy of CHD1 gene had to be undetected. Examining tumor cores, deletions were called when more than 75% of evaluable tumor cells showed loss of allele. Focal deletions were called when more than 25% of evaluable tumor cells showed loss of allele or when more than 50% evaluable tumor cells in each gland of a cluster of two or three tumor glands showed loss of allele. Benign prostatic glands and stroma served as built-in control.
The sub-clonality of CHD1 deletion was presented with a heatmap showing CHD1 deletion status in all the given tumors sampled from whole-mount sections of each patient. The color designations were denoted as: red color (full deletion) meaning all the tumor cores carrying CHD1 deletion within a given tumor, yellow color (sub-clonal deletion) meaning only partial tumor cores carrying CHD1 deletion within a given tumor and green color (no deletion) meaning no tumor core carry CHD1 deletion (supplementary table 1b).
Statistics Analysis
The correlations of CHD1 deletion and clinic-pathological features, including pathological stages, Gleason score sums, Grade groups, margin status, and therapy status were calculated using an unpaired t-test or chi-square test. Gleason Grade Groups were derived from the Gleason patterns for cohort from Grade group 1 to Grade group 5. Due to the small sample sizes within each Grade group, Grade group 1 through Grade group 3 were categorized as one level as well as Grade group 4 through Grade group 5. A BCR was defined as either two successive post-RP PSAs of ≥0.2 ng/mL or the initiation of salvage therapy after a rising PSA of ≥0.1 ng/mL. A metastatic event was defined by a review of each patient’s radiographic scan history with a positive metastatic event defined as the date of a positive CT scan, bone scan, or MRI in their record. The associations of CHD1 deletion and clinical outcomes with time to event outcomes, including BCR and metastasis, were analyzed by a Kaplan–Meier survival curves and tested using a log-rank test. Multivariable Cox proportional hazards models were used to estimated hazard ratios (HR) and 95% confidence intervals (Cis) to adjust for age at diagnosis, PSA at diagnosis, race, pathological tumor stage, grade group, and surgical margins. We checked the proportional hazards assumption by plotting the log-log survival curves. A P-value < 0.05 was considered statistically significant. Analyses were performed in R version 4.0.2.
Immunohistochemistry for ERG
ERG immunohistochemistry was performed as previously described[38]. Briefly, four ⍰m TMA sections were dehydrated and blocked in 0.6% hydrogen peroxide in methanol for 20 min. and were processed for antigen retrieval in EDTA (pH 9.0) for 30 min in a microwave followed by 30 min of cooling in EDTA buffer. Sections were then blocked in 1% horse serum for 40 min and were incubated with the ERG-MAb mouse monoclonal antibody developed at CPDR (9FY, Biocare Medical Inc.) at a dilution of 1:1280 for 60 min at room temperature. Sections were incubated with the biotinylated horse anti-mouse antibody at a dilution of 1:200 (Vector Laboratories) for 30 min followed by treatment with the ABC Kit (Vector Laboratories) for 30 min. The color was developed by VIP (Vector Laboratories,) treatment for 5 minutes, and the sections were counter stained by hematoxylin. ERG expression was reported as positive or negative. ERG protein expression was correlated with clinico-pathologic features.
Prostate cancer patients and specimens in the in-silico study cohorts
Evaluation of the self-declared ancestries
Since the available ancestry data were based on the self-assessment of the patients, and it was a crucial part of our study to identify the samples accurately, we have interrogated the genotypes of 3000 SNPs that are specific to one of the greater Caucasian, African and Asian ancestries, in each of the germline samples [39]. The data was collected into a single genotype matrix, the first two principal components of which was used to train a non-naïve Bayes classifier to differentiate between the three ancestries (details are available in the supplementary material, Supp. Figures 5-21).
Identification of local subclonal loss of CHD1 in prostate adenocarcinoma
The paired germline and tumor binary alignment (bam) files were analyzed using bedtools genomcecov (v2.28.0)[40], and their mean sequencing depths were determined. The coverage above and within the direct vicinity of CHD1 (chr5:98,853,485-98,930,272 in grch38 and chr5:98,190,408-98,262,740 in grch37) was collected in 50 bp wide bins into d-dimensional vectors (d_grch37 = 1447, d_grch38 = 1536) using an in-house tool and samtools (v1.6)[41], and were normalized using their corresponding mean sequencing depths. The linear relationship between the paired germline-tumor coverages were determined in the following form:
 where Cn is the normalized coverage of the germline sample and Ct is the normalized coverage of its corresponding tumor pair. The intercept (α) was used to ensure that the data was free of outliers, and the slope (β0) was used as a raw measure of the observable loss in the tumor. Similar slopes were calculated for 14 housekeeping genes in each of the sample-pairs, which were used to assess the significance of the loss (Supplementary Material).
The cellularity (c) of the tumors were estimated using sequenza[42] after the rigorous selection of the most reliable cellularity-ploidy pair offered by the tool as alternative solutions. In order to account for the uncertainty of the reported cellularity values, a beta distribution was fitted on the grid-approximated marginal posterior densities of c. These were used to simulate random variables to determine the proportion of the approximate loss of CHD1 in the tumors, by the following formula:
 Here, β ∼Normal (β0, σ), where σ is the standard error of β0, C ∼ Beta (s1, s2)where s1 and s2 are the fitted shape-parameters of the cellularity, and βt is the cellularity-adjusted slopes of the curve. The approximate level of loss in CHD1 is distributed as 1-βt (Further details are available in the supplementary materials, Suppl. Figures 22-27).
Local subclonal LOH-calling
The SNP variant allele frequencies (VAF) in the close vicinity of CHD1 in the tumor were collected with GATK HaplotypeCaller (v4.1.0) [43]. The coverage and VAF data were carefully analyzed in order to ensure that we are strictly focusing on regions that have suffered the most serious loss (e.g., if only a part of the gene were lost, the unaffected region was excluded from the analysis). By using the tumor cellularity (c) and the estimated level of loss in the tumor (βt), we assessed whether a heterozygous or a homozygous subclonal deletion is more likely to result in the observed frequency pattern (A detailed explanation is available in the supplementary notes, Suppl. Figure 30, Suppl. Tables 2-3).
Cell culture models
PC-3 prostate cell line was purchased from ATCC® and grown in RPMI 1640 (Gibco) supplemented with 10% FBS (Gibco). RPE1 WT and CHD1 knock out cells were provided by Jia Zhou as previously reported[14]. RPE1 cells were incubated in DMEM with 10% FBS at 37° C in 5% CO2, and regularly tested negative for Mycoplasma spp. contamination.
Stable CRISPR-Cas9 expressing isogenic PC-3 cell line generation
Full length SpCas9 ORF was introduced in PC-3 cell population by Lentiviral transduction using lentiCas9-Blast (Addgene #52962) construction. After antibiotics (blasticidin) selection, survival populations were single cell cloned, isogenic cell lines were generated and tested for Cas9 activity by cleavage assay.
Gene knock out induction
Generation of RPE1-CHD1-/- cells were reported previously[14]. CHD1 was targeted in CRISPR-Cas9 expressing PC-3 cell line using guide RNA CHD1_ex2_g1 (gCTGACTGCCTGATTCAGATC), resulting in PC-3 chd1 ko 1, and chd1 ko 2 homozygous loss cell lines.
Transfection
Cells were transiently transfected by Nucleofector® 4D device (Lonza) by using supplemented, Nucleofector® SF solution and 20 μl Nucleocuvette® strips following the manufacturer’s instructions. Following transfection, cells were resuspended in 100 μl culturing media and plated in 1.5 ml pre-warmed culturing media in a 24 well tissue culture plate. Cells were subjected to further assays 72 h post transfection.
In vitro T7 EndonucleaseI (T7E1) Assay
Templates used for T7E1 were amplified by PCR using CGTCAACGATGTCACTAGGC forward and ATGATTTGGGGCTTTCTGCT reverse oligos generating a 946 bp amplicon. 500 ng PCR products were denatured and reannealed in 1x NEBuffer 2.1 (New England Biolabs) using the following protocol: 95° C, 5 min; 95-85° C at −2° C/sec; 85-25° C at −0.1° C/sec; hold at 4° C. Hybridized PCR products were then treated with 10 U of T7E1 enzyme (New England Biolabs) for 30 min in a reaction volume of 30 μl. Reactions were stopped by adding 2 μl 0.5 M EDTA, fragments were visualized by agarose gel electrophoresis.
Immunoblot Analysis
Freshly harvested cells were lysed in RIPA buffer. Protein concentrations were determined by Pierce BCATM Protein Assay Kit (Pierce). Proteins were separated via Mini Protean TGX stain free gel 4-15% (BioRad) and transferred to polyvinilydene difluoride membrane by using iBlot 2 PVDF Regular Stacks (Invitrogene) and iBlot system transfer system (LifeTechnologies). Membranes were blocked in 5% BSA solution (Sigma). Primary antibodies were diluted following the manufacturer’s instructions: anti-Vinculin antibody (Cell Signaling) (1:1000) and antiCHD1 (Novus Biologicals) (1:2000). Signals were developed by using Clarity Western ECL Substrate (BioRad) and Image Quant LAS4000 System (GEHealthCare).
Sample preparation for Whole Genome Sequencing (WGS)
RPE1 DNA was extracted from WT and CHD1 knock out isogenic cell lines at low passage number of the cells. Following 45 passages, CHD1 knock out isogenic cell line was single cell cloned, and two colonies were propagated for DNA isolation.
DNA was extracted by using QIAamp DNA Mini Kit (QIAGENE). Whole Genome Sequencing of the DNA samples was carried out at Novogene and BGI service companies.
Viability cell proliferation assays
Exponentially growing PC-3 cell lines WT, CHD1 ko1, CHD1 ko2 were seeded in 96-well plates (1000 cells/well) and incubated for 36 hrs to allow cell attachment. Identical cell numbers of seeded paralel isogenic lines were verified by the Celigo Imaging Cytometer after attachment. Cells were exposed to Talazoparib (Selleckchem), Olaparib (MedChemExpress) and Bleomycin sulfate (Fisher Scientific) for 24 hrs, then kept in drug-free fresh media for 5 days until cell growth was determined by the addition of PrestoBlue (Invitrogen) and incubated for 2.5 hrs. Cell viability was determined by using the BioTek plate reader system. Fluorescence was recorded at 560 nm/590 nm, and values were calculated based on the fluorescence intensity. IC50 values were determined by using the AAT Bioquest IC50 calculator tool. P-values were calculated using student’s t-test. P-values <0.05 were considered statistically significant.
NGS analysis of the RPE1 whole genomes sequences
The reads of the four RPE1 WGS (1 parental and 3 CHD1 ko) were aligned to the grch37 reference genome using the bwa-mem[44] aligner. The resulting bam files were post-processed according to the GATK best-practices guidelines. Novel variants were called using Mutect2 (v4.1.0) by using the parental clone as “normal” and the CHD1 ko clones as “tumor” specimens[43]. These vcfs were converted into tab-delimited files and further analyzed in R. Annotation was performed via Intervar[45].
Data Availability
The Mayo Clinic whole genomes (Decker et al. 2016) are available at dbGaP under accession number phs001105.v1.p1, the DFCI whole genomes are deposited under accession number phs000661.v1.p. The TCGA whole genomes and whole exomes are available through the ICGC and GDC data portals respectively.
Disclaimer
The contents of this publication are the sole responsibility of the author(s) and do not necessarily reflect the views, opinions or policies opinions of Uniformed Services University of the Health Sciences (USUHS), the Henry M. Jackson Foundation for the Advancement of Military Medicine, Inc., the Department of Defense (DoD) or the Departments of the Army, Navy, or Air Force. Mention of trade names, commercial products, or organizations does not imply endorsement by the U.S. Government.
Acknowledgement
The authors thank Zita Bratu for technical assistance, Alimamy Bundu and Treissy Soares for FISH probe preparation and testing, Dr. Hua Zou, Audrey Flores and Safaa Khairi for valuable experimental support, and Orsolya Pipek for the technical support.
This work was supported by the Research and Technology Innovation Fund (KTIA_NAP_13-2014-0021 and NAP2-2017-1.2.1-NKP-0002); Breast Cancer Research Foundation (BCRF-17-156 to Z. Szallasi) and the Novo Nordisk Foundation Interdisciplinary Synergy Program Grant (NNF15OC0016584), Det Fri Forskningsrad (award number #7016-00345B; to Z. Szallasi); Department of Defense through the Prostate Cancer Research Program (award number is W81XWH-18-2-0056; to Z. Szallasi, A. Dobi and M.L. Freedman). Z. Szallasi, Z. Sztupinszki and J. Borcsok were supported by Velux Foundation 00018310 grant. S.K. is supported by the Prostate Cancer Foundation (18YOUN09 and 19CHAL07).
References


