
Abstract
Background Herpes simplex virus type 2 (HSV-2) infection is a prevalent sexually transmitted infection with a sizable disease burden that is highest in sub-Saharan Africa. This study aimed to characterize HSV-2 epidemiology in this region.
Methods Cochrane and PRISMA guidelines were followed to systematically review, synthesize, and report HSV-2 related findings. Meta-analyses and meta-regressions were conducted.
Findings From 218 relevant publications, 451 overall outcome measures and 869 stratified measures were extracted. Pooled incidence rates ranged between 2.4-19.4 per 100 person-years across populations. Pooled seroprevalence was lowest at 37.3% (95% confidence interval (CI): 34.9-39.7%) in general populations and high in female sex workers and HIV positive individuals at 62.5% (95% CI: 54.8-70.0%) and 71.3% (95% CI: 66.5-75.9%), respectively. In general populations, pooled seroprevalence increased steadily with age. Compared to women, men had a lower seroprevalence with an adjusted risk ratio (ARR) of 0.61 (95% CI: 0.56-0.67).
Seroprevalence decreased in recent decades with an ARR of 0.98 (95% CI: 0.97-0.99) per year. Seroprevalence was highest in Eastern and Southern Africa. Pooled HSV-2 proportion in genital ulcer disease was 50.7% (95% CI: 44.7-56.8%) and in genital herpes it was 97.3% (95% CI: 84.4-100%).
Interpretation Seroprevalence is declining by 2% per year, but a third of the population is infected. Age and geography play profound roles in HSV-2 epidemiology. Temporal declines and geographic distribution of HSV-2 seroprevalence mirror that of HIV prevalence, suggesting sexual risk behavior has been declining for three decades. HSV-2 is the etiological cause of half of GUD and nearly all genital herpes cases.
Funding This work was supported by pilot funding from the Biomedical Research Program at Weill Cornell Medicine in Qatar and by the Qatar National Research Fund [NPRP 9-040-3-008].
Introduction
Herpes simplex virus type 2 (HSV-2) infection is a highly prevalent sexually transmitted infection (STI) worldwide.(1) It is a leading cause of genital ulcer disease (GUD) and genital herpes, manifesting in the form of painful, recurrent, and frequent genital lesions.(2–8) Its vertical transmission from mother-to-child can lead to neonatal herpes, a severe and sometimes fatal outcome in newborns.(3, 9) HSV-2 is linked to a 3-fold increase in sexual transmission and acquisition of HIV,(10–12) implying a potential epidemiological synergy between the two viruses.(11, 13, 14)
HSV-2 is typically asymptomatic in most of those who acquire it.(3) This trait coupled with HSV-2’s chronic and reactivating nature, as well as its subclinical shedding,(15, 16) increases its rate of transmission and leads to high antibody prevalence (seroprevalence) among general and higher-risk populations alike.(11, 17, 18) Since HSV-2 is more transmissible than HIV and produces long-lasting antibodies, it has been used as an objective biological marker of sexual risk behavior and risk of HIV infection.(19–23) Analyses using empirical data and mathematical modeling supported the utility of using HSV-2 seroprevalence to predict HIV epidemic potential.(19, 20, 24)
Inadequate understating of HSV-2 epidemiology and its considerable consequences on sexual and reproductive health and the HIV epidemic,(11, 13) calls for urgent preventive and control measures to tackle it. The World Health Organization (WHO) outlined a “Global Health Sector Strategy on STIs”(25) that sets goals to eliminate STIs as a main public health concern by 2030 through integration of preventive and control measures. Consequently, WHO, along with their global partners, are spearheading efforts to develop an HSV vaccine as an urgent priority.(26, 27)
To inform these efforts, we conducted a systematic review to characterize HSV-2 infection levels and trends in sub-Saharan Africa (SSA), the hub of the HIV epidemic.(28, 29) We estimated pooled means for each outcome measure (incidence rate, seroprevalence, proportion of HSV-2 in GUD, and proportion of HSV-2 in genital herpes) across populations and subpopulations. We also conducted meta-regression analyses to assess temporal trends and identify predictors of high seroprevalence and between-study heterogeneity.
Methodology
Data sources and search strategy
This systematic review was guided by the Cochrane Collaboration Handbook(30) and was reported according to the Preferred Reporting Items for Systematic Reviews and Meta-analyses (PRISMA) guidelines(31) which can be found in Table S1. The review was informed by the methodology applied recently in a series of systematic reviews for HSV-1 infection.(32–36)
All available publications were systematically reviewed up to August 23, 2020. The search was conducted in PubMed and Embase databases, using search strategies with exploded MeSH/Emtree terms, broad search criteria, and no language or year restrictions to widen the scope and include all subheadings (Table S2). The definition of Africa included 45 countries, as defined by the WHO for the African Region,(37) covering countries of sub-Saharan Africa. The list of countries and their subregional stratification is in Box S1.
Study selection and eligibility criteria
Search results were imported into the reference manager Endnote (Thomson Reuters, USA), whereby duplicate publications were identified and removed. The remaining records were screened for relevance based on titles and abstracts, followed by full text screening of relevant and potentially relevant records. Additional bibliography screening was performed on both reviews and the relevant articles to identify any missing publications.
Inclusion criteria were met if publications reported primary data on any of the following four outcomes: 1) HSV-2 incidence rate, 2) HSV-2 seroprevalence, 3) proportion of HSV-2 detection in GUD, and 4) proportion of HSV-2 detection in genital herpes. A sample size of ≥10 was required for inclusion for all outcome measures. Exclusion criteria encompassed case reports, series, commentaries, reviews, and qualitative studies. In this review, “publication” refers to a document reporting any outcome measure, whilst a “study” refers to details of a specific outcome measure. Special care was given to ensure that overlapping studies were only included once and not in duplicate.
Data extraction and synthesis
Data extraction and double extraction were performed by MH and FA independently. A list of extracted variables is in Box S2.
Overall outcome measures and their stratified measures were extracted, provided the stratification agreed with a pre-set stratification hierarchy and the subsample in each stratum was ≥10. The pre-set stratification hierarchy sequence for incidence and seroprevalence measures was as follows: population type (see Box S3 for definition), sex, and age. As for proportion of HSV-2 detection in GUD and genital herpes, the sequence was: genital herpes episode status (primary versus recurrent episode), sex, age, and study site (hospital versus outpatient clinic).
Measures reporting any HSV-2 outcome among children <15 years old were only reported, and not included in the analyses.
Quality assessment
Relevant studies were subjected to a pre-quality assessment to evaluate the validity of the assays used, given their limitations.(38, 39) This assessment was done with the help of an expert from the University of Washington, Professor Rhoda Ashley-Morrow. Only studies with valid, sensitive, and specific assays were included in the review. These studies were then evaluated using the Cochrane approach for risk of bias (ROB) assessment.(30) Study’s precision was classified into low versus high based on the study sample size (<100 versus ≥100).(40) Studies were classified into low versus high ROB using two quality domains: sampling method (probability versus non-probability based sampling) and response rate (≥80% versus <80% or unclear). Effect of ROB on study outcome was investigated through meta-regression as noted below.
Meta-analyses
Pooled mean estimates for all four outcomes were calculated across all strata using meta-analyses, provided each stratum had ≥3 measures.
Only studies reporting incidence rate by person-time were included in the meta-analyses. Log transformed incidence rates were used to calculate pooled estimates using the inverse variance method in the metarate function.(41, 42)
HSV-2 seroprevalence measures and proportion of HSV-2 detection in GUD and in genital herpes were each pooled using the DerSimonian-Laird random-effects model,(41) applying the Freeman-Tukey double arcsine transformation to stabilize the variance,(43) and factoring knowledge of the applicability of this transformation.(44)
Existence of heterogeneity in effect size was assessed using Cochran’s Q statistic.(41, 45) Magnitude of between-study variation attributed to true difference in effect size, as opposed to chance, was measured using I2.(41, 45) Distribution of true measures around the pooled mean was described using the prediction interval.
Meta-analyses were conducted in R version 3.4.1(46) using the meta package.(42)
Meta-regressions
Univariable and multivariable random-effects meta-regression analyses were conducted using log transformed seroprevalence measures to examine factors and predictors potentially associated with increased HSV-2 seroprevalence, as well as sources of between-study heterogeneity. Pre-set variables included in these analyses are listed in Box S4.
Factors included in the multivariable models had to have a p-value<0.1 in the univariable model. Strength of evidence for an association was deemed significant for factors with a p-value<0.05 in the multivariable models.
Meta-regressions were conducted in Stata/SE version 13(47) using the metareg package.(48)
Role of the funding source
The funder of the study had no role in study design, data collection, data analysis, data interpretation, or writing of the article. The corresponding author had full access to all the data in the study and had the final responsibility for the decision to submit for publication.
Results
Search results and scope of evidence
Figure 1 depicts the PRISMA flow chart describing the study selection process.(31) A total of 14,830 citations were captured in the initial search (2,039 from PubMed and 12,791 from Embase). After deduplication, title and abstract screening, and full text screening, relevant publications were identified. Thirteen additional publications, including country level reports, were identified through bibliography screening.(49–61)

Flow chart of article selection for the systematic review of HSV-2 infection in sub-Saharan Africa, per the PRISMA guidelines.(31)
In total, 218 publications met the inclusion criteria. Extracted measures encompassed 47 seroconversion rates, 48 overall (65 stratified) incidence rates, 322 overall (773 stratified) seroprevalence measures, 25 overall (31 stratified) proportions of HSV-2 detection in GUD, and 9 overall (11 stratified) proportions of HSV-2 detection in genital herpes.
Incidence overview and pooled mean estimates for HSV-2 incidence rate
Table S3 summarizes extracted seroconversion and incidence rates. Studies were either longitudinal cohorts (number of measures (n)=35; 49.2%) or randomized controlled trials (n=36; 50.7%), with a follow-up duration ranging between 6 weeks to 6 years. HSV-2 seroconversion rates (n=47) ranged between 0.0-58.0% across studies, reflecting in part the widely variable duration of follow-up.
In general populations, HSV-2 incidence rates among women (n=20) ranged between 3.6-21.7 per 100 person-years with a median of 7.5 and a pooled mean of 7.2 (95% confidence interval (CI): 5.5-9.4) per 100 person-years (Table 1). Among men (n=20), incidence rate ranged between 1.5-10.5 per 100 person-years with a median of 5.5 and a pooled mean of 4.1 (95% CI: 3.1-5.3) per 100 person-years. Higher incidence rates were found in higher risk populations. A summary of pooled mean incidence rate by population type and associated forest plots are in Table 1 and Figure S1, respectively.
Pooled mean estimates for herpes simplex virus type 2 incidence rate among different populations in sub-Saharan Africa.
Prevalence overview
Tables S4, S5, S6, S7, and S8 summarize (the overall) seroprevalence measures (n=322) across the subregions of SSA. Half the studies were published after the year 2010 (n=176; 55.5%), and most were based on cross-sectional study design (n=202; 62.7%) and convenience sampling (n=233; 72.4%).
For the stratified seroprevalence measures, HSV-2 seroprevalence among general population women (n=290) ranged between 0.1-97.4% with a median of 43.1%, and among general population men (n=186) between 0.0-84.2% with a median of 27.5% (Table 2).
Pooled mean estimates for herpes simplex virus type 2 seroprevalence among the different at risk populations in sub-Saharan Africa by sex.
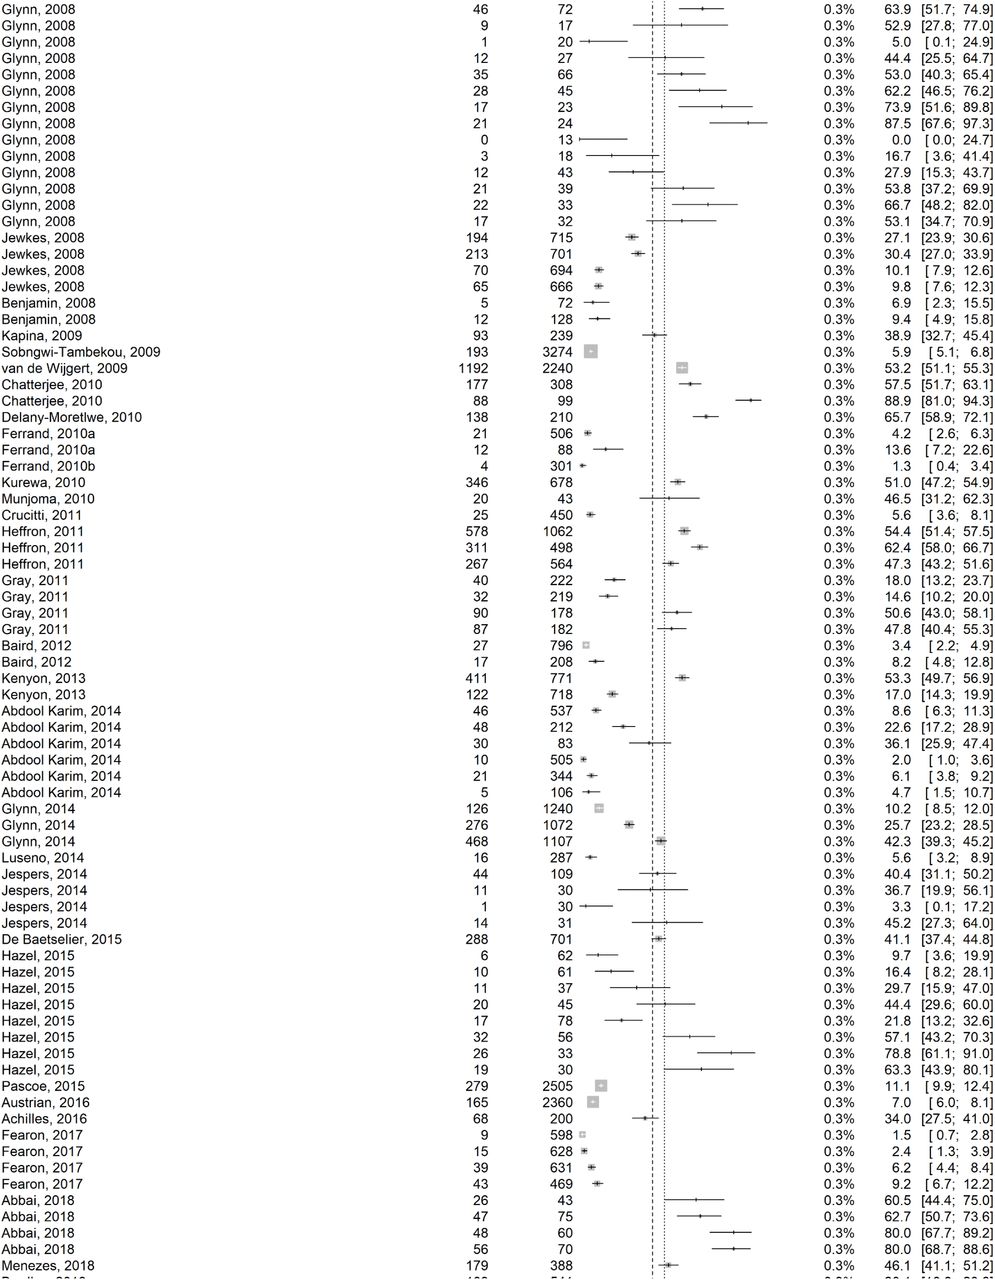
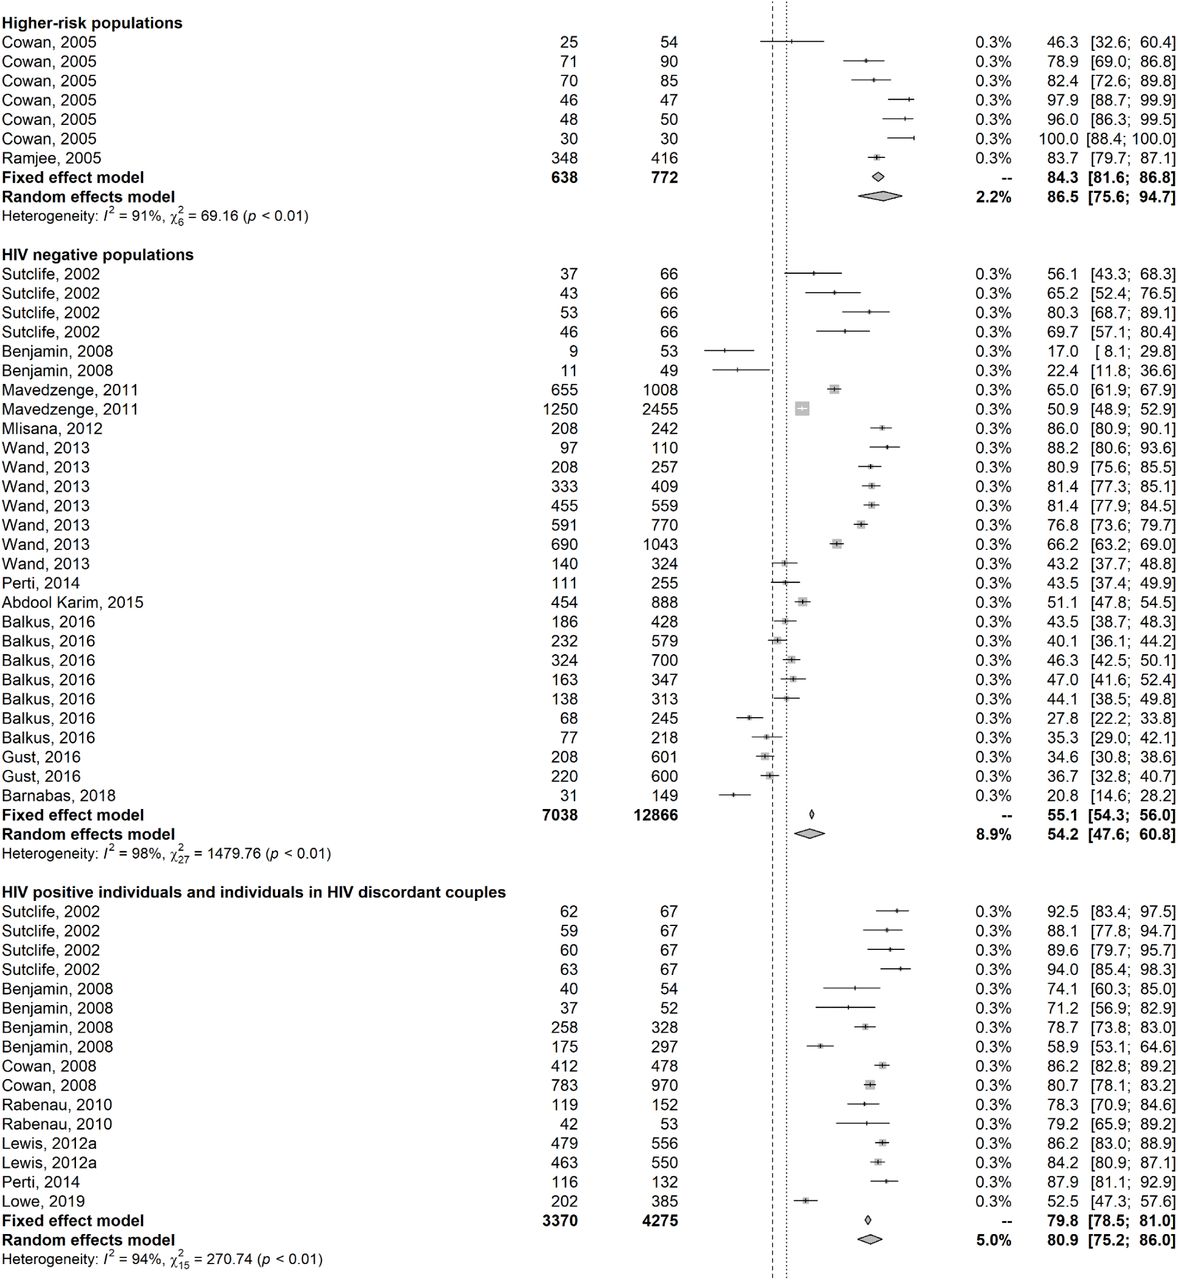
In higher-risk populations (n=40), almost all studies were conducted among female sex workers (FSWs; n=39) with seroprevalence ranging between 4.3-99.0% with a median of 65.0% (Table 2). High seroprevalence was observed in HIV positive individuals and in individuals in HIV discordant couples, ranging between 42.0-95.2% with a median of 79.7% among women (n=20), and between 44.0-94.2% with a median of 61.4% among men (n=15).
Tables 2, 3, and S9 summarize HSV-2 seroprevalence measures for further populations and subpopulations, including by population type, country, subregion, age, sex, and year of publication.
Pooled mean estimates for herpes simplex virus type 2 seroprevalence among general populations in sub-Saharan Africa.
Pooled mean estimates for HSV-2 seroprevalence
Tables 2, 3, and S9 show results of seroprevalence meta-analyses across populations and subpopulations. Pooled mean seroprevalence was lowest at 37.3% (95% CI: 34.9-39.7%) in general populations (n=507), followed by 47.4% (95% CI: 43.2-51.5%) in HIV negative populations (n=51), 57.1% (95% CI: 50.1-63.9%) in intermediate-risk populations (n=45), 61.2% (95% CI: 56.5-65.9%) in STI clinic attendees and symptomatic populations (n=72), 61.4% (95% CI: 53.4-69.1%) in higher-risk populations (n=40; mainly FSWs), and 71.3% (95% CI: 66.5-75.9%) in HIV positive individuals and in individuals in HIV discordant couples (n=42; Table 2).
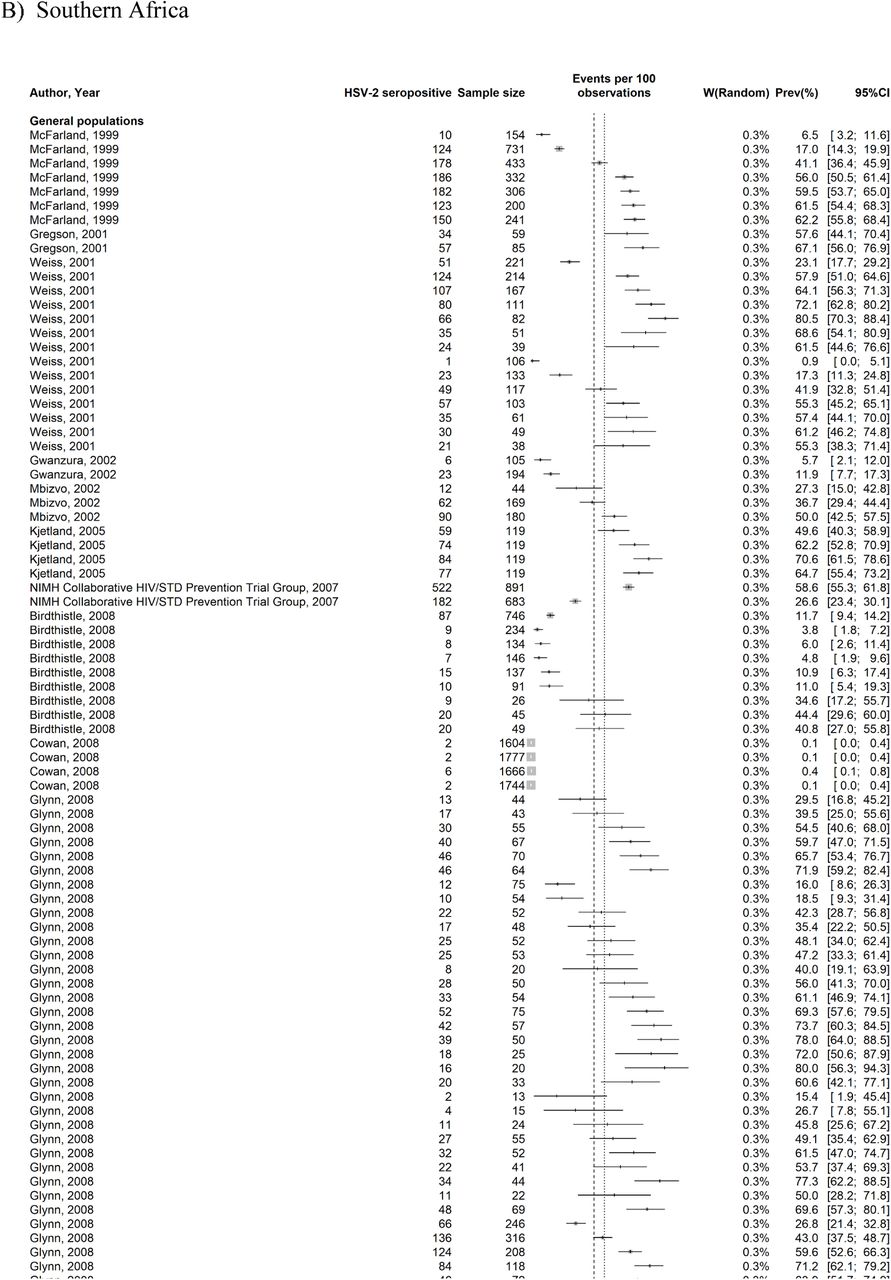
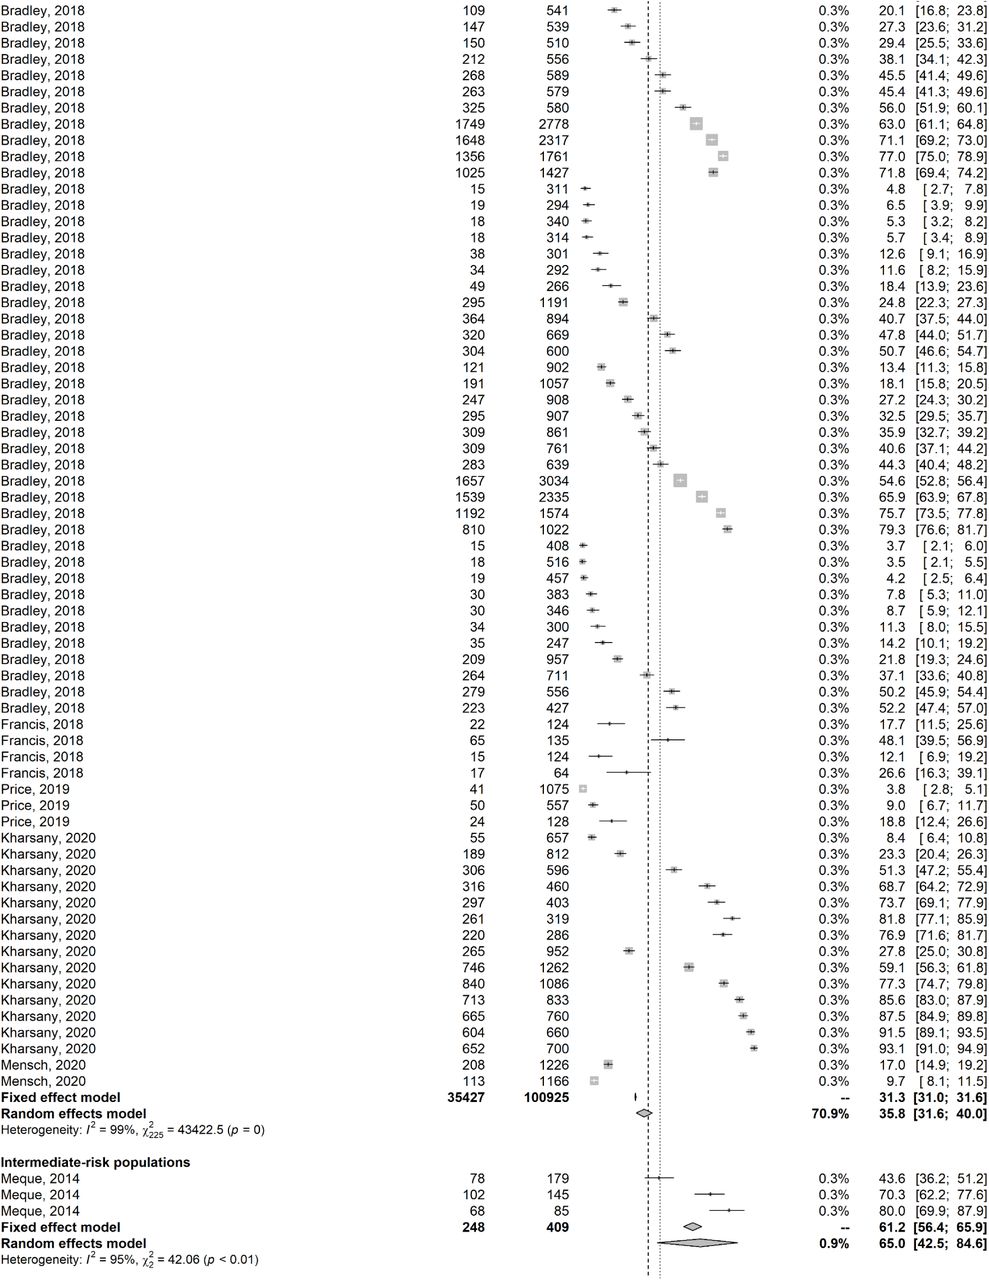
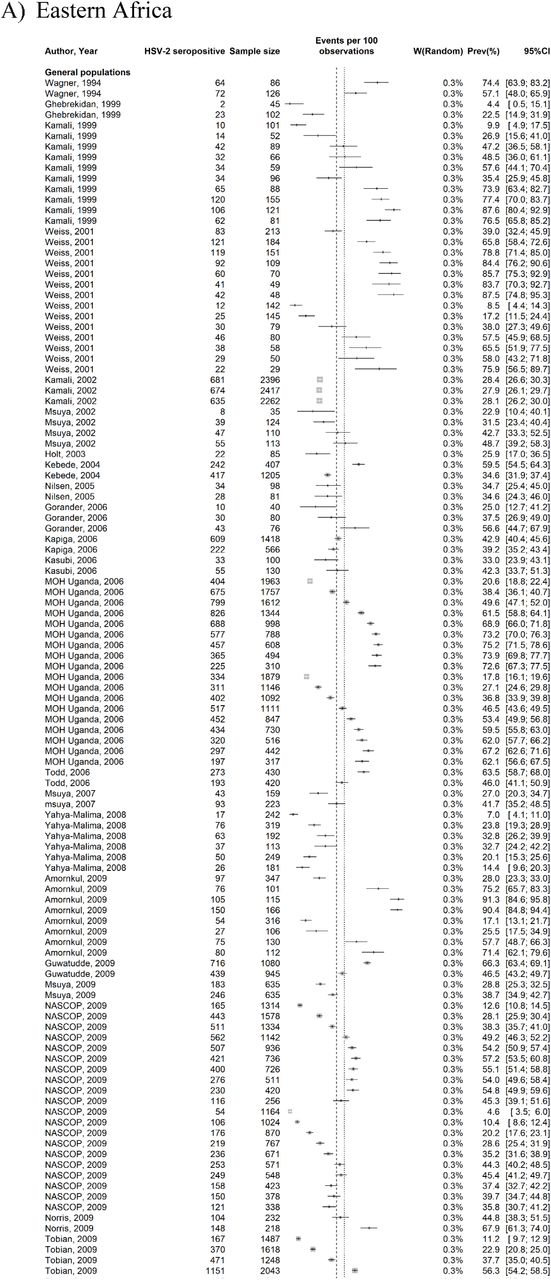
Among general populations, the pooled mean seroprevalence varied across African subregions (Table 3), with the lowest being 25.0% (95% CI: 20.9-29.4%) in Western Africa (n=68), followed by 35.8% (95% CI: 31.6-40.0%) in Southern Africa (n=226), 41.9% (95% CI: 38.4-45.3%) in Eastern Africa (n=188), and 52.4% (95% CI: 40.4-64.3%) in Central Africa (n=25). Similar hierarchy was observed across subregions for women and men, with women having consistently higher pooled mean seroprevalence compared to men (Table S9).
Across age groups (Table 3), pooled mean seroprevalence increased gradually from 12.4% (95% CI: 10.6-14.3%) in those <20 years-old (n=88), followed by 34.2% (95% CI: 30.7-37.8%) in those 20-30 years-old (n=112), 57.1% (95% CI: 54.8-63.3%) in those 30-40 years-old (n=69), 64.6% (95% CI: 59.5-69.5%) in those 40-50 years-old (n=48), to then decrease slightly to 58.2% (95% CI: 50.3-65.9%) in those >50 years-old. A similar trend was observed across age groups for each of women and men, but seroprevalence grow faster with age for young women (Table S9).
Heterogeneity was evident in almost all meta-analyses (p-value<0.001), and was confirmed by the wide prediction intervals (Tables 2, 3, and S9). Most heterogeneity was attributed to true variation in seroprevalence rather than chance (I2>50%). Forest plots for meta-analyses across African subregions stratified by population type are in Figure S2.
Predictors of HSV-2 seroprevalence
Table 4 shows results of the meta-regression analyses for HSV-2 seroprevalence. Nine variables were eligible for inclusion in the multivariable model (p-value<0.1 in univariable analysis). Two multivariable models were conducted, one including year of publication as a categorical variable and one including it as a linear term.
Univariable and multivariable meta-regression analyses for herpes simplex virus type 2 seroprevalence in sub-Saharan Africa.
The model including year of publication as a categorical variable explained 57.5% of seroprevalence variation and included population type, age group, sex, African subregion, country’s income, assay type, sampling method, response rate, and year of publication category (Table 4). Compared to general populations who had the lowest seroprevalence, seroprevalence was highest in HIV positive individuals and in individuals in HIV discordant couples [adjusted risk ratio (ARR) of 2.17 (95% CI: 1.78-2.65)], followed by STI clinic attendees and symptomatic populations, higher-risk populations, intermediate-risk populations, and HIV negative populations.
Compared to women, men had a 0.61-fold (95% CI: 0.56-0.67) lower seroprevalence. Seroprevalence increased rapidly with age at young age, but the increase plateaued by age 40-50 years. Seroprevalence was highest in Eastern Africa, followed by Southern Africa, Central Africa, and lowest in Western Africa. Country’s income was not associated with seroprevalence.
Studies that had a lower or unknown response rate had a higher seroprevalence. Meanwhile, assay type, study sample size, and study sampling method were not associated with seroprevalence.
Compared to those published before the year 2005, studies published in 2006-2015 [ARR of 0.85 (95% CI: 0.76-0.96)] and after 2015 [ARR of 0.80 (95% CI: 0.69-0.93)] had lower seroprevalence.
The model including year of publication as a linear term (Table 4) showed similar results and indicated declining seroprevalence with time [ARR of 0.98 (95% CI: 0.97-0.99)]. The model explained 57.5% of seroprevalence variation
Sensitivity analyses including year of data collection as a categorical variable or as a linear term (in replacement of year of publication) arrived at similar results (Table S10).
Overview and meta-analyses of HSV-2 isolation in genital ulcer disease and in genital herpes
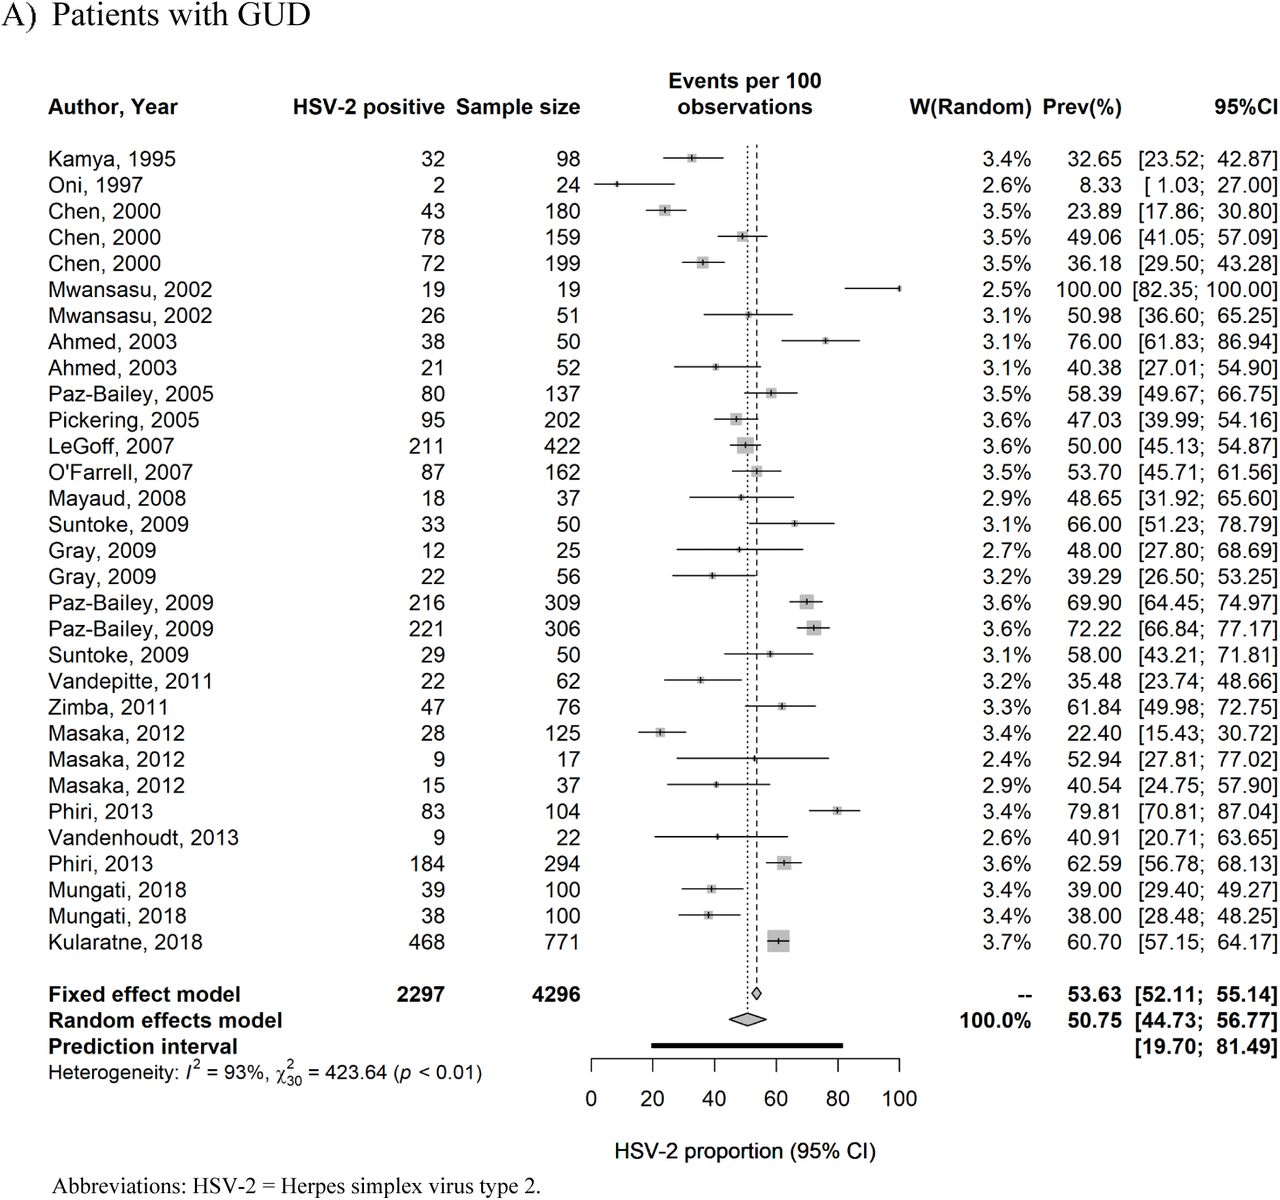
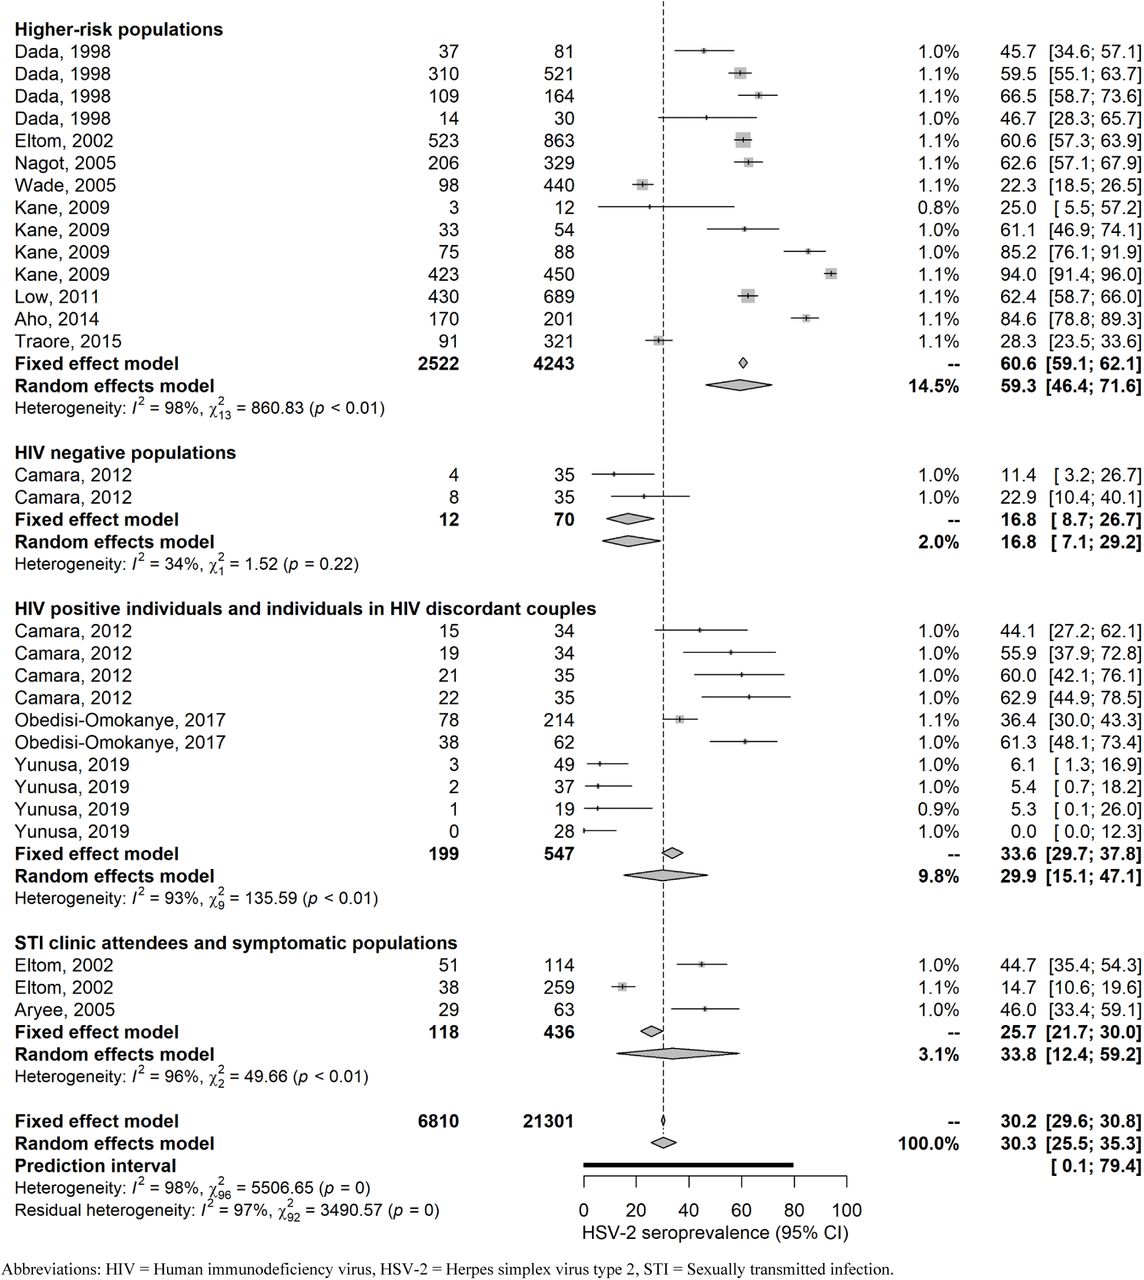
Table S11 summarizes extracted proportions of HSV-2 detection in GUD and in genital herpes. In GUD cases (n=31), proportion of HSV-2 detection ranged between 8.3-100% with a median of 49.1% and a pooled mean proportion of 50.7% (95% CI: 44.7-56.8%) (Table 5). Among women (n=8), it ranged between 35.0-100% with a median of 49.5% and a pooled proportion of 59.0% (95% CI: 44.7-72.6%), and among men (n=13), it ranged between 8.3-72.2% with a median of 49.1% and a pooled proportion of 47.3% (95% CI: 37.2-57.5%).
Pooled proportions of herpes virus type 2 (HSV-2) virus isolation in clinically-diagnosed GUD and in clinically-diagnosed genital herpes in Africa.
In genital herpes cases (n=11), proportion of HSV-2 detection ranged between 53.0-100% with a median of 100% and a pooled mean proportion of 97.3% (95% CI: 84.4-100%) (Table 5). No study distinguished between primary and recurrent genital herpes episodes.
These meta-analyses showed evidence of heterogeneity (p-value<0.001, I²>50%, and wide prediction intervals). Forest plots are in Figure S3.
Quality assessment
Quality assessment of diagnostic methods excluded 51 publications due to potential issues in the implemented diagnostic assays. Quality assessment of included seroprevalence measures is summarized in Table S12. Briefly, 288 studies (89.4%) had high precision, 88 studies (27.3%) and 85 studies (26.4%) had low ROB in the sampling method and in the response rate domains, respectively. Twenty-three studies (7.1%) had high ROB in both quality domains.
Discussion
This systematic review presented a detailed assessment of HSV-2 epidemiology in sub-Saharan Africa. Strikingly, the results demonstrate that HSV-2 seroprevalence has been declining by about 2% per year over the last three decades (Table 4). This decline is in line with the observed declines in HIV epidemics in SSA during the same timeframe.(62) Drivers of the decline in HIV prevalence have been subject to debate, with various mechanisms posited including natural epidemic dynamics,(63) increased HIV-associated mortality,(64, 65) impact of interventions,(65) heterogeneity in host susceptibility to HIV infection,(66, 67) and reductions in sexual risk behavior.(65, 68–71) Considering that HSV-2 seroprevalence has been shown to provide an objective proxy biomarker of population-level sexual risk behavior,(19–24) our finding of rapidly declining HSV-2 seroprevalence suggests that sexual risk behavior has been declining, and that this decline has reduced the transmission of both HIV and HSV-2 infections. With evidence of HSV-2 infection increasing risk of HIV acquisition and transmission,(10–13) it remains to be seen whether the declining HSV-2 incidence may have also contributed to the declines seen in HIV incidence in SSA.
Despite declining HSV-2 transmission in SSA, incidence rate is still high (Table 1), and much higher than that found elsewhere in the world.(1) For instance, the incidence rate in the United States (<1 per 100 person-years)(72) is an order of magnitude lower than that in SSA. The results further demonstrate that age plays a profound effect in HSV-2 epidemiology—age alone accounted for 30% of the seroprevalence variation (Table 4). HSV-2 infection in SSA is typically acquired at a young age not long after sexual debut, especially so for women, manifesting in a rapidly increasing seroprevalence with age before plateauing at high levels by ages 40-50 (Tables 1, 3, 4, and S9).
Population risk classification was also found to play an important role in HSV-2 epidemiology, accounting for 13% of seroprevalence variation (Table 4). Both incidence rate and seroprevalence were found at much higher levels in specific at-risk populations, such as female sex workers (Tables 2 and 4), with both measures displaying the “classical hierarchy” of STI exposure by sexual risk behavior, also seen with other STIs.(73, 74) Despite its prominence amongst higher risk populations, HSV-2 infection is also widely disseminated in SSA with high levels of infection even in the lower risk general population where over a quarter of men and nearly half of women are infected (Tables 2 and 4).
Although HSV-2 seroprevalence is high everywhere in SSA, there are still considerable variations by subregion. Infection levels were highest in Eastern Africa followed by Southern Africa, Central Africa, and lowest in Western Africa (Table 4). Incidentally, this pattern is also seen for HIV infection with Eastern Africa and Southern Africa being most affected and Western Africa least affected.(75, 76) This further suggests a strong link between HSV-2 and HIV epidemiologies,(24) reflecting a similar mode of transmission and hinting at a biological/epidemiological synergy.(10–14) The results further demonstrate that women are almost twice as likely to be infected as men (Table 4), reflecting a higher bio-anatomical susceptibility to the infection.(77, 78)
Another finding of this study is that HSV-2 infection is the cause of half of GUD cases in SSA (Table 5), confirming that this infection is the main cause of this disease in this part of the world where nearly 60 million individuals are estimated to be affected with HSV-related GUD.(79)
Although HSV-2 seroprevalence is declining (Table 4), it will likely remain the main cause of GUD in SSA, as other causes such as syphilis have also been declining.(80, 81) HSV-2 infection (as opposed to HSV-1 infection) was also found to account for nearly all cases of genital herpes (>97%; Table 5). This finding is presumably due to the nature of HSV-1 being widely acquired in childhood in SSA through oral transmission,(33) and distinguishes this region from other global regions where there is an increasing role for HSV-1 in genital herpes,(33–36) with some countries already observing HSV-1 as the cause of a large proportion of cases of genital herpes.(33–36)
This study had limitations, principally the unavailability of data for 15 of 45 African countries. There was also less data for Central and Western Africa than for Eastern and Southern Africa, in addition to data for seroprevalence eclipsing those of GUD and genital herpes. Despite these limitations, a large volume of data was available to sufficiently power an array of analyses. Included studies exhibited heterogeneity (Tables 2, 3, and S9); however, more than half of this heterogeneity (57%) was subsequently explained through meta-regressions (Table 4). Studies differed by assay type, sample size, sampling method, and response rate, yet none of these study characteristics appeared to affect seroprevalence with the exception of response rate where studies with lower or unknown response rate had a higher seroprevalence (Table 4). Overall, these limitations should not pose a barrier to the critical interpretation of this study’s results, or its findings.
Conclusions
In conclusion, HSV-2 seroprevalence is declining rapidly in SSA. Yet, HSV-2 incidence and seroprevalence remain at high levels, with over a third of the population being infected. Age and subregion within SSA play a critical role in HSV-2 epidemiology and explain much of the observed variation in seroprevalence. The geographical distribution of this infection was also found to be similar to that of HIV infection, and the declines in HSV-2 seroprevalence mirrored those for HIV prevalence. These findings suggest that the declines in both infections were driven by reductions in sexual risk behavior following the massive expansion of the HIV epidemic in this continent, and may suggest that some of the declines in HIV incidence could have been attributed to the declines in HSV-2 incidence. HSV-2 infection was found to be the etiological cause of half of GUD cases in this region, and virtually all cases of genital herpes. These findings demonstrate the urgent need for both prophylactic and therapeutic HSV-2 vaccines to tackle the disease burden of this infection,(82) and argue for further acceleration of ongoing efforts for vaccine development.(26, 27, 83)
Data Availability
All relevant data are available within the manuscript and its supplementary materials.
Contributors
MH and FAH conducted the systematic search, data extraction, and data analysis. MH wrote the first draft of the paper. CJ and KJL contributed to the systematic search, data extraction, and interpretation of the results. LJA conceived the study and led the data extraction and analysis and interpretation of the results. All authors contributed towards drafting and revising the manuscript.
Declaration of interests
MH, FAH, CJ, and LJA declare no competing interests. KL is currently funded by GlaxoSmithKline (GSK) for a gonorrhea vaccine modeling project.
Preferred Reporting Items for Systematic Reviews and Meta-analyses (PRISMA) checklist.(1)
Data sources and search criteria for systematically reviewing HSV-2 epidemiology in sub-Saharan Africa.
List of the 45 countries included in our definition for sub-Saharan Africa by subregion.(2)

List of variables extracted from the relevant publications meeting the inclusion criteria.


Variables included in the univariable and multivariable meta-regression analyses.

Studies reporting HSV-2 seroconversion rate or incidence rate in sub-Saharan Africa.

Forest plot presenting the outcome of the pooled mean herpes simplex virus type 2 (HSV-2) incidence rate by population type in sub-Saharan Africa.
Studies reporting HSV-2 seroprevalence in Eastern Africa. This table includes only overall and not stratified seroprevalence measures.
Studies reporting HSV-2 seroprevalence in Southern Africa. This table includes only overall and not stratified seroprevalence measures,
Studies reporting HSV-2 seroprevalence in Western Africa. This table includes only overall and not stratified seroprevalence measures.
Studies reporting HSV-2 seroprevalence in Central Africa. This table includes only overall and not stratified seroprevalence measures.
Studies reporting HSV-2 seroprevalence across several regions in sub-Saharan Africa. This table includes only overall and not stratified seroprevalence measures.
Pooled mean estimates for herpes simplex virus type 2 seroprevalence among general populations by sex stratification in sub-Saharan Africa.


Forest plots presenting the outcomes of the pooled mean herpes simplex virus type 2 (HSV-2) seroprevalence among the different at risk populations across the sub-Saharan Africa subregions.
Univariable and multivariable meta-regression analyses for herpes simplex virus type 2 seroprevalence among the different at risk populations in sub-Saharan Africa using the year of data collection as a categorical variable or as a linear term (in replacement of year of publication).
Studies reporting proportions of HSV-2 virus isolation in clinically-diagnosed genital ulcer disease and in clinically-diagnosed genital herpes in sub-Saharan Africa.

Forest plots presenting the outcomes of the pooled mean proportions of HSV-2 virus isolation in clinically-diagnosed genital ulcer disease (GUD) and in clinically-diagnosed genital herpes in sub-Saharan Africa.
Summary of the precision assessment and risk of bias assessment for the studies reporting HSV-2 seroprevalence in sub-Saharan Africa.
Acknowledgements
The authors gratefully acknowledge Professor Emeritus Rhoda Ashley Morrow from the University of Washington, for her support in assessing the quality of study diagnostic methods. The authors are also grateful for Ms. Adona Canlas for administrative support. The authors are grateful for pilot funding by the Biomedical Research Program and infrastructure support provided by the Biostatistics, Epidemiology, and Biomathematics Research Core, both at Weill Cornell Medicine-Qatar. This publication was made also possible by NPRP grant number 9-040-3-008 from the Qatar National Research Fund (a member of Qatar Foundation). The findings achieved herein are solely the responsibility of the authors. KL thanks the National Institute for Health Research, Health Protection Research Unit in Evaluation of Interventions at the University of Bristol, in partnership with Public Health England, for research support. The authors alone are responsible for the views expressed in this article and they do not necessarily represent the views, decisions or policies of the institutions with which they are affiliated, the NHS, the NIHR, the Department of Health and Social Care or Public Health England.
References
- 1.↵
- 2.↵
- 3.↵
- 4.
- 5.
- 6.
- 7.
- 8.↵
- 9.↵
- 10.↵
- 11.↵
- 12.↵
- 13.↵
- 14.↵
- 15.↵
- 16.↵
- 17.↵
- 18.↵
- 19.↵
- 20.↵
- 21.
- 22.
- 23.↵
- 24.↵
- 25.↵
- 26.↵
- 27.↵
- 28.↵
- 29.↵
- 30.↵
- 31.↵
- 32.↵
- 33.↵
- 34.
- 35.
- 36.↵
- 37.↵
- 38.↵
- 39.↵
- 40.↵
- 41.↵
- 42.↵
- 43.↵
- 44.↵
- 45.↵
- 46.↵
- 47.↵
- 48.↵
- 49.↵
- 50.
- 51.
- 52.
- 53.
- 54.
- 55.
- 56.
- 57.
- 58.
- 59.
- 60.
- 61.↵
- 62.↵
- 63.↵
- 64.↵
- 65.↵
- 66.↵
- 67.↵
- 68.↵
- 69.
- 70.
- 71.↵
- 72.↵
- 73.↵
- 74.↵
- 75.↵
- 76.↵
- 77.↵
- 78.↵
- 79.↵
- 80.↵
- 81.↵
- 82.↵
- 83.↵
References
- 1.
- 2.
- 3.
- 4.
- 5.
- 6.
- 7.
- 8.
- 9.
- 10.
- 11.
- 12.
- 13.
- 14.
- 15.
- 16.
- 17.
- 18.
- 19.
- 20.
- 21.
- 22.
- 23.
- 24.
- 25.
- 26.
- 27.
- 28.
- 29.
- 30.
- 31.
- 32.
- 33.
- 34.
- 35.
- 36.
- 37.
- 38.
- 39.
- 40.
- 41.
- 42.
- 43.
- 44.
- 45.
- 46.
- 47.
- 48.
- 49.
- 50.
- 51.
- 52.
- 53.
- 54.
- 55.
- 56.
- 57.
- 58.
- 59.
- 60.
- 61.
- 62.
- 63.
- 64.
- 65.
- 66.
- 67.
- 68.
- 69.
- 70.
- 71.
- 72.
- 73.
- 74.
- 75.
- 76.
- 77.
- 78.
- 79.
- 80.
- 81.
- 82.
- 83.
- 84.
- 85.
- 86.
- 87.
- 88.
- 89.
- 90.
- 91.
- 92.
- 93.
- 94.
- 95.
- 96.
- 97.
- 98.
- 99.
- 100.
- 101.
- 102.
- 103.
- 104.
- 105.
- 106.
- 107.
- 108.
- 109.
- 110.
- 111.
- 112.
- 113.
- 114.
- 115.
- 116.
- 117.
- 118.
- 119.
- 120.
- 121.
- 122.
- 123.
- 124.
- 125.
- 126.
- 127.
- 128.
- 129.
- 130.
- 131.
- 132.
- 133.
- 134.
- 135.
- 136.
- 137.
- 138.
- 139.
- 140.
- 141.
- 142.
- 143.
- 144.
- 145.
- 146.
- 147.
- 148.
- 149.
- 150.
- 151.
- 152.
- 153.
- 154.
- 155.
- 156.
- 157.
- 158.
- 159.
- 160.
- 161.
- 162.
- 163.
- 164.
- 165.
- 166.
- 167.
- 168.
- 169.
- 170.
- 171.
- 172.
- 173.
- 174.
- 175.
- 176.
- 177.
- 178.
- 179.
- 180.
- 181.
- 182.
- 183.
- 184.
- 185.
- 186.
- 187.
- 188.
- 189.
- 190.
- 191.
- 192.
- 193.
- 194.
- 195.
- 196.
- 197.
- 198.
- 199.
- 200.
- 201.
- 202.
- 203.
- 204.
- 205.
- 206.
- 207.
- 208.
- 209.
- 210.
- 211.
- 212.
- 213.
- 214.
- 215.
- 216.
- 217.
- 218.
- 219.
- 220.
- 221.


