
SUMMARY
Background To externally validate a risk prediction algorithm (QCovid) to estimate mortality outcomes from COVID-19 in adults in England.
Methods Population-based cohort study using the ONS Public Health Linked Data Asset, a cohort based on the 2011 Census linked to Hospital Episode Statistics, the General Practice Extraction Service Data for pandemic planning and research, radiotherapy and systemic chemotherapy records. The primary outcome was time to COVID-19 death, defined as confirmed or suspected COVID-19 death as per death certification. Two time periods were used: (a) 24th January to 30th April 2020; and (b) 1st May to 28th July 2020. We evaluated the performance of the QCovid algorithms using measures of discrimination and calibration for each validation time period.
Findings The study comprises 34,897,648 adults aged 19-100 years resident in England. There were 26,985 COVID-19 deaths during the first time-period and 13,177 during the second. The algorithms had good calibration in the validation cohort in both time periods with close correspondence of observed and predicted risks. They explained 77.1% (95% CI: 76.9% to 77.4%) of the variation in time to death in men in the first time-period (R2); the D statistic was 3.76 (95% CI: 3.73 to 3.79); Harrell’s C was 0.935 (0.933 to 0.937). Similar results were obtained for women, and in the second time-period. In the top 5% of patients with the highest predicted risks of death, the sensitivity for identifying deaths in the first time period was 65.9% for men and 71.7% for women. People in the top 20% of predicted risks of death accounted for 90.8% of all COVID-19 deaths for men and 93.0% for women.
Interpretation The QCovid population-based risk algorithm performed well, showing very high levels of discrimination for COVID-19 deaths in men and women for both time periods. It has the potential to be dynamically updated as the pandemic evolves and therefore, has potential use in guiding national policy.
Funding National Institute of Health Research
Evidence before this study Public policy measures and clinical risk assessment relevant to COVID-19 need to be aided by rigorously developed and validated risk prediction models. A recent living systematic review of published risk prediction models for COVID-19 found most models are subject to a high risk of bias with optimistic reported performance, raising concern that these models may be unreliable when applied in practice. A population-based risk prediction model, QCovid risk prediction algorithm, has recently been developed to identify adults at high risk of serious COVID-19 outcomes, which overcome many of the limitations of previous tools.
Added value of this study Commissioned by the Chief Medical Officer for England, we validated the novel clinical risk prediction model (QCovid) to identify risks of short-term severe outcomes due to COVID-19. We used national linked datasets from general practice, death registry and hospital episode data for a population-representative sample of over 34 million adults. The risk models have excellent discrimination in men and women (Harrell’s C statistic>0.9) and are well calibrated. QCovid represents a new, evidence-based opportunity for population risk-stratification.
Implications of all the available evidence QCovid has the potential to support public health policy, from enabling shared decision making between clinicians and patients in relation to health and work risks, to targeted recruitment for clinical trials, and prioritisation of vaccination, for example.
INTRODUCTION
The first cases of SARS-CoV-2 infection were reported in the United Kingdom (UK) on the 24th January 2020, with the first COVID-19 death on the 28th February 2020. As of 19 January 2021, there have been over 90,000 deaths from COVID-19 in the UK, and over 2 million deaths globally1.
Emerging evidence throughout the course of the pandemic, initially from case series, and then cohorts of individuals with confirmed SARS-CoV-2 infection, has demonstrated associations of age, sex, certain co-morbidities, ethnicity and obesity with adverse COVID-19 outcomes such as hospitalisation and death2-9. There is now a growing knowledge base regarding risk factors for severe COVID-19. As many countries are re-introducing ‘lockdown’ measures and vaccination programmes have started being rolled out, there is an opportunity to develop more nuanced guidance10 based on predictive algorithms to inform risk management decisions. Better knowledge of individuals’ risks could also help guide decisions on managing occupational risk and in targeting of vaccines to those most at risk. Whilst several risk prediction models have been developed, a recent systematic review found that they all have high risk of bias and that their reported performance is optimistic11.
The use of primary care datasets such as QResearch with linkage to registries such as death records and hospital admissions data represents an innovative approach to clinical risk prediction modelling for COVID-19 which has successfully been developed, validated, and implemented in the NHS over the last 10 years12-14. It provides accurately coded, individual-level data for very large numbers of people representative of the national population. This approach was used to develop the QCovid prediction models15 drawing on the rich phenotyping of individuals with demographic, medical and pharmacological predictors to allow robust statistical modelling and evaluation. Such linked datasets have a track record for the development, and evaluation of established clinical risk models including for cardiovascular disease12, diabetes14 and mortality13. Whilst QCovid predicts both COVID- 19 hospital related admission and COVID-19 death, the aim of this analysis is to validate the mortality outcome which estimate the risks of becoming infected and subsequent death due to COVID-19 in an extremely large national cohort. A companion study currently underway will externally validate these, using datasets from Wales using 16SAIL17 and Scotland using EAVE-II18 and will be reported separately.
METHODS
The Chief Medical Officer for England asked the New and Emerging Respiratory Virus Threats Advisory Group (NERVTAG), to develop and validate a clinical risk prediction model for COVID-19 in line with the emerging evidence. The resulting QCovid model was developed and validated using the QResearch database and reported in accordance with TRIPOD19 and RECORD20 guidelines and with input from a patient advisory group. The original protocol is published 21 along with the results of the paper reporting the original derivation and validation of the model15. This paper reports the validation of the model on an independent data source.
Study design and data sources
We undertook a validation cohort study of individuals aged 19-100 years using the Office for National Statistics (ONS) Public Health Linked Data Asset. This dataset is based on the 2011 Census in England, linked at individual level using the NHS number to mortality records, Hospital Episode Statistics and the General Practice Extraction Service (GPES) Data for pandemic planning and research. To obtain NHS numbers, the 2011 Census was linked to the 2011-2013 NHS Patient Registers using deterministic and probabilistic matching, with an overall linkage rate of 94.6%. We excluded patients (approximately 13.1%) who did not have a valid NHS number. For the purpose of the validation of the QCovid algorithm, we further linked radiotherapy and systemic chemotherapy records based on NHS number. The ONS Public Health Linked Data Asset includes data on most patients used to develop the QCovid algorithm, but also includes patients registered with practices using IT systems other than EMIS, such as TPP (used by 35% of GP practices).
We identified a cohort of all individuals aged 19-100 years who were enumerated at the 2011 Census and registered alive and resident in England on 24th January 2020. Patients entered the cohort on 24th January 2020 (date of first confirmed COVID-19 case in UK) and were followed up until they had the outcome of interest or 28th July 2020, which is the date up to which linked data were available at the time of the analysis. This also extends the period of observation beyond the original QCovid study. We divided the study period into two time periods: 24th January 2020 to 30th April 2020 and 01 May 2020 to 28th July 2020.
Outcomes
The outcome was time to COVID-19 death (either in hospital or out of hospital), defined as confirmed or suspected COVID-19 death as identified by two ICD10 codes (U07.1 or U07.2) recorded on the death certification.
Predictor variables
We derived pre-existing conditions and demographic characteristics using the same definitions as used to develop the QCovid algorithm. The primary care records used in the ONS Public Health Linked Data Asset were based on an existing GPES dataset which included many but not all of the relevant clinical codes used to develop the QCovid algorithm. Nonetheless, we derived most of the pre- existing conditions, although we could not identify patients who had a solid organ or bone marrow transplant in the past six months; those on kidney dialysis; those with sickle cell disease or severe combined immune deficiency syndrome; Similarly, we could not distinguish between patients suffering from type 1 or type 2 diabetes. Variables used to validate the QCovid algorithm are listed in Box 1.
Model validation
We fitted an imputation model to replace missing values for body mass index (BMI), using predicted values from linear regression models stratified by sex. Predictors included all predictor variables in the QCovid algorithm, interacted with age.
We applied the QCovid risk equations (version 1) to men and women in the validation dataset and evaluated R2 values22, Brier scores and measures of discrimination and calibration23 24 with corresponding 95% confidence intervals (CIs) over the two time periods. R2 values refer to the proportion of variation in survival time explained by the model. Brier scores measure predictive accuracy where lower values indicate better accuracy25. The D statistic is a discrimination measure which quantifies the separation in survival between patients with different levels of predicted risks and the Harrell’s C-statistics is a discrimination metric which quantifies the extent to which people with higher risk scores have earlier events. Model calibration was assessed in the two time periods by comparing mean predicted risks with observed risks by twentieths of predicted risk. Observed risks were derived in each of the 20 groups using non-parametric estimates of the cumulative incidences.
The performance metrics were calculated in the whole cohort and in the following pre-specified subgroups: 5-year age-sex bands, nine ethnic groups, and within each quintile of the Townsend Index, a measure of deprivation. We also estimated the performance metrics on a sample restricted to patients registered with practices using the TPP system, and therefore not used at all to derive the algorithm.
Ethics
The ethics approval for the development and validation of QCovid was granted by the East Midlands-Derby Research Ethics Committee [reference 18/EM/0400].
Role of the funding source
This study is funded by a grant from the National Institute for Health Research following a commission by the Chief Medical Officer for England whose office contributed to the development of the study question and facilitated access to relevant national datasets, contributed to interpretation of data, drafting of the report.
RESULTS
Overall study population
Overall, 34,897,648 people in England aged 19-100 years met our inclusion criteria. Out of the 40,136,597 people aged 19-100 who were enumerated at the 2011 Census and were alive on 24th January 2020, 5,238,949 (13.1%) people were excluded because they did not have a valid NHS number or had an NHS number that could not be linked to the GPES data. This could be because they migrated out of England, and therefore were no longer registered with the NHS in England. Our data cover 80.0% of the population in England aged 19 or over (See Supplementary Table 1). The coverage is lowest in London (68.2%) and highest in Yorkshire & Humber (83.7%).
Baseline characteristics
Table 1 shows the baseline characteristics of patients. Of these patients, 16,599,875 (47.57%) were men and 6,052,563 (17.34%) were of ethnic minority background. The mean age was 51.1 years, which is slightly higher than in the cohort used to derive the QCovid models (48.2 years). For most pre-existing conditions, the estimated prevalence in the ONS Public Health Linked Data Asset is similar to the prevalence in the QResearch derivation cohort. However, the ONS dataset had higher proportions of people taking anti-leukotriene or long acting beta2-agonists, or being prescribed oral steroids in the last six months because of data limitations.
26,985 (0.08%) patients had a COVID-19 related death during the first period: 24 January 2020 to 30 April 2020). 13,177 (0.04%) patients had a COVID-19 related death during the second period (1 May 2020 to 28 July 2020). Out of the 49,461 deaths that occurred in England over the period, 81.2% of these are included in our data (See Supplementary Table 1). The coverage is lowest in London (74.2%) and highest in the North West (84.6%). In both periods, COVID-19 deaths occurred across all regions, with the greatest numbers in London in period 1, (5,403 - 20.02% of all deaths) and in the North West in period 2 (2,411 - 18.30%). Of those who died in period 1, 15,334 (56.82%) were male; 4523 (16.76%) were from ethnic minority groups; 22,538 (83.52%) were aged 70 and over; 8,700 (32.24%) had diabetes; 8,293 (30.73%) had dementia; 6,990 (25.90%) were identified as living in a care home. Those who had a COVID-19 related death in period 2 had a similar profile to those in period 1 but were on average older (88.4% aged 70 and over) and more likely to live in a care home (31.4%).
Discrimination
Table 2 shows the performance of the risk equations in the validation cohort for women and men in the two time periods. Overall, the values for the R2, D and C statistics were high and similar in women and men in both periods. In the first period for women, the equation explained 76.3% of the variation in time to COVID-19 death; Harrell’s C statistic was 0.945 and the D statistic 3.67. The corresponding values in men were 77.1%, 0.935 and 3.76 respectively. All these discrimination metrics are higher than in the original QResearch cohort used to validate the algorithm. The results were similar for the second validation period. In period 2 for women, the R2 was 75.4%, Harrell’s C statistic 0.956, the D statistic 3.58. The corresponding values for men were 77.4%, 0.944 and 3.78 respectively. Similar results were obtained when restricting the sample to 14,104,452 patients registered with practices using the TPP system (Supplementary Table 2).
Figure 1 displays Harrell’s C statistic by age-band for men and women in period 1 (Panel A) and period 2 (Panel B). The Harrell’s C statistics are over 0.7 for all age bands indicating that even within each age band the model discriminates well. The C statistics are lower for patients aged 90 or over than for younger patients. The C statistics, R2, and D by age-band, deprivation quintile and ethnic group in men and women for both periods are reported in Supplementary Tables 3, 4 and 5. Performance was generally similar to the overall results except for age where the performance was lower within individual age-bands.

Calibration
Figure 2 displays the calibration plots for the COVID-19 mortality equation for men and women and in both periods. Overall, both sets of equations were well calibrated, as the predicted and observed risks were similar. However, as in the original QResearch validation cohort, the model underestimates the risk of COVID-19 death for those in the top 5% of the predicted risk score.

Predicted and observed risk of covid-19 related death in first study period (24 January to 30 April 2020)
Risk stratification
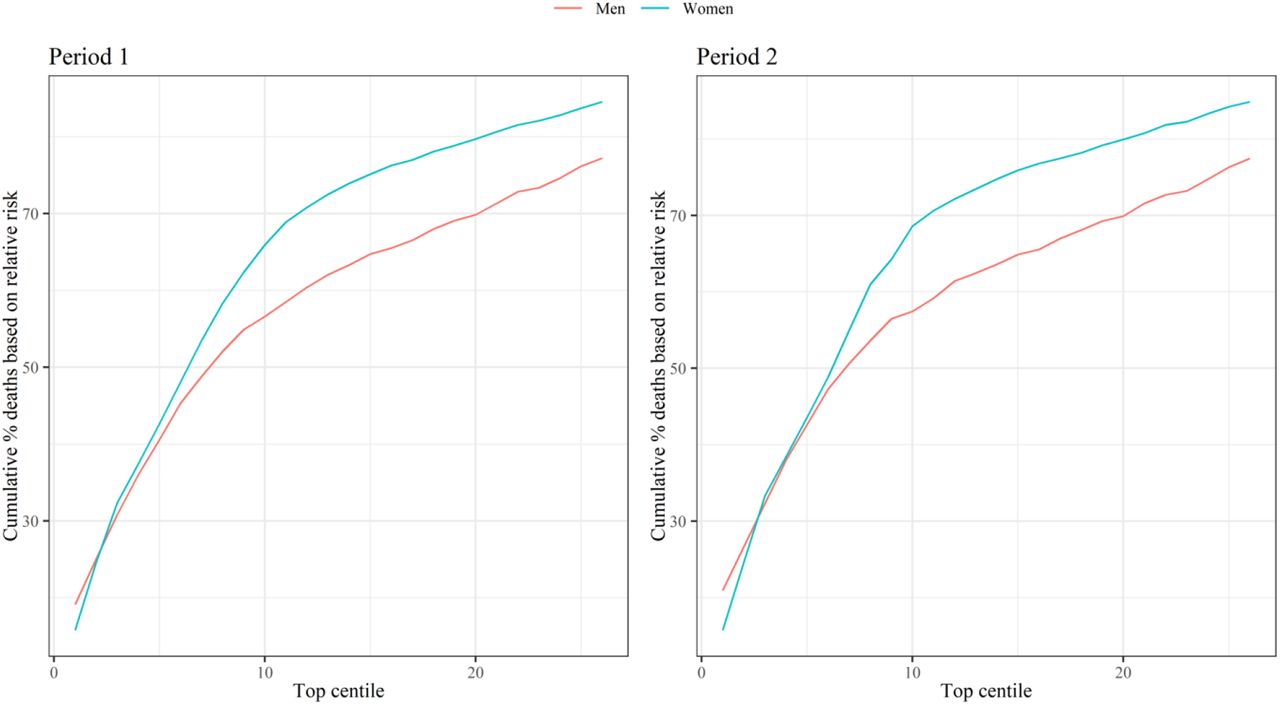
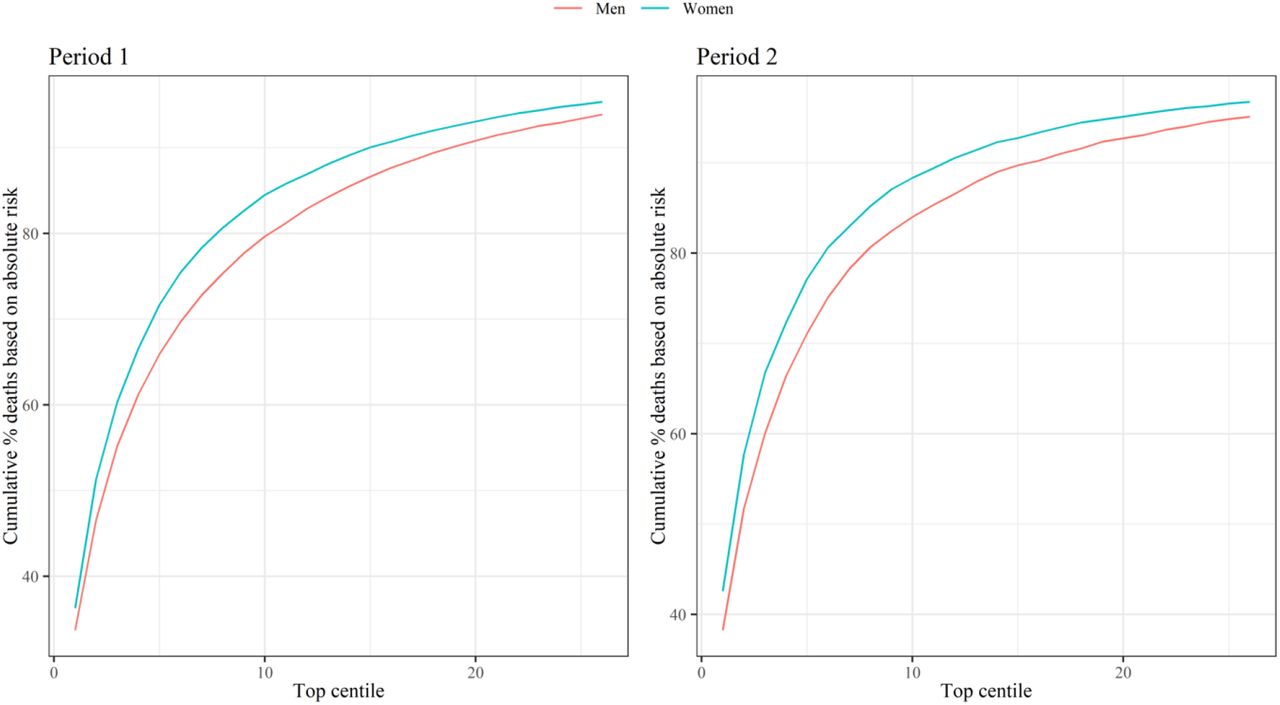
Figure 3 shows the sensitivity values for the mortality equation in period 1 (24 January 2020 – 30 April 2020) and period 2 (1 May 2020 – 28 July 2020) evaluated at different thresholds based on the centiles of the predicted absolute risk in the validation cohort. Full results are reported in Supplementary Table 6. The sensitivity was higher in women than in men, and in period 2 than period 1. In period 1, 65.94% of deaths in men occurred in those in the top 5% for predicted absolute risk of death from Covid-19 (90 day predicted absolute risks above 0.289%) and 71.67% of deaths in women occurred in the top 5% (predicted absolute risks above 0.188%). In period 2, 71.10% of deaths occurred in men in the top 5% for predicted absolute risk of death from Covid-19 (predicted absolute risks above 0.278%) and 77.16% of deaths occurred in women in the top 5% (predicted absolute risks above 0.181%). Supplementary Figure 1 shows the sensitivity for the two time periods based on relative risks (defined as the ratio of the individual’s predicted absolute risk to the predicted absolute risk for a person of the same age and sex with a white ethnicity, body mass index of 25, and mean deprivation score with no other risk factors). In period 1, 40.56% of deaths occurred in men in the top 5% for predicted relative risk of death from Covid-19, and 42.63% for women. In period 2, 42.62% of deaths occurred in men in the top 5% for predicted relative risk of death from Covid-19, and 43.57% for women.

Sensitivity for covid-19 related death in validation cohort for period 1 (24 January 2020 – 30 April 2020) and period 2 (1 May 2020 – 28 July 2020) Centiles based on predicted absolute risks in men and women in each period. Sensitivity (cumulative % deaths) is percentage of total deaths in the period that occurred within the group of patients above the predicted risk threshold.
DISCUSSION
We have validated the QCovid clinical risk prediction model for mortality due to COVID-19 using a national external linked dataset. We have used national linked datasets from the 2011 Census, general practice, death registry data for a population-representative sample of nearly 35 million adults. The risk models have excellent discrimination (Harrell’s C statistics>0.9), are well calibrated and have a high sensitivity.
Our study had a number of important strengths. First, we used a unique linked dataset based on the 2011 Census for nearly 35 million people living in England. Second, we used a wide range of metrics, over two time periods to validate the QCovid predictive model, extending the period of observation beyond the original study. All the metrics in the two time periods for both men and women indicate that the algorithm performs well, and the metrics are comparable with the original validation of QCovid in the QResearch database15. Finally, we showed that the model’s performance was similar when restricting the sample to patients that were registered with practices using a different clinical computer system provider (TPP), and therefore not used to derive the QCovid model.
This study also has several limitations. First, because of data limitations, we could not derive all predictors in the same way as in the derivation cohort. Despite these inconsistencies, the model had excellent discrimination and calibration. Second, we only focused on COVID-19 related deaths, but not hospital admissions, because of the lack of data. Finally, because the Public Health Data Asset is based on the 2011 Census, our sample was restricted to patients who were enumerated in 2011, that is about 94% of the population living in England in 2011. Recent migrants were excluded from this study, but they tend to be younger than the native population and therefore at lower risk of COVID-19 death.
QCovid represents a new approach for population risk-stratification for adverse outcomes from COVID-19, and our validation indicates that the risk algorithm performs well on external data not used for its derivation. Whilst it has been specifically designed to inform UK health policy and interventions to manage COVID-19 related risks, it also has international potential, subject to local validation. It could also be deployed in a number of health and care applications, either during the current phase of the pandemic, or in subsequent ‘waves’ of infection. These could include supporting targeted recruitment for clinical trials, vaccine prioritisation, and discussions between patients and clinicians in relation to work and health risks, for example through weight reduction since obesity is the single most important modifiable risk factor for serious COVID-19 complications8.
In conclusion, this study presents a robust validation of a new prediction model that could be used to support population risk stratification in relation to public health interventions, for example vaccine utilisation. We anticipate that the algorithms will be updated regularly as understanding of COVID-19 increases, as more data become available, as new variants emerge, effective treatments for COVID become available, the vaccination program rolls-out, immunity levels change or as behaviour in the population changes and hence we anticipate that this validation will need to be repeated on a regular basis. It is important for patients/carers, and clinicians that there is a common appropriately developed evidence-based model that is consistently implemented and is supported by the academic, clinical and patient communities. This will then help ensure consistent policy and clear national communication between policy makers, professionals, employers and the public.
Data sharing statement
The ONS Public Health Linked Data Asset will be made available on the ONS Secure Research Service for Accredited researchers. Researchers can apply for accreditation through the Research Accreditation Service. The data will include all variables used in this analysis, except predictors based on radiotherapy and systemic chemotherapy records, which cannot be shared.
Ethics approval
Ethics approval for the development and validation of QCovid is covered by Research Ethics Committee [reference 03/4/021].
Authors and contributors
Study conceptualisation was led by NM, JHC, VN, CC. All authors contributed to the development of the research question, study design, with development of advanced statistical aspects led by CC, VN. VN, RS, PB, PP, JHC and JM, were involved in data specification, curation and collection. JHC developed, checked or updated clinical code groups. VN led the statistical analyses which were checked by LL. All authors contributed to the interpretation of the results. VN and JHC wrote the first draft of the paper. All authors contributed to the critical revision of the manuscript for important intellectual content and approved the final version of the manuscript.
VN had full access to all data in the study and takes responsibility of the integrity of the data and the accuracy of the data analysis. The lead author (VN) affirms that the manuscript is an honest, accurate, and transparent account of the study being reported; that no important aspects of the study have been omitted; and that any discrepancies from the study as planned have been explained.
Funding
This study is funded by a grant from the National Institute for Health Research following a commission by the Chief Medical Officer for England whose office contributed to the development of the study question and facilitated access to relevant national datasets, contributed to interpretation of data, drafting of the report.
Declarations of interest
All authors have completed the ICMJE uniform disclosure form at www.icmje.org/coi_disclosure.pdf and declare: JHC reports grants from National Institute for Health Research Biomedical Research Centre, Oxford, grants from John Fell Oxford University Press Research Fund, grants from Cancer Research UK (CR-UK) grant number C5255/A18085, through the Cancer Research UK Oxford Centre, grants from the Oxford Wellcome Institutional Strategic Support Fund (204826/Z/16/Z), during the conduct of the study. JHC is an unpaid director of QResearch, a not-for- profit organisation which is a partnership between the University of Oxford and EMIS Health who supply the QResearch database used for this work. JHC is a founder and shareholder of ClinRisk ltd and was its medical director until 31st May 2019. ClinRisk Ltd produces open and closed source software to implement clinical risk algorithms (outside this work) into clinical computer systems.
Predictor variables used to validate the QCOVID model
Age in years (continuous)
Townsend deprivation score (continuous)
Accommodation (Neither homeless nor care home, Care home or nursing home)
Ethnicity in nine categories (Bangladeshi, Black African, Black Caribbean, Chinese, Indian, Mixed, Pakistani, White British, White other, Other)
Body Mass Index (kg/m2)
Chronic kidney disease (CKD) - (no CKD, CKD3, CKD4, CKD5)
Learning disability (No learning disability, Down’s Syndrome, other learning disability)
Chemotherapy in last 12 months (Chemotherapy group A, B, C)
Respiratory cancer
Radiotherapy in last 6 months
Solid organ transplant
Prescribed immunosuppressant medication by GP
Prescribed leukotriene or long-acting beta blockers
Prescribed regular prednisolone
Sickle cell disease
Diabetes
Chronic obstructive pulmonary disease (COPD)
Asthma
Rare pulmonary diseases
Pulmonary hypertension or pulmonary fibrosis
Coronary heart disease
Stroke
Atrial Fibrillation
Congestive cardiac failure
Venous thromboembolism
Peripheral vascular disease
Congenital heart disease
Dementia
Parkinson’s disease
Epilepsy
Rare neurological conditions
Cerebral palsy
Severe mental illness (bipolar disorder, schizophrenia, severe depression)
Osteoporotic fracture
Rheumatoid arthritis or Systemic lupus erythematosus
Cirrhosis of the liver
Note: For the validation of the QCovid risk model, all patients with diabetes were assigned the coefficient type 2 diabetes. Patients with Stage 5 chronic kidney disease (CKD) were assigned the coefficient for CKD without transplant nor dialysis.
Appendix
Centiles based on predicted relative risks compared with someone of the same age/sex with no risk factors. Sensitivity is percentage of total deaths in the period that occurred within the group of patients above the predicted risk threshold.
Acknowledgements
We acknowledge the contribution Jenny Harries, Nazmus Haq, Joanna Moody and Shamim Rahman from the UK Department of Health and Social Care, Joy Preece and Dan Ayoubkhani from the Office for National Statistics. This project involves data derived from patient-level information collected by the NHS, as part of the care and support of cancer patients. Access to the data was facilitated by the PHE Office for Data Release. The Hospital Episode Statistics data used in this analysis are re-used by permission from NHS Digital who retain the copyright for these data.
REFERENCES


Subject Area
Reviews and Context
0
Comment
0
TRIP Peer Reviews
0
Community Reviews
0
Automated Services
1
Blogs/Media
Author Videos