
Abstract
Objectives Children presenting at audiology services with listening difficulties often have normal audiograms, yet the appropriate approach for the further assessment and clinical management of these children is currently unclear. In this study we assessed listening ability in a large (n = 146) and heterogeneous sample of 6-13 year-old children with normal audiograms using a reliable and validated caregiver questionnaire. The results were related to a multifaceted laboratory assessment of the children’s audiological, psychoacoustic, physiological and cognitive abilities. This report is an overview of the study and focuses on the children’s behavioral performance. The overall goals of the study are to understand the auditory and other neural mechanisms underlying childhood listening difficulties and to translate that understanding into clinical assessment and, ultimately, intervention.
Design Cross-sectional behavioral assessment of children recruited through relevant clinics of Cincinnati Children’s Hospital, and advertisements placed in the hospital online information service. We aimed recruitment into two demographically-matched groups, a ‘listening difficulties’ group and a ‘typically developing’ control group. Caregivers completed the ‘ECLiPS’ questionnaire and the resulting ‘total’ standardized composite score formed the basis of further descriptive statistics, univariate and multivariate modeling of experimental data.
Results All scores of the ECLiPS, the SCAN-3:C, a standardized clinical test suite for auditory processing, and the NIH Cognition Toolbox were significantly lower for children with listening difficulties than for their typically developing peers, using group comparisons via t-tests and Wilcoxon Rank Sum tests. A similar effect was observed on the LiSN-S test for speech sentence-in-noise intelligibility, but only reached significance for the Low Cue and High Cue conditions, and the Talker Advantage derived score. Stepwise regression to examine factors contributing to the ECLiPS Total scaled score (pooled across groups) yielded a model that explained 42% of its variance based on the SCAN composite, LiSN-S Talker Advantage, and the NIH Toolbox Picture Vocabulary and Dimensional Change Card Sorting scores (F4,95 = 17.35, p < 0.001). High correlations were observed between many test scores including the ECLiPS, SCAN and NIH Toolbox composite measures. LiSN-S Advantage measures generally correlated weakly and non-significantly with non-LiSN-S measures. However, a significant interaction was found between extended high frequency threshold and LiSN-S Talker Advantage.
Conclusions Children with listening difficulties but normal audiograms have problems with the cognitive processing of auditory and non-auditory stimuli that include both fluid and crystallized reasoning. Analysis of poor performance on the LiSN-S Talker Advantage measure identified subclinical hearing loss as a possible minor contributing factor to talker segregation. Beyond auditory tests, evaluation of children with complaints of listening difficulties should include standardized caregiver observations and consideration of broad cognitive abilities.
Introduction
Most people have listening difficulties (LiD) at one time or another, and some people have LiD continuously. While these difficulties are often accompanied by audiometric hearing loss, a substantial proportion of both children (Hind et al., 2011) and adults (Parthasarathy et al., 2020) attending audiology clinics are found to have normal audiometric sensitivity. Nationally within the US it has recently been estimated that about 80 million adults have LiD, of whom half have hearing loss, while the other half have clinically normal hearing (Edwards, 2020).
Individuals with LiD commonly have difficulty understanding speech in challenging situations such as noise, but also have other symptoms that can include difficulty following instructions and understanding rapid or degraded speech (Jerger & Musiek, 2000). Such tasks require not only auditory processing, but also speech decoding and the successful deployment of selective attention towards task-relevant stimuli (Moore et al., 2010). Both childhood and older age are marked by changes in attention, with the maturation of attention networks persisting through adolescence (Rueda & Posner, 2013), and losses that may be specific to dual set maintenance later in life (Verhaeghen & Cerella, 2002). A host of other top-down cognitive (Davis & Johnsrude, 2007) and bottom-up auditory (B. C. J. Moore, 2012) abilities underlie speech perception and, in almost all of these abilities that have been studied, children generally perform more poorly than adults (Moore et al., 2011; Rueda & Posner, 2013). Listening in individual children occurs along a continuum, as evidenced by caregiver questionnaires, including the Children’s Communication Checklist (CCC-2; Bishop, 2006; Moore et al., 2010) and the Evaluation of Children’s Listening and Processing Skills (ECLiPS; Barry & Moore, 2014; Barry et al., 2015; Roebuck & Barry, 2018). For some children, LiD are problematic because they impair communication to a degree that substantially delays their social, academic and personal development relative to their peers.
Hearing and listening are often used to mean the same thing, but Merriam-Webster defines hearing as the “sense by which noises and tones are received as stimuli”, while listening means “to pay attention to sound”. Following these definitions, by ‘hearing’ we mean sound-evoked activation of the ear and central auditory nervous system (CANS), usually associated with, but sometimes independent of awareness. ‘Listening’ may be described as the conscious perception of sound, which is dependent on attention and is influenced by abilities including memory, executive function, emotion and, as above, linguistic processes. Crucially, it is possible to hear several speech sources simultaneously, but listen to only one (Cherry, 1953). Listening necessarily involves higher areas of brain function, beyond the CANS, for example the “posterior hot zone”, a broad region of the posterior parietal, occipital and temporal cortex that appears to be the common locus of activation during different modes of conscious experience (Koch, 2018; Koch et al., 2016). The primary auditory cortex, in contrast, does “not directly contribute to the content of auditory … experience” (Koch, 2018). Despite the prevalence of LiD without hearing loss, listening is poorly understood clinically. For example, much of the controversy surrounding the concept of ‘auditory processing disorder’ (APD) centers on whether LiD in children is due to a ‘hearing’ or to a ‘listening’ problem (Moore, 2018).
There are various explanations for LiD in children. The most commonly-recognized cause is hearing loss, as typically indexed by pure-tone insensitivity. Recent large-scale studies have shown that children with even mild hearing loss (better ear pure tone average, PTA >20 dB HL) have reduced language skills, leading to impaired learning (Ching et al., 2018; Moeller & Tomblin, 2015; Moore et al., 2020). However, as above, there is also considerable evidence that children with normal PTA hearing can also have LiD (de Wit et al., 2016; Moore et al., 2010). In the broader field of learning disabilities (e.g. developmental language disorder, reading disorder), this is currently assumed to mean those children have ‘normal hearing’ and that their problems lie outside the auditory system. Yet the current clinical definition of ‘normal hearing’ does not guarantee the absence of peripheral pathology. Several forms of sub-clinical hearing loss have been identified, including minimal or slight hearing loss (e.g. PTA = 15 – 20 dB HL) (Bess et al., 1998; Moore et al., 2020), extended high frequency hearing loss (Hunter et al., 1996; Motlagh Zadeh et al., 2019), auditory synaptopathy (Kujawa & Liberman, 2019), and reduced spectral or temporal resolution of cochlear origin (Oxenham & Bacon, 2003).
Impaired function of the CANS is another possible source of LiD. For example, reversibly impaired binaural interaction and spatial hearing has been found consequent on earlier otitis media (Moore et al., 1991; Pillsbury et al., 1991; Whitton & Polley, 2011) and ear canal atresia (Wilmington et al., 1994) in children. The impairment is considered to be ‘central’ because it depends on binaural interaction, which only occurs in the brain, and because it can remain after the peripheral pathology resolves, leaving the ears audiometrically and tympanometrically normal. Otitis media earlier in life is also thought to underlie reduced spatial unmasking, termed ‘spatial processing disorder’ (SPD; Cameron et al., 2014, 2015; Graydon et al., 2017), as indexed by the Listening in Spatialized Noise – Sentences (LiSN-S) test. Spatial unmasking is a well-documented phenomenon in which spatially separating a target sound from a masking or competing sound renders the target more intelligible. The neural mechanisms of SPD remain unclear, and studies reporting SPD have not ruled out sub-clinical hearing loss.
Reduced cognitive function is another possible mechanism of LiD, as introduced above. For example, executive control is crucial for establishing sustained goal-directed attention and dynamically switching attention based on task demands (Petersen & Posner, 2012). Working memory supports speech comprehension, particularly under difficult listening conditions (Rudner & Rönnberg, 2008), and is associated with performance on even simple, non-speech hearing tests, such as frequency discrimination (Banai & Ahissar, 2004). Thus, reduced scores on those tasks in children may reflect either or both sensory and cognitive impairment (Moore et al., 2010).
The primary purpose of a large, US National Institutes of Health funded, longitudinal research project, of which this is one of the first experimental reports, is to advance the understanding of APD and to provide a basis for improvements in the diagnosis and management of children with LiD. Here, we present baseline behavioral data from the first full analysis of a large group of children with mixed listening abilities, as reported by their caregivers on the well-validated Evaluation of Children’s Listening and Processing Skills (ECLiPS) questionnaire (Barry & Moore, 2014; Barry et al., 2015; Roebuck & Barry, 2018). The primary aim of this study was to examine the relationship between hearing, listening and cognitive performance through univariate group comparisons and multivariate statistical modeling using quantitative metrics from a battery of auditory and cognitive behavioral tests. Based on previous research, we predicted that these analyses would demonstrate broad differences between LiD and TD groups across demographic, cognitive, ‘auditory processing’ and speech-in-noise factors, and that all of these factors would be represented in the regression model predicting listening ability.
Materials and Methods
This study was approved by the Institutional Review Board of Cincinnati Children’s Hospital (CCH) Research Foundation.
Participants
A total of 166 participants (74 with LiD, 92 typically developing - TD) was enrolled; 20 withdrew or otherwise exited the study (7 LiD, 13 TD). The remaining 146 participants ranged from 6.0 to 13.7 years of age at enrolment. Age is summarized along with other demographic variables (sex, race and maternal education) in Table 1. Due to attrition and updates to testing procedures, the sample size for each assessment was variable (see Results). All participants had normal hearing, bilaterally, defined as pure tone thresholds ≤ 20 dB at all octave frequencies between 0.25 – 8 kHz.
Participant numbers and demographic variables in the typically developing (TD) and listening difficulty (LiD) groups. Age is expressed as mean (SD). All other values are frequencies.
Procedure
Participants with LiD were recruited initially from a medical record review study of over 1,100 children assessed for Auditory Processing Disorder (APD) at Cincinnati Children’s Hospital. Of those children, 179 were diagnosed by an audiologist as having an auditory processing “disorder” and 364 as having an auditory processing “weakness” (Moore et al., 2018). Caregivers of children in either of those categories who fit our inclusion criteria and responded positively to an invitation to participate in this study were sent a pack of three short questionnaires. Those who chose to complete and return the questionnaires were invited to bring their child into the lab for a study visit. Over time, recruitment efforts were expanded to include children both with and without LiD, and the use of IRB-approved materials, advertising, and messages via print, electronic, social and digital media at hospital locations and in the local and regional area. Flyers were posted in relevant hospital clinics (i.e., Audiology, Developmental and Behavioral Pediatrics, Speech/Language Pathology) and sent out via email to all hospital employees and families interested in research.
Interested caregivers completed eligibility screening procedures for their child by phone, or by paper or electronic questionnaires. Electronic questionnaires were delivered via a secure, unique link to REDCap, an electronic survey administration and database platform. Those who opted-in completed (i) a consent form, (ii) a medical and educational history ‘Background’ questionnaire, (iii) the ECLiPS questionnaire (Barry & Moore, 2014), and (iv) the Children’s Communication Checklist, 2nd Edition (CCC-2; Bishop, 2006). If the child was deemed eligible by study staff, the caregiver was invited to schedule an initial visit.
Prior to completion of any other study-related procedures, caregivers reviewed the informed consent form with a study staff member and discussed the purpose, procedures, risks and benefits, duration, and expectations involved in the study. Children aged 11 and above were also assented using a child-friendly version of the consent document, per institutional policy.
About 70% (n=104) of the study sample scheduled individual visits. Most participants completed at least three separate visits, approximately 3 hours long each. The time between visits for the full sample varied an average of 18.6 days, but as some study procedures were added several months to a year after the start of the study, some participants returned to complete the series of visits several months apart over a 2-year period. Consequently, all age-related measures were adjusted for age at the time of testing (resolution = 0.1 years) rather than at enrolment. Hearing thresholds were re-checked if the participant returned more than six months following their most recent audiogram. To maintain engagement between visits, participants were sent handwritten birthday and holiday cards throughout their enrolment. Caregivers also received periodic email communications about updates on the study website and newsletters about study and lab activities. Caregivers were encouraged to access the website, which was built as a tool to provide additional information about the study including interim results, staff members, and testing procedures.
As an alternative to scheduling individual visits, participants were offered the opportunity to attend a “summer camp” session, and approximately 30% of participants completed initial (‘Wave 1’) testing in this way (n = 44). Two-day camp sessions were offered throughout the summer over the 2-year period of data collection. Six children were invited to attend each camp session and six camps were held each year, for a total of 36 available camp spots per year. On the first day of camp, caregivers completed the informed consent process and then left for the day and returned to pick up their child in the afternoon. Over the two camp days, participants spent 8-10 hours completing study procedures and the remaining 5-7 hours playing board games, having lunch and snacks, watching movies, and doing arts and crafts with other campers and the study staff. Participants rotated between 5-6 testing stations (sound booths, quiet testing rooms) with study staff to complete all of the different procedures. Participants also received payment via ClinCard, a pre-paid debit card reloaded at the end of each appointment. Overall, participants reported that they enjoyed participating in the study via summer camp sessions and expressed interest in returning for future sessions.
Materials
Background questionnaire
This questionnaire was used to screen potential participants for study eligibility and gather background information. It asked about the participant’s medical history, parental education, and demographic information. Key variables were date of birth, language, race and ethnicity, maternal education, history of ear and hearing problems (including pressure equalization, PE, tube placement), diagnosis of, or treatment for, learning problems (attention disorders, developmental delays, speech-language disorders), neurological (e.g. history of head trauma) or psychiatric conditions, school interventions, and birth history (prematurity, NICU stay). Requirements for eligibility in the LiD group included age between 6 and 13 years old upon enrolment, English native language, and no neurologic, psychiatric or intellectual (IQ < 80) condition that would prevent or restrict the ability to complete testing procedures. Participants were evaluated on a case-by-case basis to determine their ability to participate in the study. TD participants were eligible based on the same criteria, with the addition that they could not have a diagnosed developmental delay, attention or other learning disorder. Demographic variables including maternal education, age, gender, and race, obtained from this questionnaire, are summarized in Table 1 for the listening difficulty (LiD) group and their peers (TD).
Caregiver evaluation of children’s listening (ECLiPS)
The ECLiPS (Barry & Moore, 2014) profiles children’s listening and communication abilities. It contains 38 simple statements (items) describing behaviors commonly observed in children. Caregivers were asked to rate how much they agreed with each statement on a five-point scale ranging from strongly disagree to strongly agree. The ratings were averaged to derive scores, which were scaled by age, on five subscales (speech & auditory processing, SAP; environmental & auditory sensitivity, EAS; language/ literacy/ laterality, LLL; memory & attention, M&A, and pragmatic & social skills, PSS) each containing 6-9 distinct items. These scales are further collected under Language, Listening, Social, and Total aggregate (composite) scores. All scales and composites were standardized for a population mean of 10 (s.d. = 3) based on British data (Barry et al., 2015). A secondary aim of this study was to provide initial US normative data for the ECLiPS and to compare them with the British norms.
Caregiver evaluation of children’s communication (CCC-2)
The CCC-2 (Bishop, 2006) asks caregivers to respond to 70 items relating to the child’s communication skills. Subscales include speech, syntax, semantics, coherence, initiation, scripted language, context, nonverbal communication, social relations, and interests. The items are combined to create two composite scores, a General Communication Composite (GCC) and the Social Interaction Difference Index (SIDI). The GCC is a scaled composite of the scores on 8 of the 10 subscales, excluding subscales for social relations and interests.
Audiometry
All participants were screened for normal hearing at standard, octave intervals from 0.25 - 8 kHz bilaterally. All except 27 (5 LiD, 22 TD) participants additionally completed threshold audiometry at the extended high frequencies (EHFs) of 10, 12.5, 14 and 16 kHz using an Equinox audiometer (Interacoustics, Inc.) and the Hughson-Westlake adaptive method (American Speech-Language-Hearing Association, 2005). Early in data collection, insert earphones (E-A-R TONE GOLD 3A) were used for standard frequencies and Sennheiser HDA 300 circumaural headphones for EHFs. For most children (n = 114; Hunter et al., 2020), the Sennheiser headphones were used for all frequencies. Participants were tested alternately with each ear first. They were instructed to respond when they heard a tone by pressing a response button or raising one hand. Those with any elevated thresholds (> 20 dB HL) in the standard frequencies were excluded and were referred for further clinical care as appropriate. Participants were re-tested if they returned > 6 months after previous testing.
‘Auditory Processing Disorder’ (SCAN-3:C)
Participants were assessed in a private sound attenuated booth or quiet room using the SCAN-3:C (Keith, 2009), a standardized test of auditory processing for children aged 5-12 years (Emanuel et al., 2011). Stimuli were presented via a laptop PC through Sennheiser HD 215 headphones. The four diagnostic subtests of the SCAN-3:C are low-pass filtered words (FW), auditory figure-ground (AFG+8), competing words – directed ear (CW-DE), and competing sentences (CS). For FW, participants are asked to repeat low-pass filtered, monosyllabic words in quiet. AFG+8 is a speech-in-noise test requiring repetition of unfiltered monosyllabic words against multi-talker speech (the ‘noise’) at a fixed +8 dB signal/noise ratio (SNR). In CW-DE, two different monosyllabic words are presented simultaneously, one in each ear (i.e. dichotically), and participants report them back either left or right ear first. Similarly, for CS, unrelated sentences are presented to the left and right ears but, in this case, participants repeat only the sentence heard in one, directed ear per trial. A complete SCAN battery results in age-scaled scores for each subtest as well as a standardized composite.
Speech hearing in noise (LiSN-S)
The Listening in Spatialized Noise – Sentences (LiSN-S) test (Brown et al., 2010; Cameron & Dillon, 2007; Phonak/NAL, 2011) measures the ability to listen and repeat simple, spoken sentences in the presence of informational masking, developed using the same criteria as the BKB sentences (Bench et al., 1979). The LiSN-S (US Edition; Brown et al., 2010) was administered using a commercial CD played on a laptop (Phonak/NAL, 2011), a task-specific soundcard, and Sennheiser HD 215 headphones. In the LiSN-S, participants are asked to repeat a series of target sentences (‘T’), presented directly in front (0°; diotic), while ignoring two distracting speakers (‘D1’, ‘D2’). There are four listening conditions, in which the distractors change voice (different or same as target) and/or position (0° and 90° virtual positions relative to the listener using generic head-related transfer functions; Humanski & Butler, 1988). The test is adaptive; the level of the target speaker decreases or increases in SNR relative to the distracting speech if the listener responds correctly or incorrectly during up to 30 sentences in each condition. The 50% correct SNR is either the Low cue speech reception threshold (SRT; same voice, 0° relative to the listener) or the High cue SRT (different voice, 90° relative to the listener). The three derived scores of the LiSN-S are the Talker Advantage, Spatial Advantage, and Total Advantage, so-called because each is the difference between SRTs from two conditions. This subtraction process should, to some extent, separate auditory from cognitive influences (Moore & Dillon, 2018), as discussed below.
Cognition (NIH Toolbox)
Each participant’s cognitive skills were assessed using the NIH Toolbox Cognition Domain battery of tests (Wientraub, 2013). Participants completed testing online or via an iPad app, in accordance with current Toolbox recommendations, in a private sound-attenuated booth or quiet room. The battery contains up to eight standardized cognitive instruments measuring different aspects of fluid or crystallized reasoning. The precise composition of the testing battery is dependent on user choice and participant age.
All participants in this study completed the Picture Vocabulary test (PVT), Flanker Inhibitory Control and Attention test (Flanker), Dimensional Change Card Sort test (DCCS), and Picture Sequence Memory test (PSMT). Each test produced an age-corrected standardized score and the scores of all four tests were combined to calculate a single Early Childhood Composite. The PVT is an adaptive test in which the participant is presented with an audio recording of a word and selects which of four pictures most closely matches the meaning of the word. In the Flanker, which tests inhibition/attention, the participant reports the direction of a central visual stimulus (left or right, fish or arrow) in a string of five similar, flanking stimuli that may be congruent (same direction as target) or incongruent (opposite direction). The DCCS tests cognitive flexibility (attention-switching). Target and test card stimuli vary along two dimensions, shape and color. Participants are asked to match test cards to the target card according to a specified dimension that varies for each trial. Both the PVT and DCCS score accuracy and reaction time. PSMT assesses episodic memory by presenting an increasing number of illustrated objects and activities, each with a corresponding audio-recorded descriptive phrase. Picture sequences vary in length from 6-18 pictures depending on age, and participants are scored on the cumulative number of adjacent pairs remembered correctly over two learning trials.
Additional NIH Toolbox Cognition tests were administered to all children 8 years of age and older. For the Fluid Composite measure, we used the list sorting working memory (LSWM) and the pattern comparison processing speed (PCPS) tests, in addition to the DCCS, Flanker, and PSMT, as above. LSWM assesses working memory by asking participants to arrange objects presented visually and auditorily (food and animals) in order of size. PCPS requires participants to respond as quickly as possible to whether two visually presented cards are the same or different. For the Crystallized Composite measure, participants completed the Reading Recognition (RR) test in addition to the PVT. The RR requires participants to read aloud words and letters accurately. A final Toolbox measure that was not part of a composite score, the Rey Auditory Verbal Learning (AVL) test measures verbal episodic memory as a supplement to the visual PSM test.
Analysis
The primary analysis was divided into three sequential parts. Part 1 examined subgroup differences between children with LiD who had a formal diagnosis of APD, including auditory processing ‘weakness’, (Dx subgroup; Moore et al., 2018) and children with listening difficulties but no formal diagnosis (noDx subgroup). The purpose of this analysis was to determine whether these two subgroups could be treated as a homogeneous LiD group for subsequent analyses.
These subgroups were tested for differences on the ECLiPS Total scaled score, SCAN-3:C composite scaled score, LiSN-S Talker Advantage, Spatial Advantage, and Low Cue scores, and the NIH Cognition Toolbox Fluid, Crystallized, and Early Childhood Composites, as well as the AVL test. A potential influence of maternal education was first explored via a separate two-way ANOVA for each of these variables with the factors diagnosis (Dx, noDx) and maternal education level (collapsed into two groups: graduated high school or less, and some college or more). In no case was there a main effect of, or an interaction with, maternal education (p > 0.05). All group-level comparisons for the Dx versus noDx subgroups were therefore conducted using two-tailed, two-sample Student’s t-tests, when the assumption of normality was met, and Wilcoxon Rank-Sum tests in all other cases.
Part 2 of the analysis examined group differences between TD children and children with LiD (combined Dx subgroups) on all of the same measures used for Part 1. As in Part 1, a potential influence of maternal education was first explored via separate two-way ANOVAs, this time with the factors listening difficulties (TD, LiD) and maternal education level (levels as above). In no case was there a main effect of, or an interaction with, maternal education (p > 0.05). All group-level comparisons between LiD and TD groups were therefore assessed via two-tailed, two-sample Student’s t-tests. To reduce the risk of alpha inflation through multiple comparisons, only descriptive statistics are provided for the remaining measures (e.g. subtests contributing to composite scores).
Part 3 of the analysis aimed to identify the functional domains that contribute to LiD across all participants by using stepwise multiple regression to predict ECLiPS Total scaled scores. Candidate predictors for this analysis included only assessments that were available across the full age range of the study sample. As discussed above, some tests of the NIH Cognition Toolbox did not meet this criterion. Candidate predictors included maternal education level, race, SCAN-3:C Composite Score, four LiSN-S scores (Low Cue, High Cue, Talker Advantage, Spatial Advantage), and four NIH Cognition Toolbox tests (DCCS, Flanker, PST, PVMT). To explore a possible role of extended high frequency hearing thresholds, for which main effects were examined in a recent paper (Hunter et al., 2020), four interactions were included as candidate predictors. Three interactions with LiSN-S scores (Low Cue, Talker Advantage, Spatial Advantage) explored a possible contribution from extended high frequency thresholds to speech-in-noise performance in complex environments. In light of the known benefit that linguistic proficiency provides under difficult listening conditions (Kaandorp et al., 2016), an interaction with the NIH PVT was also explored to examine the possible role of language skills in mitigating the influence of extended high frequency hearing loss. In all four interactions, extended high frequency hearing thresholds were computed as a single average across both ears and all frequencies (10, 12.5, 14, and 16 kHz).
All candidate predictors for the stepwise multiple regression (Part 3) were first examined against the ECLiPS Total scaled score via univariate analyses. Continuous candidate predictors were examined using Spearman’s Rho, while categorical predictors were examined via Student’s t-tests. Variables with p < 0.1 in the univariate analysis were included in the stepwise regression. Collinearity among these variables was examined using the Variance Inflation Factor, which ranged from 1.31 to 3.01, indicating no collinearity. Statistical comparison of participants with complete and incomplete data across all demographic variables and candidate predictors yielded no significant differences between the two groups. It was therefore assumed that data were missing at random. All data were included in the stepwise regression via the use of SAS v9.4 (The SAS Institute, Cary, NC) PROC MIXED with restricted maximum likelihood estimation.
Additional, secondary analyses examining correlations between factors other than the ECLiPS were used to follow up on results revealed by the primary analysis. Multiple Spearman’s Rho correlations were used.
Results
Diagnosis of APD
For Part 1 of the analysis, among children with LiD, those with a diagnosis of APD (n = 14-20, depending on test) did not differ significantly (p > 0.05) from those without a diagnosis (n = 25-44), with the exception of two variables. The exceptions were both cognitive verbal scores, the NIH Crystallized Composite and the AVL. For the Crystallized Composite, a Wilcoxon Rank-Sum test indicated that children with a diagnosis of APD had lower scores (mean = 88.0, SD = 15.2) than children lacking a diagnosis (mean = 94.47, SD = 10.36; S = 347.5, p = 0.026). Similarly, the AVL scores were significantly [t(39) = −2.55, p = 0.015] lower for children with an APD diagnosis (mean = −2.47, SD = 2.14) than for those without (mean = −0.85, SD = 1.87). Further t-tests found that both subgroups (Dx, noDx) performed significantly worse than the TD group on both of these verbal measures (p < 0.005).
Effects of LiD
All measures except the LiSN-S Spatial and Total Advantage scores showed significantly poorer performance for the LiD group than for the TD group (Table 2; Figs. 1-3). By design, the mean ECLiPS Total scaled score was much lower [t(141.03) = 22.67, p < 0.001] for children in the LiD group than for those in the TD group (Fig. 1). A repeated-measures ANOVA within the TD group demonstrated that those children had similar mean standardized scores across subscales and the Total score [F(4, 312) = 1.18, p = 0.32], as would be expected if British and US samples were drawn from the same population. An identical ANOVA performed within the LiD group, by contrast, yielded significant differences amongst the ECLiPS subscale scores, which remained significant following Greenhouse-Geisser correction [F(3.12, 206.2) = 15.94, p < 0.001]. Note that, among the ECLiPS subscales, the SAP scale reflects the profile statements that are most closely aligned with listening. SAP ratings of children in the LiD group were all within the lowest 30th percentile based on the test’s standard (UK) normalization, while at least one child in the LiD group scored in the top 25th percentile on each of the other subscales. Descriptive statistics for the ECLiPS and CCC-2 are provided in Table 2 for the TD and LiD groups. Outcomes for the GCC correlated highly with those for the ECLiPS total score [rs(143) = 0.75, p < 0.001], while the SIDI did not [rs(143) = −0.060, p = 0.477]. ECLiPS subscales and their relation to other measures will be considered further in a separate report.
Group standardized means, standard deviations, and Wilcoxon Rank Sum test results for the ECLiPS, SCAN-3:C, LiSN-S, and NIH Cognition Toolbox.

Violin plots with trimmed tails demonstrate the probability density of the data and are overlaid with boxplots indicating the median and interquartile range. Scores are shown for (A) all five ECLiPS subscales (speech & auditory processing, SAP; environmental & auditory sensitivity, EAS; language/ literacy/ laterality, LLL; memory & attention, M&A, and pragmatic & social skills, PSS) as well (B) as its four composite scores (Language, Listening, Social, and Total aggregate). Horizontal, dashed lines reflect expected standard score (here 10) for all scales in all figures.
Scores on the SCAN-3:C composite scale were lower [t(126) = 7.44, p < 0.001] for the LiD group than for the TD group. Details, including descriptive statistics on the SCAN-3:C subscores are shown in Table 2 and Figure 2A. Further t-tests for group differences on each of the SCAN-3:C subtests revealed significant differences between the LiD group and their TD peers on all measures (p < 0.005 in all cases). Results obtained on the composite measure thus reflect all functional domains tested by the SCAN-3:C and the subtests were not further explored in the primary analysis.
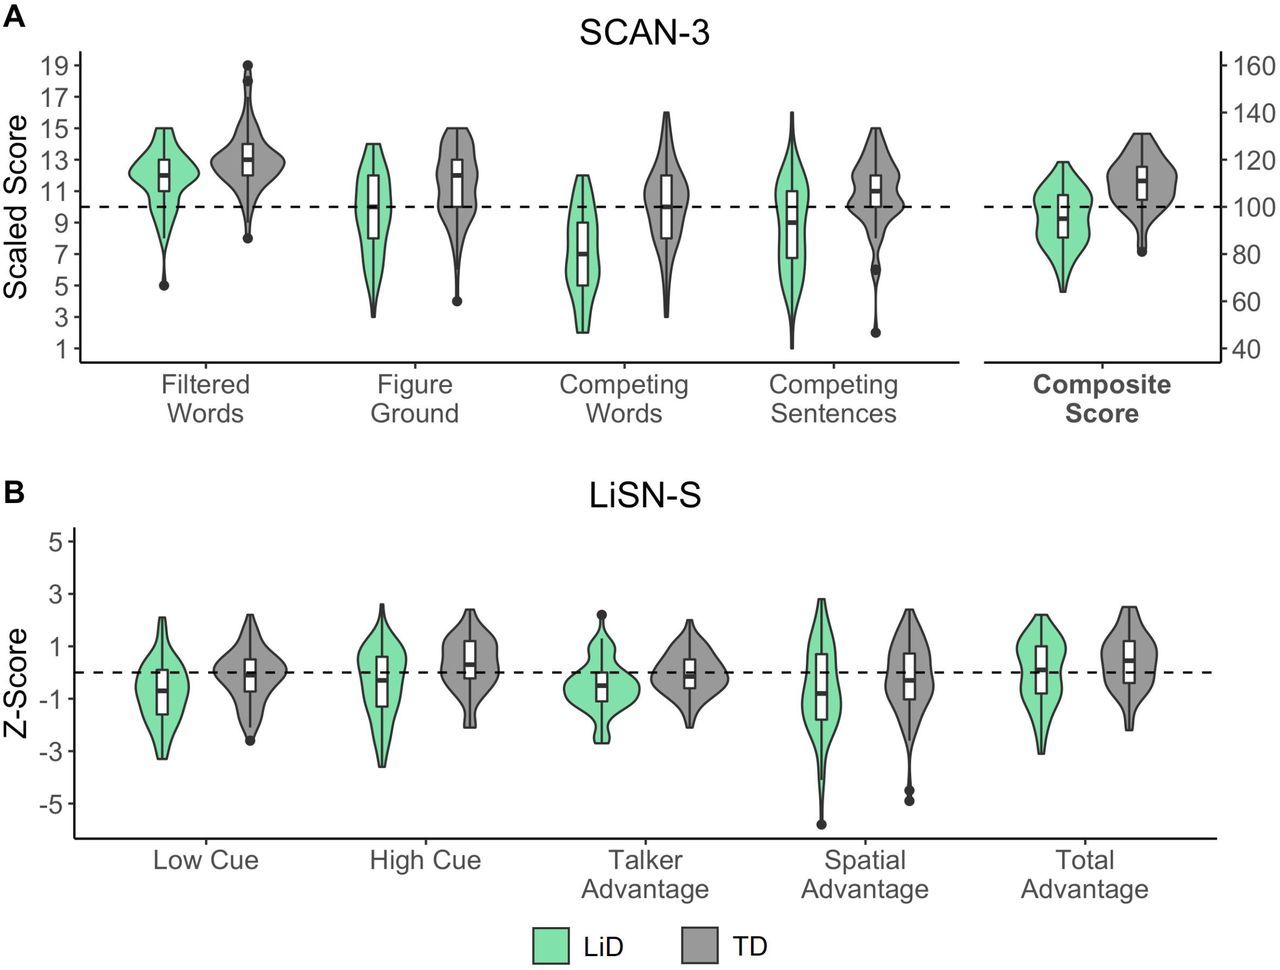
A – SCAN-3:C test for auditory processing disorder in children (Keith, 2009). Violin plots of scores on all subtests and the aggregate (Composite) score. B – LiSN-S listening in spatialized noise test (Cameron & Dillon, 2007). Cue and Advantage scores.
For the LiSN-S, both the Low Cue [t(138) = 3.32, p = 0.001] and Talker Advantage [t(138) = 3.22, p = 0.002] were significantly lower for children with listening difficulties. The Spatial Advantage score demonstrated a nonsignificant trend in the same direction (p = 0.10). Scores on the LiSN-S are summarized by group in Figure 2B and Table 2. Note that Spatial Advantage had more variance, particularly on the lower scoring side, than the other measures. A follow-up analysis of the LiSN-S used a spatial ‘Pattern Score’, developed by Cameron and Dillon (2011) as a quantitative clinical measure of the benefit of adding virtual spatial cues to the information in the Low Cue condition of the LiSN-S (i.e., target and distracting stimuli presented diotically). Pattern Scores did not differ significantly between the LiD (mean = 7.25 dB) and TD (mean = 7.29 dB) groups. However, 7 children in the LiD group and 5 children in the TD group had Pattern Scores within the range to diagnose a ‘spatial processing disorder’ (Cameron & Dillon, 2008; see Discussion).
As can be seen from the Fluid Composite [t(102) = 7.64, p < 0.001], Crystallized Composite [t(115) = 7.69, p < 0.001], Early Childhood Composite [t(102) = 7.64, p < 0.001], and Rey AVL test [t(72.03) = 5.38, p < 0.001], scores in the LiD group were considerably lower than those for the TD group on all domains of the NIH Cognition Toolbox (Table 2, Fig. 3). Group-level differences were also present for all of the individual tests contributing to the composite scores, including the Rey AVL test, not shown in Figure 3 (p < 0.001 in all cases).

Scaled scores from the core NIH Cognition Toolbox (Weintraub et al., 2013) tests by group. A – individual tests of the Fluid Composite scale. B – individual tests of the Crystallized Composite scale. C – the Early Childhood Composite.
Four test scores predicted parent-reported listening skills
Spearman’s Rho and Student’s t-test results for each candidate predictor are summarized in Table 3 for all candidate predictors that demonstrated univariate association with ECLiPS Total Score with p < 0.1. Notable among these was a specific, significant interaction between the LiSN-S Talker Advantage and EHF threshold. One hundred participants had complete datasets across all these predictors. Following stepwise regression, the final model explained 42% of the variance in ECLiPS Total scaled score (F4,95 = 17.35, p < 0.001). This model had an intercept of −14.15 (SE = 3.10) and included four predictors: the SCAN-3:C composite score, the LiSN-S Talker Advantage score, and the NIH Picture Vocabulary and Dimensional Change Card Sorting scores. Table 3 includes the regression coefficients, standard errors, t- and p-values for all of these predictors. Figure 4 compares actual ECLiPS Total scaled scores to those predicted by this model, where perfect predictions lie along the diagonal. As expected, the separation between groups was preserved in the predicted scores, though predicted scores tended to be higher than actual scores for the LiD group and lower for the TD group.
Correlations with the ECLiPS Total Score for all continuous predictors that were entered into the stepwise regression. Regression coefficients and their standard errors, t values, and p values are provided for predictors that were retained in the final model.

Accuracy of the final equation yielded by stepwise multiple regression, which included four predictors: the SCAN-3:C Composite score, the LiSN-S Talker Advantage score, and the NIH Picture Vocabulary Test (PVT) and Dimensional Change Card Sort test (DCCS) scores. Distance from the diagonal reflects the accuracy of the prediction for each individual. Scores below the diagonal reflect instances in which the predicted scores were higher than actual scores, while those above the line were lower than observed.
Correlations between measures
In the secondary analysis, pairwise correlations were computed between all variables, treating each as a continuous predictor across groups (i.e. not separated into LiD or TD). These correlations are shown in Tables 4 and 5. The data in Table 4 show that many tests were highly correlated with the ECLiPS, SCAN and NIH Toolbox composite measures. In contrast, the LiSN-S Advantage measures correlated poorly with most other, non-LiSN-S measures. The SCAN composite correlated to a highly significant level with the Low and High Cue measures of the LiSN-S, but only weakly and non-significantly with the Spatial and Total Advantage measures. Talker Advantage, however, did correlate significantly with the SCAN Composite. Correlations between LiSN-S and SCAN sub-tests (Table 5), showed that the Filtered Words and dichotic (Competing Words and Competing Sentences) tests, and the Low and High Cue measures accounted for almost all of the relationship between SCAN and LiSN-S. Talker Advantage was marginally related to Competing Sentences and Spatial Advantage to Competing Words. However, when corrected for multiple comparisons (Bonferroni, p < 0.01), these relatively weak relationships became non-significant.
Correlation matrix (Spearman’s Rho) comparing test scores as continuous variables across both LiD and TD children.
Correlations between subtests of SCAN and LiSN-S for all children (total n = 124) who completed both tests.
Discussion
In this study, we found that children with LiD, identified primarily on the basis of the ECLiPS caregiver questionnaire, had impaired performance on a broad range of auditory and cognitive tasks relative to age-matched TD children. Tasks included a suite of tests normally used for diagnosing APD, a test for repeating sentences presented against a background of distracting sentences, and a battery of tests measuring fluid and crystallized cognition.
Given normal peripheral function (Hunter et al., 2020), the pattern of deficits observed here with LiD could reflect central auditory (e.g., Cameron et al., 2014, 2015; Graydon et al., 2017; Moore et al., 1991; Pillsbury et al., 1991) or general cognitive (e.g., Moore et al., 2010; Moore, 2018) deficits, or a combination of both. For this reason, the protocol that was developed for our research program cast a wide net, to provide a relatively detailed characterization of the constellation of features that can accompany this complex clinical construct.
Diagnosis of APD
A crucial first step in the analysis was to identify any inhomogeneities in our sample of children with caregiver-reported LiD (as reported on the ECLiPS), some of whom had received clinical diagnoses of APD (Dx), and some of whom had not (noDx). Comparisons between these two subgroups yielded no differences on the ECLiPS Total scaled score, SCAN-3:C composite scaled score, LiSN-S scores (Talker Advantage, Spatial Advantage, and Low Cue scores), or the Fluid Composite and Early Childhood Composite scores of the NIH Cognition Toolbox. However, the Dx subgroup performed significantly more poorly on the NIH Crystallized Composite score and the Rey AVL test. These results suggest that children in the Dx subgroup had more severe problems than those in the noDx subgroup specifically in the cognitive domain.
Nature of listening difficulties
Comparisons between children with LiD and their TD peers yielded differences across nearly all tested domains of auditory and cognitive function, including the ECLiPS Total scaled score, SCAN-3:C composite scaled score, and all of the NIH Cognition Toolbox composite scores (Fluid, Crystallized, Early Childhood), as well as the Rey AVL test. Several of these tests may tap the same underlying deficit. To disentangle such overlapping contributions, a multivariate regression approach was used. The regression successfully explained 42% of the variance in ECLiPS Total scaled scores using four predictors: the SCAN-3:C composite score, the LiSN-S Talker Advantage score, and the NIH Picture Vocabulary and Dimensional Change Card Sorting scores. These findings suggest that both auditory and cognitive factors make unique, significant contributions to predicting listening skills as captured on the ECLiPS. However, we reason below that just one measure, the LiSN-S Talker Advantage, provided some limited evidence of impaired auditory processing.
ECLiPS
It is unusual in hearing research for a case-control study such as this to use a subjective assessment, the ECLiPS, as an independent variable. However, that is an accepted clinical practice in the diagnosis of other neurobehavioral disorders, for example developmental language disorder (Bishop & McDonald, 2009) and attention deficit hyperactivity disorder (Pediatrics, 2011). We suggest that a parent or guardian is usually in the best position to judge their children’s behavior, in this case, how their child responds to the challenges inherent in everyday communication. Several aspects of the ECLiPS results assured us that this was a reasonable decision. First, when caregivers responded to our advertisements, there was a high probability that their child’s ECLiPS score would place them into the group identified by the parent (LiD or TD). Second, we were impressed that mean and variance standardized scores placed this mid-Western US TD sample closely alongside the English normalization data on which the standard scores were derived (Barry et al., 2015). Third, for the children with LiD, the distribution of ECLiPS scores between the various sub-scales seemed consistent with predominantly receptive speech and language deficits. Whether those deficits are of an auditory, cognitive or mixed origin is not directly addressed by the ECLiPS.
Because of the modeling applied to these data, it was possible to observe systematic disparities between caregiver reports and objective measures. To the extent that objective measures capture everyday listening skills, caregivers of children in both groups tended to express a more extreme view of their children’s abilities than the objective data suggested. However, this does not imply that the objective data are more meaningful.
SCAN-3:C
For many years test batteries such as the SCAN (Keith, 2009) have been used to diagnose APD (American Academy of Audiology, 2010; American Speech-Language-Hearing Association, 1996). These batteries test aspects of listening purported to be mediated by central auditory processing, for example ‘closure’, the perceptual capacity to fill in missing or distorted parts of an auditory stimulus, and ‘binaural integration’ (Moncrieff, 2006), the ability to identify different words simultaneously presented to each ear. According to the SCAN manual, closure is represented by the Filtered Words subtest and binaural integration by the Competing Words – Directed Ear subtest. In this study, SCAN composite scores differentiated between the two groups so successfully that the SCAN composite was one of the four measures left in the final multivariate regression that explained nearly half the total sample variance on the ECLiPS. It was thus a strong predictor of LiD.
LiSN-S
We chose the LiSN-S (Cameron & Dillon, 2007) in this study because it is a multi-faceted test of spatial and speech hearing, and was designed specifically for pediatric assessments. It also features ‘derived’ (also called ‘difference’ or ‘subtraction’) testing that we and others have argued can separate cognitive and sensory contributions to auditory perception when comparing performance within and between listeners (Dillon et al., 2014; Moore et al., 2010; Moore, 2012; Moore & Dillon, 2018). For the LiSN-S, performance on individual conditions, for example the Low Cue and High Cue SRT, reflects both the ability to hear the target sentence against the distracting sentences and the ability of the listener to attend selectively to the target, to decode the speech signal, to remember the words in the target sentence, and to repeat each sentence orally. In contrast, for the three derived Advantage measures (Talker, Spatial and Total), performance reflects only the ability to hear the target sentence, assuming that the attention, decoding, memory, linguistic, and reproduction aspects of the task are identical for each of the two contributing individual measures from which each Advantage measure is derived. This assumption appears to be only partly fulfilled for the LiSN-S. The Spatial Advantage relies only on the spatial separation of the distracting talkers, a physical acoustic manipulation. However, the Talker Advantage employs different individual talkers as the distractors, introducing a decoding, a linguistic and, possibly, an attention difference, as well as an acoustic difference between the underlying test conditions.
While Low and High Cue SRTs were higher (i.e. poorer) in the LiD than in the TD group, among the Advantage scores, only the Talker Advantage was significantly poorer in the LiD group, while the Spatial Advantage showed a non-significant trend in that direction. These results are surprising in two respects. The poorer Talker Advantage represents the first and only example of which we are aware of a group difference in this measure in any study (e.g., Cameron & Dillon, 2008). Furthermore, despite the analysis in the previous paragraph, the finding of a significant deficit of the LiD group on a derived measure of hearing may still be direct evidence for impaired auditory system function. This possibility is considered further below in the context of correlations between LiSN-S thresholds, SCAN and EHF measures.
It has been suggested that deficits in the LiSN-S spatial measures are the basis for a specific and treatable disorder termed spatial processing disorder (SPD; Cameron et al., 2011, 2012, 2014; Cameron & Dillon, 2008) that is diagnosed using the LiSN-S Pattern Score. Here, we found evidence for SPD among both LiD and TD groups of children. However, neither the proportion of children with SPD nor the Pattern Score differed significantly between groups, suggesting that SPD is not predictive, and may not be representative, of the listening problems identified by the ECLiPS.
NIH Cognition Toolbox
One of the most consistent and largest deficits experienced by the children with LiD in this study was broadly-specified cognitive function, as also recognized in other recent studies (Moore et al., 2010; Seeto et al., in press; Tomlin et al., 2015). Scores on individual tests were highly correlated and uniformly reduced relative to TD children, suggesting that cognitive function is a major contributor to LiD. Both the Picture Vocabulary and Dimensional Change Card Sorting tests contributed to the final regression model, so further discussion will focus on them. PVT is an index of language and is highly associated with crystallized intelligence and success in school and work. As above, DCCS indexes attention switching, an aspect of executive function (Weintraub et al., 2013). Scores on the PVT and DCCS were highly significantly correlated, despite their attribution to different subdomains of cognition and correspondingly different neural pathways. Further studies in our laboratory are investigating cortical structure and function in this same sample of children using MRI. However, the finding of language and executive function deficits suggests a LiD profile that extends well beyond any notion of a specific auditory processing disorder.
Correlations
Although the SCAN correlated highly with the ECLiPS, a key question remains whether the SCAN tests are primarily markers of central auditory or of cognitive function (Moore et al., 2018). Correlations between the SCAN and the cognitive and LiSN-S variables provide insight into this question. The SCAN Total scaled score correlated significantly with all of the domain composites of the NIH Cognition Toolbox and both the Low cue and High cue individual scores of the LiSN-S. Critically, the SCAN correlated less well with the derived scores of the LiSN-S (Spatial, Talker, Total Advantage). Similarly, the Low Cue score of the LiSN-S correlated well with tests of cognition, as above, but the derived scores of the LiSN-S notably lacked such correlations. Because the derived scores of the LiSN-S reflect a more sensory measure of auditory perception, these data suggest overall that the SCAN is more sensitive to cognitive than to auditory factors that contribute to perception. Although the LiSN-S Talker Advantage was significantly correlated with the SCAN Composite, we suggest above that this could be due to remaining cognitive contributions to the Talker Advantage. The inclusion of the SCAN in the final regression model, and the strong correlation between the ECLiPS Total scaled score and the SCAN Composite suggest the possibility that one or more of the SCAN subtests may be valid predictors of a truly auditory processing disorder. However, as shown in Table 5, even the relation between SCAN dichotic subtests and LiSN-S Advantage measures is weak relative to that between SCAN dichotic subtests and LiSN-S Cue measures.
A final point concerning LiSN-S Talker Advantage is that it, alone among the LiSN-S measures, interacted significantly with EHF threshold. Recently, we have shown that EHF hearing plays a role in speech-in-noise perception in adults (Motlagh Zadeh et al., 2019). Recurrent otitis media in childhood, especially that treated with tympanostomy tubes, appears to contribute to reduced EHF thresholds, as shown in both groups of the sample examined here (Hunter et al., 2020) and in other studies (Hunter et al., 1996). The robust relationship between Talker Advantage and ECLiPS scores may thus receive a contribution from a truly auditory process, EHF hearing, the sensitivity of which is presumably determined by ear function. However, these influences are likely to be minor compared with the dominance of cognitive function in listening.
Overall, the results reported here demonstrate a major influence of impaired cognitive function on listening difficulties of children with normal audiograms, and provide some support for an additional auditory contribution of subclinical hearing loss. Evaluation of children with complaints of listening difficulties should include standardized caregiver observations, extended high frequency audiometry, and consideration of broad cognitive abilities, beyond auditory tests.
Data Availability
The data described in this manuscript is not available for open access.
Contributions of authors to research
L.P. analyzed and interpreted data, and co-wrote the paper; L.H. contributed to the design of the study, provided input to the analysis, and was involved in critical revisions; L.M.Z. collected, analyzed, and interpreted data, contributed to the writing, and was involved in critical revisions; N.T.S. collected, analyzed, and interpreted data, contributed to the writing, and was involved in critical revisions; A.P. collected, analyzed, and interpreted data, contributed to the writing, and was involved in critical revisions; L.L. analyzed and interpreted data and was involved in critical revisions; D.R.M. designed the study, analyzed and interpreted data, and co-wrote the paper.
Acknowledgments
This research was supported by grant DC014078 from the National Institute of Deafness and other Communication Disorders, and by the Cincinnati Children’s Research Foundation. DRM was supported in part by the NIHR Manchester Biomedical Research Centre.
Footnotes
Financial disclosures/conflicts of interest: The research was funded by NIH Grant 5R01DC014078 and Cincinnati Children’s Hospital Research Foundation. There are no conflicts of interest, financial, or otherwise.
Vignette: “There’s a lot of difference between listening and hearing” – G.K. Chesterton, Dr Hyde and the White Pillars Murder, 1925.
References


