
Abstract
The coronavirus (COVID-19) pandemic was particularly invasive in Italy during the period of March to the end of April 2020, then displayed a significant decrease both in the number of infections and in the seriousness of illness throughout the summer of 2020. In this discussion, we measure the seriousness of the disease by the ratio of Intensive Care Units (ICU) spaces occupied by COVID-19 patients and the number of still Active Cases (AC) each month from April to August 2020. We also use the ratio between the number of Deaths (D) and the number of Active Cases. What clearly emerges, from rigorous statistical analysis, is a progressive decrease of both the ratios, indicating progressive mitigation of the disease. This is particularly evident when comparing March-April with July-August; during the summer period the two ratios have become roughly 18 times lower. We test such sharp decreases against possible bias in counting active cases, and we confirm their statistical significance. We then interpret such evidence in terms of the well-known seasonality of the human immune system and the virus-inactivating effect of stronger UV rays in the summer.
Introduction
COVID-19 had devastating effects in the months of March-May 2020 in Europe. The CFR (Case Fatality Ratio) in European countries (updated on May 26, 2020) reached peaks close to 19% in France, about 16% in Belgium, and around 14% in Italy, UK and Hungary (Oke and Henegan, 2020). De Natale et al. (2020) discuss the reasons for the high CFR in Italy and these results could potentially be applied to other European countries with very high CFR rates. The main cause, recently confirmed by widespread randomized serological tests in Italy, was in fact the large underestimation of the true number of infections during the peak of pandemic. Recent studies indicate that the true number of infected people in Italy was around 1.5 million people, i.e. about six times the tested confirmed cases (ISTAT, 2020). With such a correction, the Infection Fatality Rate (IFR), which represents the true lethality of this infection, drops to about 2.3. As occurred in Italy, it is likely that other European countries experienced a higher infection rate than was understood at the time. Another problem, experienced in the most severely impacted Italian region Lombardy, was the near-collapse of the health infrastructure accompanied by crisis management errors during the infection peak (De Natale et al., 2020). Lombardy had the highest CFR in Italy, at close to 20%. Other countries with very high CFR likely had similar contexts. It is clearly evidenced that countries with a very strong health system, like Germany, are characterised by much lower CFR (Oke and Henegan, 2020).
Starting in May 2020, COVID-19 seemed to lose much of its severity in Italy. This was very clearly evidenced to medical staff with direct experience with patients in the main hospitals and raised lively debates in Italy that were reported (besides Italian media) also by International press agencies (Reuters, 2020). Such limited, clinical observations raised political-social discussions in Italy about the need to continue strict containment measures. The evolution of the infection transfers and consequent illnesses during the summer and after the relaxation of the lockdown and other containment measures was far milder than expected by epidemiological forecasts (Vespignani et al., 2020; Vollmer et al., 2020). In this paper, we statistically analyse data of ICU occupation and deaths due to COVID-19 as related to the number of active cases from the end of March to August. When rigorously tested, the ratios of ICU occupation to active cases and the ratios of deaths to active cases show significant changes, thus indicating a change in the evolution of the illness from spring to summer 2020. The likely implications of such changes are then interpreted and discussed, taking into account the possible factors affecting the illness: weakening of the virus, counting bias, and changes in the immune response. The results and interpretation are then discussed in light of a possible forecast of what kind of evolution we could expect in the coming months (Autumn-Winter 2020-2021). Finally, we discuss the implications of these observations, made in Italy, for the more general worldwide situation.
Data analysis
We study the global, clinical evolution of COVID-19 in Italy using the data of ICU occupation numbers, deaths, and active cases in different periods. As De Natale et al. (2020) point out, ICU numbers and deaths are rather robust data whereas recording of active cases can be strongly biased by heterogeneous testing, loss of asymptomatic cases, etc. Recently, the first results of a massive testing campaign to randomly check the percentage of people expressing antibodies to SARS-CoV-2 were released (ISTAT report, 2020). Such tests confirm, as first hypothesized by De Natale et al. (2020), that the number of infected people was about six times larger than indicated by official tests, reaching about 1.5 million people (instead of about 250.000 officially tested positive). In the following analyses, we first assume that such high underestimation of active cases has been almost constant during the analysed period; then, we test our results with respect to the maximum bias implied by such an underestimation. Data on active cases, ICU occupation numbers, and deaths in Italy are from the Department of Italian Civil Protection Repository (2020). Here, we report the time evolution of the ratio between the number of people in ICU and the total number of ‘active’ cases (i.e., total less recovered and deaths, at that time), indicated by ICU/AC.
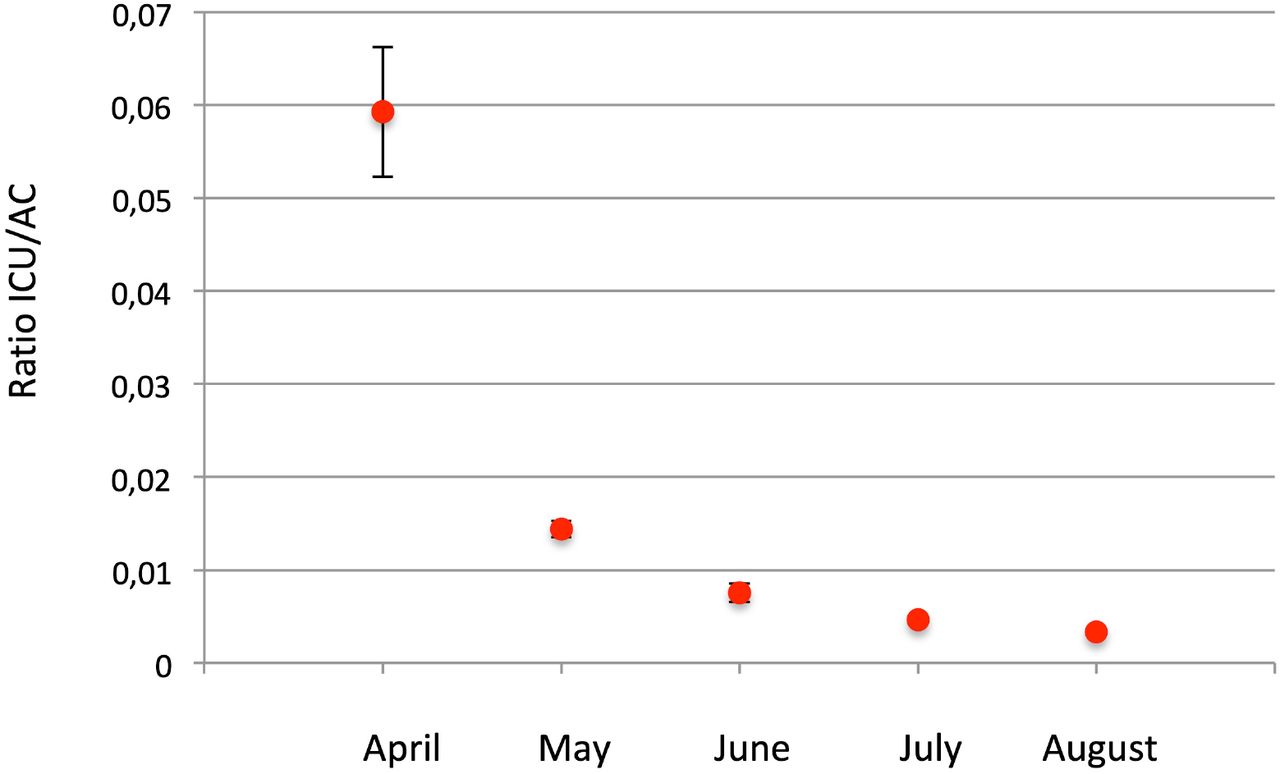
In order to make our estimates more robust, we choose to consider another important and robust indicator: the number of deaths. We therefore also use the ratio between the number of deaths and the number of active cases, indicated as D/AC. In order to get more accurate estimates, we also considered the average time lag from COVID-19 confirmation (the actual data on active infection we have) and the ICU admission as from COVID-19 confirmation to death. According to Wilson et al. (2020), the average time lag between infection confirmation and ICU admission is 6 days whereas the average time lag between infection confirmation and death is 13 days. For this reason, we shift the median day in which we compute the active cases to 6 days before the median day of the ICU number computation; we accordingly shift the median day to compute the number of deaths to 7 days after the ICU median day (so that there are 13 days between the days of active cases computation and the corresponding days of deaths computation). As April 3, 2020 was the day of maximum ICU occupation in Italy for COVID-19 cases we used the third day of each month, from April to August, as the median day to consider ICU occupation numbers. The median days for considering active cases and deaths are chosen accordingly with the described shifts: so that for active cases we take the 27th or 28th of the month before (depending if it has 30 or 31 days), and for deaths we take the 10th of each month considered. In order to obtain more robust estimates of the various data, we choose to average the data during 7 days around each median day (considering also 3 days before and 3 days after the median day). We then computed the two quantities - ICU/AC and D/AC - as the respective averages for each month. The results, for months from April to August, are reported in Table1 and Figure1. The data in Figure 1 show the statistical uncertainties at 95% (2 standard deviations) and indicate that both the ratios sharply decrease, with decreasing values clearly separated, well above the statistical uncertainty. Another way to look at such marked change is to consider the ratios of ICU/AC and D/AC computed for April to each one of the following months.
Ratios ICU/AC and D/AC. Indicated uncertainties are statistical errors computed at 95% probability level (2a).

Ratio between ICU occupation and active cases in each month, from April to August. Error bars are as in table 1 (statistical errors at 95% probability level, i.e. two standard deviations).
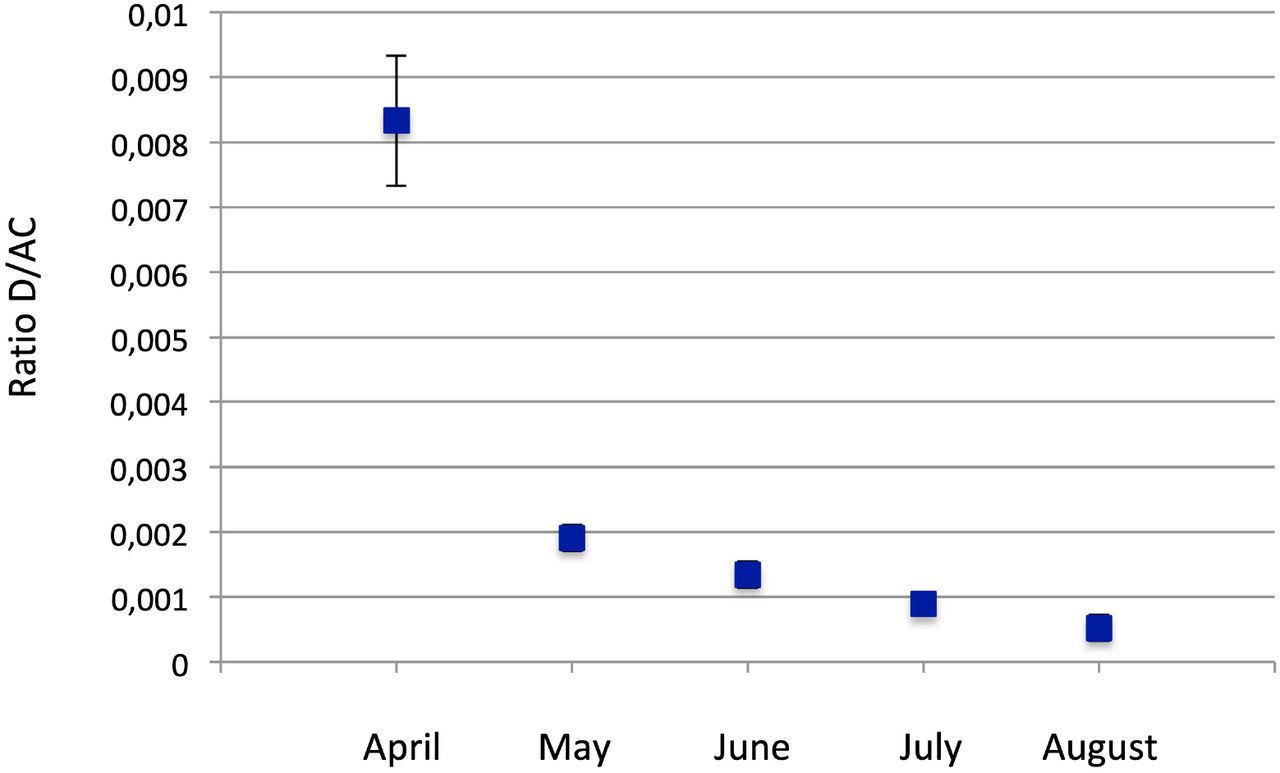
Ratio between deaths and active cases in each month, from April to August. Error bars are as in table 1 (statistical errors at 95% probability level, i.e. two standard deviations).
The computed values of such ratios are reported in Table 2, and shown in Fig.2.

Relative ratios of ICU/AC in April, with respect to the following months May to August. Error bars are as in table 1 (statistical errors at 95% probability level, i.e. two standard deviations).

Relative ratios of D/AC in April, with respect to the following months May to August. Error bars are as in table 1 (statistical errors at 95% probability level, i.e. two standard deviations).
Relative ratios ICU/AC and D/AC between April and following months. Indicated uncertainties are statistical errors computed at 95% probability level (2a).
As is clear, both the ratios progressively and rapidly increase: from April to June, the relative ratio (ICU/CA)April/(ICU/CA)June increases of a factor 7.9, and the relative ratios (D/CA)April/(D/CA)June of a factor 6.2; from April to August, the relative ratio (ICU/CA)April/(ICU/CA)August increases of a factor 17.6 and the relative ratio (D/CA)April/(D/CA)August of a factor 16.7.
These increases are exceptionally marked. Assuming the problems of estimating the true number of active cases are constant in time they unequivocally indicate that the illness became progressively milder during the summer months. The next step, however, is to consider the maximum possible bias due to heterogeneity in the counting procedures of infected people. As we said, we are now able to consider the massive underestimation of infection rates that occurred in Italy in the first months of the pandemic; this error indicates a factor of six more people infected than officially tested positive (ISTAT report, 2020). Then, in order to compute the maximum bias such a fluctuating underestimation could imply in our computations we assume that all of the underestimation occurred in the months of March-April and that in the last summer months we succeeded in testing all COVID-19 positive cases. Such an assumption divides the March-April ratios (ICU/AC and D/AC) by a factor 6 to test the obtained values against the values computed for August (with data from July-August).
We then performed a rigorous test of hypothesis to determine if the observed increase of the ratios in August, with respect to the ratios in April though decreased of a factor 6, is significant. We applied the well-known Student’s test (Spiegel, 1992).
The Student’s test starts by assuming the following formula for the t-variable (Spiegel, 1992):
 where:
  and
and  are the average values of ICU/AC (or D/AC) for April and August respectively, and
  and
and  are the respective variances as computed from the samples, n is the number of samples. The number of degrees of freedom is 14-2=12 (14 is the cumulative number of the two samples tested). In the assumption of the null hypothesis, μ1 and μ2, the true average values of the two samples are equal, and the value of the t-variable can be tested with respect to the Student’s distribution. For our data, the values result t=9.2 for the ratios ICU/AC, and t=6.3 for the ratios D/AC, which are both largely out of 99.99% probability limits for the Student’s distribution, out of the smallest limits shown in the tables. So, we can very confidently assess that the decrease of the ratios ICU/AC and D/AC, from April to August, is significant for both the variables, even if the maximum bias due to infection counting procedures is assumed, with less than 0.01% probability of being wrong.
Discussion and Conclusions
Interpreting the very clear evidence that the disease has become progressively less severe, particularly in July-August, is not as simple as it would appear. The simplest explanation could be that the virus itself, which is continuously mutating and adapting to the host (Geoghegan et al., 2018), lost much of its lethality. With COVID-19, however, we should consider that the severity of the disease is mostly determined by the response of the human immune system (Song et al., 2020). The scientific literature currently provides no clear evidence for the virus becoming substantially mutated and less aggressive. There is evidence for some mutations which actually made the disease less severe (Barnaby et al., 2020; Benedetti et al., 2020); however, there is no indication that such mutations currently have a large diffusion (or have increased compared to past months) in order to significantly mitigate the disease. Hence, the hypothesis that the observed mitigation is due to the large diffusion of a significant virus mutation lacks scientific basis. It is well known that infectious diseases (Fishman, 2007) as well as auto-immune diseases are characterized by an evident seasonality (Iikuni et al., 2007; Moltchanova et al., 2009). The main reason for this appears to be the seasonal variation of the human immune system response, which has been assessed even in terms of gene expression (Dopico et al., 2015). In particular, during the summer the immune system response is more effective and less inflammatory. It is proven that during European winters the human immune system has a marked pro-inflammatory character, with increased levels of soluble Il-6 receptor and C reactive protein (Dopico et al., 2015). An inflammatory response by the immune system, with cytokine storms, has been recognised as the main factor leading to lung and/or other organs failure and death (e.g. Song et al., 2020).
Hence, besides widespread evidence that almost all the flu-like epidemics are strongly dampened during the summer, there is a very fundamental reason because this is even more so in the case of COVID-19: in the acute phase, COVID-19 behaves like an autoimmune syndrome and so is particularly sensitive to the seasonality of the immune response (Dopico et al., 2015; Iikuni et al., 2007). Other researchers previously noted some seasonal/climate effects (e.g. Scafetta, 2020; Carleton and Meng, 2020). In addition, it has been proven the summer sunlight rapidly inactivates Sars-Cov-2 (Ratnesar-Shumate et al., 2020).
It is important to highlight that other explanations, based on the possible bias due to inhomogeneous counting and/or mean age of the infected people in the different periods, as often claimed also on the basis of a relatively younger age inferred for recently recorded infections (ISS, 2020), do not appear to be sufficient to explain the significant decrease of the ICU/AC and D/AC in the summer months. In addition to our demonstration here relative to the possible bias of inhomogeneous counting, there is compelling evidence (Davies et al., 2020) that susceptibility to the virus of population older than 20 years is more than double with respect to younger population. Such evidence makes obviously very unlikely to imagine that only very young people in Italy are being infected, and such infection does not spread also into the older population. The most likely explanation of the inferred lower mean age of recent infections is that, actually, due to the predominance of rather asymptomatic cases, the testing is mostly operated to control young people coming back from summer vacations. Then, a very strong decrease of the seriousness of the disease in the summer months appears the only realistic explanation of data.
What we have described in the Italian case seems to also be able to explain the comparatively low lethality of the virus in recent months observed even in countries experiencing a very large number of infections. Countries like the USA, India, Brazil, and almost all the South American and North African countries, in which epidemics are active, are experiencing much lower CFR (Case Fatality Rates) compared to what European countries experienced in the spring of 2020 (Oke and Henegan, 2020). Among them, the rate (CFR=0.8) in Israel is extremely low. Except in few cases (like Israel, for instance) it is not probable that all of these countries are recording the real number of infection cases with much higher precision than the European countries.Our conclusions also validate previous observations, made on Covid-19 worldwide, which already noted, even without a clear explanation, that the evolution of Covid-19 was more mitigated in countries characterized by milder climate (Scafetta, 2020; Carlton and Meng, 2020; Sajadi et al., 2020; Ficetola and Rubolini, 2020). The largely mitigated effect of COVID-19 epidemics in Italy, despite the acute situation in the months of March-April (De Natale et al., 2020), strongly validates its management of the epidemics and the Italian lockdown strategy. We should note, in fact, that just after the first reopening, in the middle of May 2020, epidemiological studies predicted a very large increase of infections, severe cases, and deaths (Vespignani et al., 2020; Vollmer et al., 2020). Instead, despite the complete re-openings of June 3, 2020, such dire forecasts have been completely discounted, confirming the appropriateness of the response and progression from complete lockdown to gradual and then complete re-opening.
As we conclude here, the recent mitigation of the illness is mostly due to the seasonality of immune response, which is more effective and less inflammatory in the summer, combined with the strongly germicidal power of the summer sun’s UV rays. It remains to be seen what the practical implications are for future procedures in order to avoid new epidemic waves. Obviously, despite several media (and some doctors with direct clinical experience) claims that the virus has lost power, if the illness mitigation is only attributable to the summer season we should be very careful to continue the ‘mild’ actions of containment (social distancing, face masks in close environments, etc.) in order to avoid, in autumn and winter, the possible escalation of epidemics with renewed need for partial or total lockdowns. It is also possible that, superimposed on the seasonal effects, there is also a weakening of the virus due to natural mutations and adaptations to the host; however, we have no clear evidence for this in scientific literature. An eventual weakening of the SARS-CoV-2 virus may be evident in autumn 2020, when the concomitant seasonal effect will no longer apply. Before then, it will be good practice to maintain all the precautions to contain the epidemics.
Data Availability
All data used are in public repository, both Italian and International
Footnotes
Some statistics improved; more references added; discussion improved


