
Abstract
Background Chest pain is among the most common presenting complaints in the emergency department (ED). Swift and accurate risk stratification of chest pain patients in the ED may improve patient outcomes and reduce unnecessary costs. Traditional logistic regression with stepwise variable selection has been used to build risk prediction models for ED chest pain patients. In this study, we aimed to investigate if machine learning dimensionality reduction methods can achieve superior performance than the stepwise approach in deriving risk stratification models.
Methods A retrospective analysis was conducted on the data of patients >20 years old who presented to the ED of Singapore General Hospital with chest pain between September 2010 and July 2015. Variables used included demographics, medical history, laboratory findings, heart rate variability (HRV), and HRnV parameters calculated from five to six-minute electrocardiograms (ECGs). The primary outcome was 30-day major adverse cardiac events (MACE), which included death, acute myocardial infarction, and revascularization. Candidate variables identified using univariable analysis were then used to generate the stepwise logistic regression model and eight machine learning dimensionality reduction prediction models. A separate set of models was derived by excluding troponin. Receiver operating characteristic (ROC) and calibration analysis was used to compare model performance.
Results 795 patients were included in the analysis, of which 247 (31%) met the primary outcome of 30-day MACE. Patients with MACE were older and more likely to be male. All eight dimensionality reduction methods marginally but non-significantly outperformed stepwise variable selection; The multidimensional scaling algorithm performed the best with an area under the curve (AUC) of 0.901. All HRnV-based models generated in this study outperformed several existing clinical scores in ROC analysis.
Conclusions HRnV-based models using stepwise logistic regression performed better than existing chest pain scores for predicting MACE, with only marginal improvements using machine learning dimensionality reduction. Moreover, traditional stepwise approach benefits from model transparency and interpretability; in comparison, machine learning dimensionality reduction models are black boxes, making them difficult to explain in clinical practice.
Background
Chest pain is among the most common chief complaints presenting to the emergency department (ED) [1-3]. The assessment of chest pain patients poses a diagnostic challenge in balancing risk and cost. Inadvertent discharge of ACS patients is associated with higher mortality rates while inappropriate admission of patients with more benign conditions increases health service costs [4, 5]. Hence, the challenge lies in recognizing low-risk chest pain patients for safe and early discharge from the ED. There has been increasing focus on the development of risk stratification scores. Initially, risk scores such as the Thrombolysis in Myocardial Infarction (TIMI) score [6, 7] and the Global Registry of Acute Coronary Events (GRACE) score [8] were developed from post-ACS patients to estimate short-term mortality and recurrence of myocardial infarction. The History, Electrocardiogram (ECG), Age, Risk factors, and initial Troponin (HEART) score was subsequently designed for ED chest pain patients [9], which demonstrated superior performance in many comparison studies on the identification of low-risk chest pain patients [10-17]. Nonetheless, the HEART score has its disadvantages. Many potential factors can affect its diagnostic and prognostic accuracy, such as variation in patient populations, provider determination of low-risk heart score criteria, specific troponin reagent used, all of which contribute to clinical heterogeneity [18-21]. In addition, most risk scores still require variables that may not be available during the initial presentation of the patient to the ED such as troponin. There remains a need for a more efficient risk stratification tool.
We had previously developed a heart rate variability (HRV) prediction model using readily available variables at the ED, in an attempt to reduce both diagnostic time and subjective components [22]. HRV characterizes beat-to-beat variation using time, frequency domain and nonlinear analysis [23], and has proven to be a good predictor of major adverse cardiac events (MACE) [22, 24, 25]. Most HRV-based scores were reported to be superior to TIMI and GRACE scores while achieving comparable performance with HEART score [17, 24, 26, 27]. Recently, we established a new representation of beat-to-beat variation in ECGs, the heart rate n-variability (HRnV) [28]. HRnV utilises variation in sampling RR-intervals and overlapping RR-intervals to derive additional parameters from a single strip of ECG reading. As an extension to HRV, HRnV potentially supplements additional information about adverse cardiac events while reducing unwanted noise caused by abnormal heart beats. Moreover, HRV is a special case of HRnV when n = 1. The HRnV prediction model, developed from multivariable stepwise logistic regression, outperformed the HEART, TIMI and GRACE scores in predicting 30-day MACE [28]. Nevertheless, multicollinearity is a common problem in logistic regression models where supposedly independent predictor variables are correlated. They tend to overestimate the variance of regression parameters and hinder the determination of the exact effect of each parameter, which could potentially result in inaccurate identification of significant predictors [29, 30]. In the paper, 115 HRnV parameters were derived but only seven variables were left in the final prediction model, and this implies the possible elimination of relevant information [28].
Within the general medical literature, machine learning dimensionality reduction methods are uncommon and limited to a few specific areas, such as bioinformatics studies on genetics [31, 32] and diagnostic radiological imaging [33, 34]. Despite this, dimensionality reduction in HRV has been investigated and shown to effectively compress multidimensional HRV data for assessment of cardiac autonomic neuropathy [35]. In this paper, we attempted to investigate several machine learning dimensionality reduction algorithms as possible alternatives to stepwise selection, hypothesizing that these algorithms could be useful in preserving useful information while improving prediction performance. We aimed to compare the performance of HRnV-based dimensionality reduction models against HRnV stepwise logistic regression model and conventional risk stratification tools such as the HEART, TIMI, and GRACE scores, in the prediction of 30-day MACE in chest pain patients presenting to the ED.
Methods
Study design and clinical setting
A retrospective analysis was conducted on data collected from patients >20 years old who presented to Singapore General Hospital ED with chest pain between September 2010 to July 2015. These patients were triaged using the Patient Acuity Category Scale (PACS) and those with PACS 1 or 2 were included in the study. Patients were excluded if they were lost to the 30-day follow-up or if they presented with ST-elevation myocardial infarction (STEMI) or non-cardiac aetiology chest pain such as pneumothorax, pneumonia and trauma as diagnosed by the ED physician. Patients with ECG findings that precluded quality HRnV analysis such as artefacts, ectopic beats, paced or non-sinus rhythm were also excluded.
Data collection
For each patient, HRV and HRnV parameters were calculated using HRnV-Calc software suite [28, 36] from a five to six-minute single-lead (lead II) ECG performed via the X-series Monitor (ZOLL Medical, Corporation, Chelmsford, MA). Table 1 shows the full list of HRV and HRnV parameters used in this study. In addition, the first 12-lead ECGs taken during patients’ presentation to the ED was interpreted by two independent clinical reviewers and any pathological ST changes, T wave inversions and Q-waves were noted. Patients’ demographics, medical history, first set of vital signs and troponin-T values were obtained from the hospital’s electronic health records (EHR). In this study, high-sensitivity troponin-T was selected as the cardiac biomarker and an abnormal value was defined as >0.03ng/mL.
List of traditional heart rate variability (HRV) and novel heart rate n-variability (HRnV) parameters used in this study.
The primary outcome measured was any MACE within 30 days, including acute myocardial infarction (STEMI/Non-STEMI), emergent revascularization procedures such as percutaneous coronary intervention (PCI) or coronary artery bypass graft (CABG), or death. The primary outcome was captured through retrospective review of patients’ EHR.
Machine learning dimensionality reduction
Dimensionality reduction in machine leaning and data mining [37] refers to the process of transforming high-dimensional data into lower dimensions such that less features are selected or extracted while preserving essential information of the original data. Two types of dimensionality reduction approaches are available, namely feature selection (commonly called variable selection in biostatistics) and feature extraction. Feature selection methods generally reduce data dimensionality by choosing a subset of variables, while feature extraction methods transform the original feature space into lower-dimensional space through linear or nonlinear feature projection. In clinical predictive modelling, feature selection techniques such as stepwise logistic regression are popular for constructing prediction models [38]. In contrast, feature extraction approaches [39] are less commonly used in medical research, although they have been widely used in computational biology [40], image analysis [41, 42], physiological signal analysis [43], among others. In this study, we investigated the implementation of eight feature extraction algorithms and evaluated their contributions to prediction performance in risk stratification of ED chest pain patients. We also compared them with a prediction model that was built using conventional stepwise variable selection [28]. Henceforth, we use the terms “dimensionality reduction” and “feature extraction” interchangeably.
Given that there were n samples (xi, yi), i = 1,2, …, n, in the dataset (X, y), where each sample xi had original D features/variables and its label yi = 1 or 0, with 1 indicating a positive primary outcome, i.e. MACE within 30 days. We applied dimensionality reduction algorithms to project xi into a d-dimensional space (d < D). As a result, the original dataset X ∈ ℝn×D became  . There was a total of D = 174 candidate variables in this study. As suggested in Liu et al. [28], some variables were less statistically significant in terms of contributions to the prediction performance. Thus, we conducted univariable analysis and preselected a subset of
  variables if their
  , where
  was a threshold determined by predictive performance using PCA [44], the most common technique for linear dimensionality reduction. In this study, we implemented eight dimensionality reduction algorithms, including PCA, kernel PCA (KPCA) [45] with polynomial kernel function, latent semantic analysis (LSA) [46], Gaussian random projection (GRP) [47], sparse random projection (SRP) [48], multidimensional scaling (MDS) [49], Isomap [50], and locally linear embedding (LLE) [51]. All these algorithms are unsupervised learning methods, meaning the transformation of feature space does not rely on sample labels y. Among the eight methods, MDS, Isomap, and LLE are manifold learning-based techniques for nonlinear dimensionality reduction.
Predictive and statistical analysis
In this study, we chose logistic regression as the classification algorithm to predict the MACE outcome. Before applying all eight dimensionality reduction algorithms, we ran PCA and logistic regression through 5-fold cross-validation to determine the threshold  to preselect a subset of
  variables, such that the prediction performance in terms of area under the curve (AUC) was the largest. We did this preselection to ensure the removal of less significant variables as shown by univariable analysis, after which X ∈ ℝn×D became
  . In summary, the inputs to all dimensionality reduction algorithms were in
  -dimensional space. Subsequently, conventional logistic regression was implemented to take d-dimensional
  to predict y, where 5-fold cross-validation was used.
To compare machine learning dimensionality reduction and traditional stepwise variable selection, we implemented our previously built logistic regression model [28], in which the following 16 variables were used: age, diastolic blood pressure, pain score, ST-elevation, ST-depression, Q wave, cardiac history (the “History” component in the HEART score), troponin, HRV NN50, HR2V skewness, HR2V SampEn, HR2V ApEn, HR2V1 ApEn, HR3V RMSSD, HR3V skewness, and HR3V2 HF power. The predictive performances of eight models built from different dimensionality reduction algorithms and the model obtained using convention stepwise variable selection [28] were compared with the receiver operating characteristic (ROC) curve analysis, and the corresponding sensitivity, specificity, positive predictive value (PPV), and negative predictive value (NPV) measures were reported. The calibration plots of all nine prediction models were also generated. All analyses were conducted in Python version 3.8.0 (Python Software Foundation, Delaware, USA).
Results
We included 795 chest pain patients in this study, of which 247 (31%) patients had MACE within 30 days of presentation to the ED. Table 1 presents the baseline characteristics of the patient cohort. Patients with MACE were older (median age 61 years vs. 59 years, p = 0.035) and more likely to be male (76.1% vs. 64.6%, p = 0.002). History of diabetes, current smoking status, and pathological ECG changes such as ST elevation, ST depression, T wave inversion, pathological Q waves, and QTc prolongation were significantly more prevalent in patients with the primary outcome. Troponin-T and creatine kinase-MB levels were also significantly elevated in patients with the primary outcome. There was no statistically significant difference in patient ethnicity between MACE and non-MACE groups.
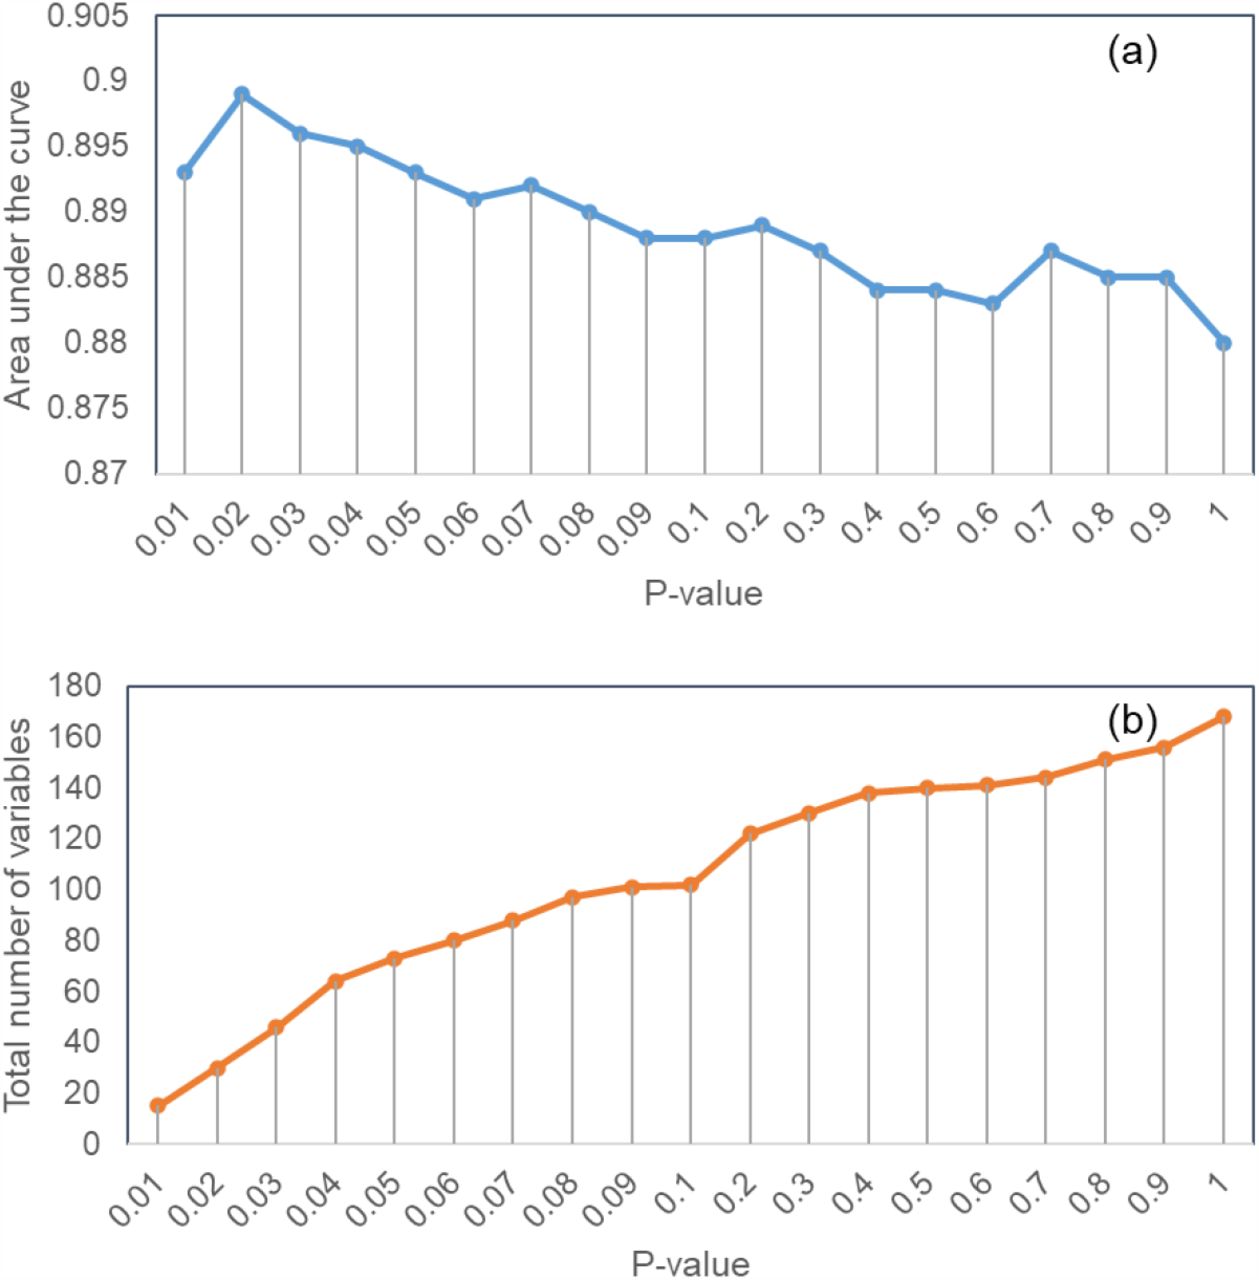
Figure 1(a) depicts the PCA-based predictive performance versus the threshold  (for preselection of variables) and Figure 1(b) shows the number of preselected variables versus threshold
  . The predictive performance peaked at
  , where a total of 30 variables were preselected, including gender, diastolic blood pressure, pain score, ST-elevation, ST-depression, T-wave inversion, Q wave, cardiac history, EKG and risk factor components of the HEART score, troponin, HRV RMSSD, HRV NN50, HRV pNN50, HRV HF power, HRV Poincaré SD1, HR2V RMSSD, HR2V NN50, HR2V pNN50, HR2V HF power, HR2V Poincaré SD1, HR2V1 RMSSD, HR2V1 NN50, HR2V1 HF power, HR2V1 Poincaré SD1, HR3V1 RMSSD, HR3V1 HF power, HR3V1 Poincaré SD1, HR3V2 RMSSD, and HR3V2 Poincaré SD1. These were used as inputs to all dimensionality reduction algorithms whose outputs were linear or nonlinear combinations of these 30 variables.

Variable preselection using p-value in univariable analysis for dimensionality reduction: (a) prediction area under the curve versus the p-value, and (b) the number of preselected variables versus the p-value.
Figure 2 shows the predictive performance (in terms of AUC value) versus feature dimension (i.e. number of “principal components”) for all eight dimensionality reduction algorithms. The AUC values of GRP, SRP, and KPCA gradually increased with the increment of feature dimension, while the AUC values of PCA, LSA, MDS, Isomap, and LLE drastically jumped to more than 0.8 when feature dimension d ≥ 3 and plateaued in the curves when d ≥ 15. The highest AUC values of PCA, KPCA, LSA, GRP, SRP, MDS, Isomap, and LLE were 0.899, 0.896, 0.899, 0.896, 0.898, 0.901, 0.888, and 0.898, achieved with feature dimensions of 15, 30, 15, 22, 20, 27, 23, and 30, respectively.
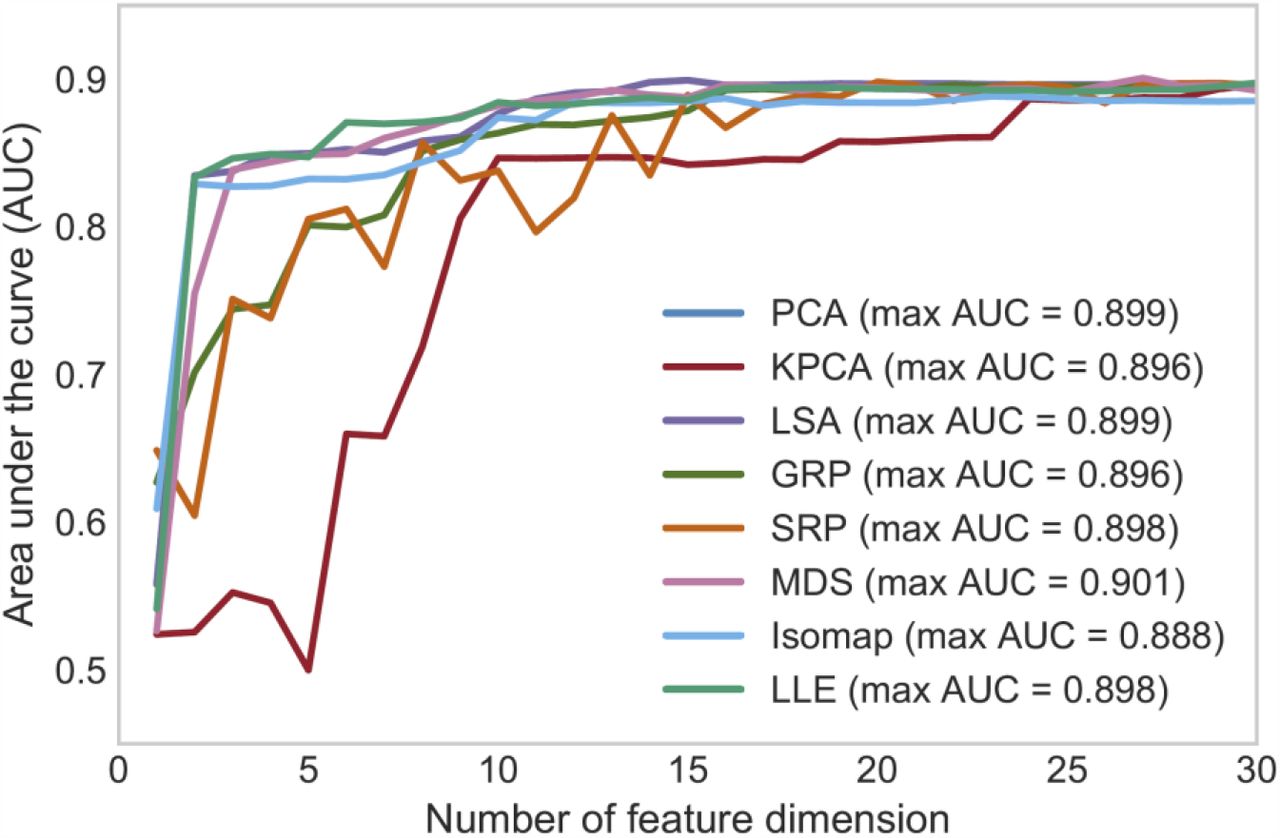
Prediction performance based on the eight dimensionality reduction algorithms versus the number of feature dimensions after reduction.
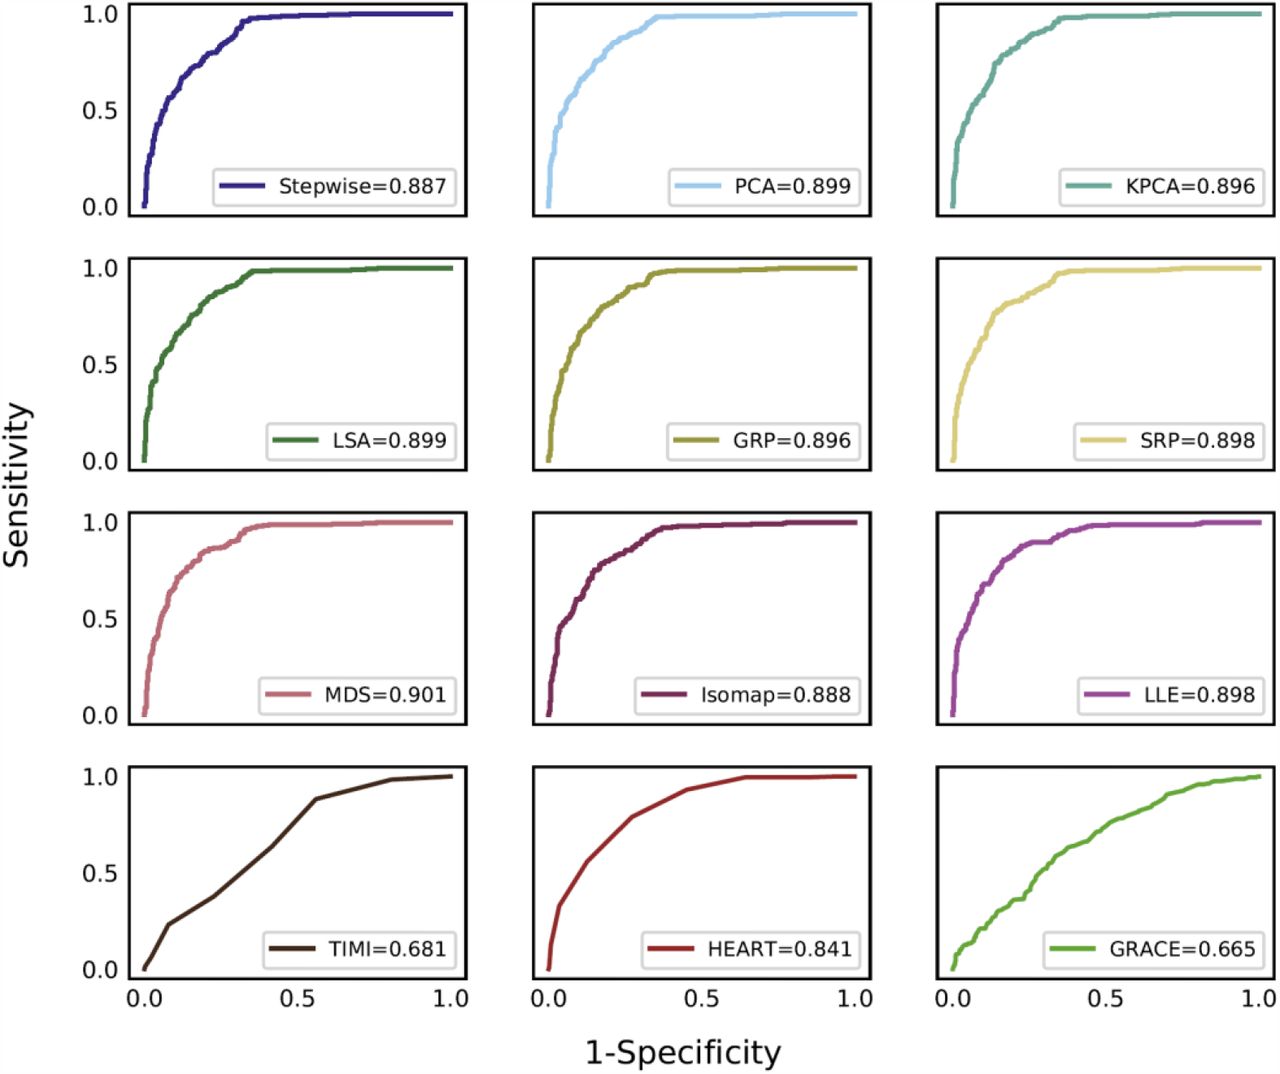
Figure 3 shows the ROC curves of the eight dimensionality reduction algorithms, the stepwise logistic regression, and three clinical scores. All eight dimensionality reduction methods marginally outperformed the stepwise variable selection, and MDS performed the best with an AUC of 0.901. Table 3 presents ROC analysis results of all 12 methods/scores where sensitivity, specificity, PPV, and NPV are reported with 95% confidence intervals (CIs). Figure 4 presents the calibration curves of predictions by all methods/scores. The stepwise model and seven dimensionality reduction models (PCA, KPCA, LSA, GRP, SRP, MDS, and Isomap) showed reasonable model calibrations, in which their curves fluctuated along the diagonal line, meaning these models only slightly overestimated or underestimated the predicted probability of 30-day MACE. The LLE model was unable to achieve good calibration. In comparison, all three clinical scores (HEART, TIMI, and GRACE) generally underpredicted the probability of 30-day MACE.
Baseline characteristics of patient cohorts.
Comparison of performance of the HRnV models (based on 5-fold cross-validation), HEART, TIMI, and GRACE scores in predicting 30-day major adverse cardiac events (MACE). The cut-off values were defined as the points nearest to the upper-left corner on the ROC curves.

ROC curves (based on the optimal number of dimensions) generated by the stepwise model, eight dimensionality reduction models, and three clinical scores.

Calibration curves (based on the optimal number of dimensions) generated by the stepwise model, eight dimensionality reduction models, and three clinical scores.
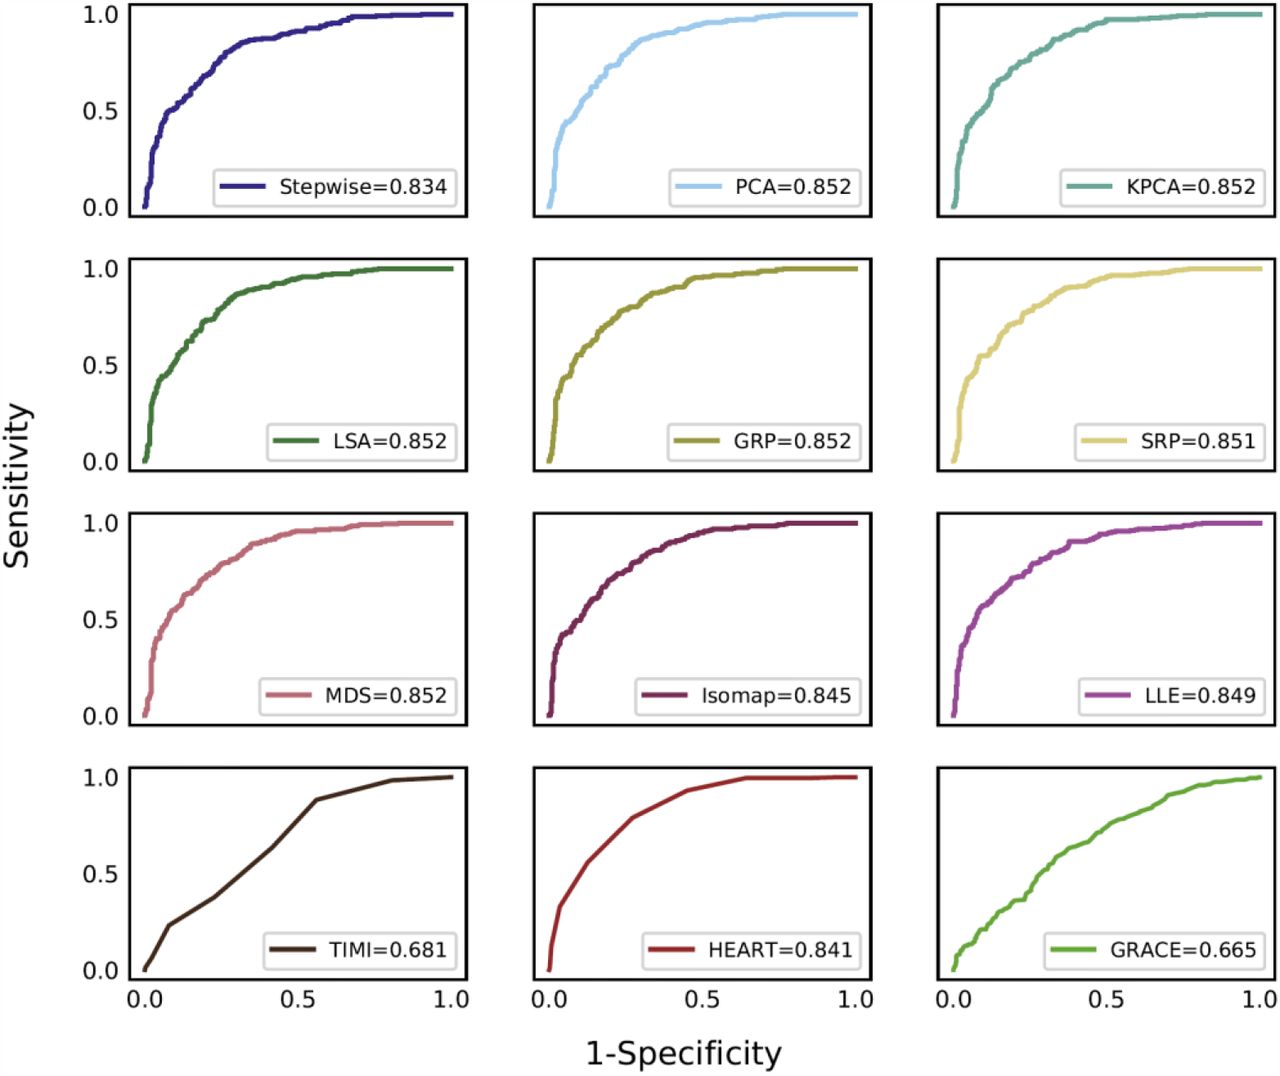
Figure 5 shows ROC curves of HRnV models without using cardiac troponin. At feature dimensions of 13, 21, 13, 29, 24, 17, 18, and 18, the highest AUC values of PCA, KPCA, LSA, GRP, SRP, MDS, Isomap, and LLE were 0.852, 0.852, 0.852, 0.852, 0.851, 0.852, 0.845, and 0.849, respectively. The stepwise model without troponin yielded an AUC of 0.834 compared to 0.887 with troponin. All HRnV-based prediction models outperformed both the TIMI and GRACE scores, while achieving marginally better results than the HEART score.
ROC curves (based on the optimal number of dimensions) generated by the stepwise model, eight dimensionality reduction models, and three clinical scores, where the heart rate n-variability based prediction models were built without using cardiac troponin.
Discussion
In this study, we showed that machine learning dimensionality reduction yielded only marginal, non-significant improvements compared to stepwise variable selection in predicting the risk of 30-day MACE among chest pain patients in the ED. This corroborates with similar observations that traditional statistical methods can perform comparably to machine learning algorithms [52, 53]. Among the models integrated with troponin, the MDS model had the best performance (AUC of 0.901, 95% CI 0.874-0.928), which slightly outperformed the stepwise model (AUC of 0.887, 95% CI 0.859-0.916). Among the models that did not include troponin, PCA, KPCA, LSA, GRP, and MDS performed equally well, achieving an AUC of 0.852, compared with the stepwise model without troponin which had an AUC of 0.834. In general, traditional stepwise approach was proved to be equally well as machine learning dimensionality reduction methods in risk prediction, while benefiting from model simplicity, transparency, and interpretability that are desired in real-world clinical practice.
High-dimensional data suffers from the curse of dimensionality, which refers to the exponentially increasing sparsity of data and sample size required to estimate a function to a given accuracy as dimensionality increases [54]. Dimensionality reduction has successfully mitigated the curse of dimensionality in the analysis of high-dimensional data in various domains such as computational biology and bioinformatics [31, 32]. However, clinical predictive modelling typically considers relatively few features, limiting the effects of the curse of dimensionality. This may account for the relatively limited benefit of dimensionality reduction in our analysis.
Additionally, despite marginal improvements in performance compared to stepwise variable selection, transparency and interpretability of machine learning dimensionality reduction-based methods are limited as they rely on complex algorithmic transformations of variables to a lower-dimensional space, leading to obstacles in the adoption of such models in real-world clinical settings. In contrast, traditional biostatistical approaches like logistic regression with stepwise variable selection deliver a simple and transparent model, in which the absolute and relative importance of each variable can be easily interpreted and explained from the odds ratio. Marginal improvements in performance should be weighed against these limitations in interpretability, which is an important consideration in clinical predictive modelling.
Comparing the eight dimensionality reduction algorithms, PCA and LSA use common linear algebra techniques to learn to create principal components in a compressed data space, while MDS, Isomap, and LLE are nonlinear, manifold learning-based dimensionality reduction methods. As observed from our results, complex nonlinear algorithms did not show obvious advantage over simple PCA and LSA methods in enhancing the predictive performance. Yet, nonlinear algorithms are more computationally complex and require more computing memory. For example, KPCA and Isomap have computational complexity of O(n3) and memory complexity of O(n2), while PCA has computational complexity of  and memory complexity of
  [39]. In applications of clinical predictive modelling, n — the number of patients — is usually larger than
  — the number of variables; in our study, n is 795 and
  is 29 or 30, depending on the inclusion of troponin. This suggests that linear algorithms may be preferred due to reduced computational complexity and memory while retaining comparable performance. Another observation in this study was that the impact of preselection (as shown in Figure 1) on predictive performance was more substantial than that of dimensionality reduction, indicating the importance of choosing statistically significant candidate variables.
Our study also reiterates the value of HRnV-based prediction models for chest pain risk stratification. Among chest pain risk stratification tools in the ED, clinical scores like HEART, TIMI, and GRACE are currently the most widely adopted and validated [55, 56]. However, a common barrier to quick risk prediction using these traditional clinical scores is the requirement of cardiac troponin, which can take hours to obtain. To address these difficulties, machine learning-based predictive models that integrate HRV measures and clinical parameters have been proposed [17, 22, 25, 26], including our development of HRnV, a novel alternative measure to HRV that has shown promising results in predicting 30-day MACE [28], which was the stepwise model in this paper. Both the dimensionality reduction-based predictive models and the stepwise model with troponin presented superior performance than HEART, TIMI, and GRACE scores. When troponin was not used, several dimensionality reduction-based models such as PCA, KPCA, and MDS still yielded marginally better performance than the original HEART score, while benefiting from generating the predictive scores in merely five to six minutes.
Additionally, Table 3 shows that all HRnV-based predictive models had higher specificities than the HEART score while all HRnV-based models except Isomap also improved on the already high sensitivity of the HEART score [21, 57]. The specificities of KPCA, Isomap, and MDS were significantly higher by an absolute value of almost 10 percent. Substantial improvements to the specificity of MACE predictive models may reduce unnecessary admission and thus minimise costs and resource usage [5]. This is particularly relevant in low-resource settings, for example, the overburdened EDs in the current coronavirus disease 2019 (COVID-19) pandemic, where novel methods in resource allocation and risk stratification could alleviate the strain on healthcare resources[58].
There remains a need for further investigation into methods that utilise information from the full set of HRV and HRnV variables. From 174 variables in the initial data set, dimensionality reduction performed the best with a preselection of 30 variables, of which 19 were HRV and HRnV parameters. That is, majority of the newly constructed HRnV parameters were removed based on the strict significance threshold of p<0.02 on univariable analysis. Therefore, novel HRnV measures were not fully used in prediction models of 30-day MACE, leaving room for further investigation of alternative ways of using them. Moving forward, it may be valuable to develop and evaluate deep learning frameworks [59] to synthesize novel low-dimensional representations of multidimensional information.
We acknowledge the following limitations of this study. First, the clinical application (i.e. risk stratification of ED chest pain patients) was only one example of clinical predictive modelling, thus our conclusion on the effectiveness of machine learning dimensionality reduction algorithms may not be generalizable to other applications, particularly those with a larger number of variables. Secondly, only eight most used dimensionality reduction algorithms were investigated, while many other methods are available. Last, we did not build a workable predictive model for risk stratification of ED chest pain patients, although the HRnV-based models showed promising results compared with existing clinical scores. We aim to further investigate deep representations of the input variables (both HRnV parameters and clinical information) to achieve more rapid prediction and significantly improve predictive performance.
Conclusions
To our knowledge, this was the first study to compare machine learning dimensionality reduction with conventional stepwise variable selection for risk stratification of chest pain patients in the ED. We found that HRnV-based models using stepwise logistic regression performed better than existing chest pain scores for predicting MACE, with only marginal improvements using machine learning dimensionality reduction. This demonstrated the clinical applicability of the traditional stepwise prediction model due to its simplicity, transparency, and interpretability. To fully utilise the information (i.e. variables) in building high-performing predictive models, we suggest that additional investigations into methods to better represent the large amount of HRnV variables should be conducted. Furthermore, explainable artificial intelligence deserves in-depth exploration such that the derived models are interpretable by clinicians.
Data Availability
The datasets used and/or analyzed during the current study are available from the corresponding author on reasonable request.
Declarations
Ethics approval and consent to participate
The ethical approval was obtained from the Centralized Institutional Review Board (CIRB, Ref: 2014/584/C) of SingHealth, in which patient consent was waived.
Consent for publication
Not applicable.
Availability of data and materials
The datasets used and/or analyzed during the current study are available from the corresponding author on reasonable request.
Competing interests
NL and MEHO hold patents related to using heart rate variability and artificial intelligence for medical monitoring. NL, ZXK, DG, and MEHO are currently advisers to TIIM SG. The other authors report no conflicts.
Funding
This work was supported by the Duke-NUS Signature Research Programme funded by the Ministry of Health, Singapore. The funder of the study had no role in study design, data collection, data analysis, data interpretation, or writing of the report.
Authors’ contributions
NL conceived the study and supervised the project. NL and MLC performed the analyses and drafted the manuscript. NL, MLC, ZXK, SLL, AFWH, DG, and MEHO made substantial contributions to results interpretation and critical revision of the manuscript. All authors read and approved the final manuscript.
Acknowledgements
We would like to thank and acknowledge the contributions of doctors, nurses, and clinical research coordinators from the Department of Emergency Medicine, Singapore General Hospital.
List of abbreviations
- ACS
- acute coronary syndrome
- AMI
- acute myocardial infarction
- AUC
- area under the curve
- ApEn
- approximate entropy
- CI
- confidence intervals
- CABG
- coronary artery bypass graft
- COVID-19
- coronavirus disease 2019
- DFA
- detrended fluctuation analysis
- ECG
- electrocardiogram
- EHR
- electronic health records
- ED
- emergency department
- GRP
- Gaussian random projection
- GRACE
- global registry of acute coronary events
- HRnV
- heart rate n-variability
- HRV
- heart rate variability
- HF
- high frequency
- HEART
- History, ECG, Age, Risk factors, and initial Troponin
- IQR
- interquartile range
- KPCA
- kernel principal component analysis
- LSA
- latent semantic analysis
- LLE
- locally linear embedding
- LF
- low frequency
- MACE
- major adverse cardiac events
- Mean NN
- average of R-R intervals
- MDS
- multidimensional scaling
- NPV
- negative predictive value
- NN50
- the number of times that the absolute difference between 2 successive R-R intervals exceeds 50 ms
- NN50n
- the number of times that the absolute difference between 2 successive RRnI/RRnIm sequences exceeds 50×n ms
- PACS
- patient acuity category scale PCI, percutaneous coronary intervention
- pNN50
- NN50 divided by the total number of R-R intervals
- pNN50n
- NN50n divided by the total number of RRnI/RRnIm sequences PPV, positive predictive value
- PCA
- principal component analysis
- ROC
- receiver operating characteristic
- RMSSD
- square root of the mean squared differences between R-R intervals
- RRI
- R-R interval
- SampEn
- sample entropy
- SD
- standard deviation
- SDNN
- standard deviation of R-R intervals
- SRP
- sparse random projection
- STEMI
- ST-elevation myocardial infarction
- TIMI
- thrombolysis in myocardial infarction
- VLF
- very low frequency
References


