
Abstract
Objective Our objective is to demonstrate a method to estimate the probability of a laboratory confirmed COVID19 infection, hospitalization, and death arising from a contact with an individual of unknown infection status.
Methods We calculate the probability of a confirmed infection, hospitalization, and death resulting from a county-level person-contact using available data on current case incidence, secondary attack rates, infectious periods, asymptomatic infections, and ratios of confirmed infections to hospitalizations and fatalities.
Results Among US counties with populations greater than 500,000 people, during the week ending June 13,2020, the median estimate of the county level probability of a confirmed infection is 1 infection in 40,500 person contacts (Range: 10,100 to 586,000). For a 50 to 64 year-old individual, the median estimate of the county level probability of a hospitalization is 1 in 709,000 person contacts (Range: 177,000 to 10,200,000) and the median estimate of the county level probability of a fatality is 1 in 6,670,000 person contacts (Range 1,680,000 to 97,600.000).
Conclusions and Relevance Estimates of the individual probabilities of COVID19 infection, hospitalization and death vary widely but may not align with public risk perceptions. Systematically collected and publicly reported data on infection incidence by, for example, the setting of exposure, type of residence and occupation would allow more precise estimates of probabilities than possible with currently available public data. Calculation of secondary attack rates by setting and better measures of the prevalence of seropositivity would further improve those estimates.
Introduction
During infectious disease epidemics, human perception of risk modifies disease transmission, and motivates, or not, protective behaviors such as hand hygiene, wearing masks and social distancing at the individual level and quarantine, travel restrictions, and restrictions on gatherings at the societal level. Novel infectious agents such as the COVID-19 virus, with immature understanding of susceptibility, transmission, and lethality, challenge accurate risk estimation.
Predictive models, government surveillance, and epidemiological studies have characterized the risk of COVID-19, in terms of aggregate, and not individual, outcomes, primarily including County-level counts of reported infections, hospitalizations, and deaths. (1) Research has attempted to estimate case fatality rates and identified risk factors for adverse outcomes from COVID-19 disease, such age and chronic disease status. (2, 3) We are not aware of any published research that estimates individual level probabilities of infection, hospitalization, and death from exposure in the general community.
In the United States, publicly accessible data does not yet permit estimating the individual risks of COVID-19 transmission in specific exposure settings, including workplaces, prisons, nursing homes, hospitals and group residential housing settings. However, a starting point for estimation can be the average individual-level probability of acquiring infection across all settings at the level of a county. One can modify those estimates as data on setting specific infection incidence rates, susceptibility and secondary attack rates permit.
Here, we contribute to COVID-19 risk assessment by demonstrating a method to estimate the individual probabilities of acquiring infection, being hospitalized, and dying in U.S. Counties. We identify areas of available and future knowledge that could make risk assessment more precise and context specific.
Materials and Methods
Our objective is to estimate the probability of acquiring COVID-19 infection from a “contact” with a random individual of unknown infection status. We conceptualize this probability under steady state conditions (e.g. no epidemic growth or decline) as a function of individual susceptibility, the current reported case incidence, accounting for undetected infection, the share of infection transmission occurring without a known contact, the chance of transmission per contact (e.g., the secondary attack rate), and the duration of infectiousness, accounting for pre-symptomatic transmission.
We use the formulae below to compute probabilities of infection, confirmed infection, hospitalization, and death.


We describe the parameters used in Table 1 and explain their sources below.
The prevalence of susceptibility to COVID-19 is unknown. Pre-existing immunity due to previous COVID-19-related coronaviral infections is plausible but speculative. Reliable estimates for the proportion of the population who have acquired immunity is unknown but non-zero. We have conservatively estimated the prevalence of susceptibility to be 95%.
We acquired COVID-19 confirmed infection incidence data from publicly reported statistics compiled by The New York Times. (4) Confirmed infection rates underestimate the true incidence of infection in the community because of undetected infections that can be both symptomatic and asymptomatic. Several studies have estimated the asymptomatic fraction. (5-7) In one meta-analytic review, the proportion of asymptomatic infections ranged from 6% to 41%. (8) A weighted mean estimate from those studies suggests that about 1 out of 6 persons, or 16%, may be asymptomatic.
On the other hand, seroprevalence studies aim to capture both the confirmed and unconfirmed fractions together without regard to symptoms. Some seroprevalence studies suggest that up to 90% of infections may be unconfirmed. (9) The US CDC gives 50% as their most conservative estimate of the proportion of asymptomatic infections. (10) We estimate 75% of all infections are unconfirmed which includes both symptomatic and asymptomatic unconfirmed infections.
Limited data is available on the share of reported infections arising without a known contact. As of this date, the US CDC has not included any statistics on this attribute of confirmed infections. The State of Oregon currently publicly reports infections without a known contact a varying between 30 and 50%%. Because of limited national data, we use 100% for this parameter; we leave the parameter in the equation for the purpose of future applications.
The attack rate for an exposure varies by exposure intensity, context, proximity, and duration. For this analysis, contact means any substantive exposures that happen in a community, household, workplaces, or group living situations. Examples of substantive contacts outside households might include dining with a friend or business contact, working in a shared office space or having close or physical contact without the types of precautions now recommended for prevention of infection transmission (e.g. avoiding handshaking, embraces, wearing a mask or indoor ventilation). We do not consider contacts to be short-term events, such as passing by a person on the street. Contact within households involves habitual and typically unprotected close physical. We understand that attack rates will vary across such diverse exposure settings.
Overall, secondary attack rates from contact tracing studies on COVID-19 range from 0.7% to 16.3%. One study in Taiwan estimated a mean attack rate of 0.7% with an attack rate of ∼5% among household and non-household family contacts. (11) A Hong Kong study of the quarantined contacts of visitors from China estimated a secondary attack rate of 11.7%. (12) Two published study within China found a household attack rate of 16.3% and 11.2% respectively. (13-14)
We assume an average plausible attack rate across all settings of exposure based on these range of estimates to be 10% in the absence of more setting and activity specific data. We acknowledge that this estimate may overestimate the attack rate for a non-household contact and underestimate it for a household contact.
We estimate the total duration of infectiousness as 8 days. Research suggests that individuals who develop symptoms may be infectious two to three days before the onset of symptoms. (15) We apply the US CDC’s estimates that the proportion of infectiousness before symptom onset is 40% of the total duration. (10) Conservatively, we treat infections in the unreported fraction as being infectious for the same duration as those with reported infections.
Compliance with self-isolation affects the number of infectious people circulating with infection after symptoms develop. Current research within the context of the COVID-19 pandemic finds that compliance with isolation ranges from 57% without financial compensation to 94% with compensation. (16) Given the current US context and the availability of sick leave compensation, we assume that 75% of individuals with confirmed infection will voluntarily self-isolate after symptoms develop. We do not alter the duration of infectiousness for the unconfirmed fraction of infections.
We estimate the probabilities per contact of reported infections, hospitalizations and deaths as fixed ratios of the estimated but unobserved probability of infection. The relationship between total infections and confirmed infections is fixed and defined by the parameter alpha above.
We estimate the probability of hospitalizations and deaths per contact using US CDC estimates of case hospitalization ratios and case fatality ratios from their pandemic planning scenario four, which is their most conservative current estimate of disease severity and transmissibility. (10) (Table 1) Based on these fixed ratios, we expect 18 reported infections and 70 total infections for every hospitalization in an individual in the 50-64 year old age group. And we expect 167 reported infections, and 667 total infections for every death in the 50-64 year old age group.
These estimated case fatality ratios are within the range of published values in the United States. One study of deaths through the early part of the epidemic estimated the case fatality ratio for symptomatic cases to be 1.3% (95% CI: 0.6% to 2.1%). (2)
We compared estimated weekly hospitalization incidence rates produced using the estimated probabilities per contact against observed incidence rates of laboratory confirmed COVID-19 hospitalization in several US multi-county regions where the US CDC conducts active hospital case surveillance. (17) To estimate weekly hospitalizations, we multiplied our estimates of age specific probabilities of hospitalization per contact and a modest number of daily contacts equal to the number of other household members plus one.
Results
Among US Counties with populations greater than 500,000 people (N= 1224), for the week ending June 13, 2020, the median observed county-level daily case incidence is 6.78 per 100,000 (Range, 0.41-24). In those counties, the median estimate of the county-level probability of a confirmed COVID-19 infection is 1 infection in 40,500 person-contacts (Range: 10,100 - 586,000). These estimates reflect the probability per contact at a single point in time averaged across all types of contacts and settings, within and outside households.
In the same counties, for a 50 to 64 year old individual,, the median estimate of the county-level probability of a hospitalization is 1 in 709,000 person-contacts (Range: 177,000 – 10,200,000) and the median estimate of the county-level probability of a fatality is 1 in 6,670,000 person-contacts (Range 1,680,000 – 97,600.000). Table 2 lists probabilities for other age groups.
Estimated County-level Probabilities for the Week Ending June 13, 2020 of COVID-19 Events in Counties with Populations Greater Than 500,000 (N = 1224)
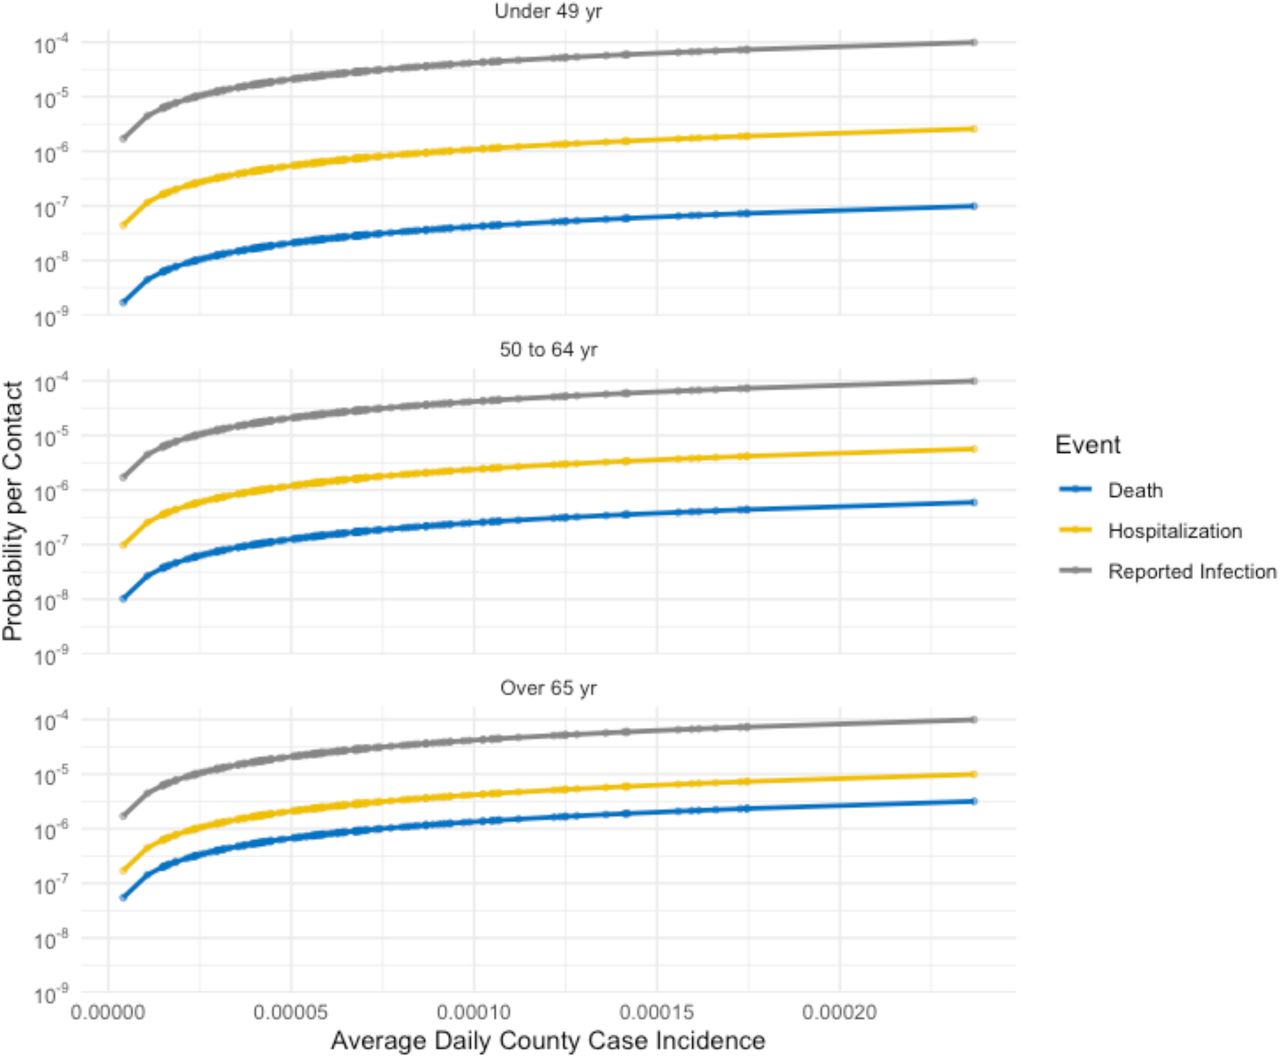
Figure 1 illustrates the average estimated probabilities of confirmed infection, hospitalization and fatality per contact as a function of daily case incidence. Figure 2 Illustrates the estimated number of hospitalizations and fatalities per 1 million contacts in a subset of analyzed US counties with populations greater than 1.5 million.

Estimated county-level probabilities of confirmed infection, hospitalization and death per contact as a function of daily case incidence.

Estimated current number of predicted COVID-19 hospitalizations per 1 million contacts in counties with populations greater than 1.5 million.
We found good concordance between the estimated weekly hospitalization rates and rates from US CDC hospitalization surveillance data in most of our comparison regions under the assumption that average daily contacts equaled the average number of other household members plus one. (Table 3) CDC acknowledges that more recent data values are subject to revision.
Estimated weekly hospitalization rates per 100,000 people for the week ending June 13, 2020 compared to weekly laboratory confirmed hospitalization rates observed by US CDC regional surveillance.
Discussion
We demonstrate a method to estimate the average county-level probabilities of COVID-19 confirmed infections, hospitalizations, and deaths in the U.S resulting from a contact with a random person in the population. Those estimates reflect current reported COVID-19 confirmed infection incidence in US counties with more than 500,000 people for the week ending June 6, 2020. Probabilities vary across a wide range reflecting the varying case incidences in different counties.
Our method is limited by the availability of publicly available data on infection transmission on COVID-19, including setting and occupational specific case incidence rates, data on antibody seroprevalence, the share of infection with known contacts, and activity-specific attack rates. The estimates therefore reflect the average probability across a wide range of exposure contexts. Nevertheless, observed rates of hospitalization for laboratory confirmed COVID-19 disease in several US CDC active surveillance areas generally corroborate our estimates under the assumption of a modest level of social contact.
Our estimates of the average probabilities per contact do not accurately estimate risks for specific subsets of people. Infections occur within geographically and socially constrained chains of transmission, for example, within clusters of related or socially connected individuals or among those living in congregate living facilities such as nursing homes. Clusters of COVID-19 infections have been reported associated with prisons, workers dormitories, religious services, nightclubs, schools, cruise ships, sporting events, and professional conferences. (18) Disaggregating confirmed infection incidence rates into fractions representing those with and without known contacts and those within and without congregate living settings would allow for more setting and population specific risk estimates. This requires the systematic public reporting of confirmed infection exposure factors.
As mentioned above, systematic data on the share of confirmed infections arising without a known contact is not currently available. Appling this fraction to the model would reduce our estimates based on the assumption of a 100% share.
Available estimates of the secondary attack rate come from observations outside the US and at an earlier time period in the pandemic, prior to normalization of behaviors that reduce the risk of infection transmission, such as increased hand washing, observing physical distance, forgoing physical greetings, and wearing masks.
The limitations of published secondary attack rates and the lack of disaggregated data on confirmed infection incidence also do not allow our estimates to differentiate between community and household transmission. Most studies indicate that household attack rates are higher than for contacts in the community. Systematic public reporting of anonymized contact tracing data would provide information to assess context specific attack rates.
We also cannot account for intra-individual variation in the secondary attack rate within a setting. With respiratory viruses, the number of secondary cases generated by each index case can vary significantly. (19-20) One recent estimate suggests that 80% of COVID-19 infections are due to a small fraction (10%) of particularly infectious individuals. (21)
We have assumed a high fraction of the population remains susceptible as the prevalence and significance of antibodies to COVID-19 is not known. However, there may well be factors conferring protection to infection or responsible for differences in susceptibility. For example, cross immunity due to infection with other coronaviruses may be occurring. (22) Researchers have also observed cellular immune system responses to COVID-19 among unexposed individuals likely due to prior exposure to related coronaviruses. (23) More data will be required before adjusting risk assessment for population susceptibility or immunity.
We estimated probabilities of hospitalization and death based on CDC estimates of disease severity. We chose conservative scenarios but acknowledge that estimates of confirmed infection fatality ratios may further evolve over the course of the pandemic. Furthermore, individual states may have different criteria for recording a death from COVID-19. The risk of hospitalization and death varies with other risk factors including race/ethnicity, level of deprivation, and chronic diseases such as lung disease and diabetes, that are not reflected in our analysis.
Better data to address the above limitations would likely reduce estimated probabilities of adverse events for a large fraction of the population; still, the estimated probabilities reported here may appear considerably lower than those reflected in public opinion surveys. Scientific uncertainties, media attention, dramatic governmental action and a subjective perceived lack of control over exposure all may be influencing risk perception. Exploring methods to communicate risk and the concordance of perceived risk and risk probabilities would be an appropriate subject for further work.
Avoiding human contact in the setting of an uncertain and lethal epidemic threat is an expected and self-protective human behavior. Prevalent beliefs today about the sources of COVID-19 infection include ‘contact with infected persons’, ‘people coming from abroad’ or ‘foreign nationals.’ (24) Notably, many people assume that contact with a family member has a lower risk of infection transmission than contact with a stranger. This may not be true for all subgroups in the population.
In the US, policy makers have taken dramatic and unprecedented steps to control COVID-19, applying universal contact reductions through home confinement, limits on travel, closures of schools and businesses and limits on gatherings. While heightened perception of risk (e.g., fear) motivated these restrictions at the outset of the epidemic, ongoing restrictions on community activity may be mediating risk perceptions. (25)
Notably, in Wuhan, the government limited exponential growth of the COVID-19 epidemic using isolation and quarantine, mandatory mask wearing, canceled New Year’s celebrations, the curtailment of intra-city and intercity transportation and extension of the New Year’s holiday period. (26) South Korea achieved epidemic control with scaled up testing, strong contact notification practices, case isolation and strict quarantine of those exposed and public awareness. (27) The lack of understanding of how various countries have brought their epidemics under control maybe another important factor influencing the perception of risk to COVID-19 infection in community settings in the US.
Return to community workplace and social life will require individuals to be comfortable with their personal risk of acquiring COVID-19 infection. Estimates on the individual probabilities of infection, hospitalization and death may contribute to a more accurate risk perception. Systematically collected and publicly reported data on infection incidence by, for example, the geographic setting of exposure, residence type, whether a case had a known exposure, and would allow more precise estimation than those possible with currently available public data. Calculation of secondary attack rates by setting and prevalence of seropositivity would further improve these estimates.
Data Availability
All data used in the manuscript is publicly available and sources are referenced.
Contributions
Rajiv Bhatia and Jeffrey Klausner equally contributed to the design of the study and writing of the manuscript. Rajiv Bhatia conducted the analysis.
Conflicts of interest
None
Funding
None
References


