
ABSTRACT
Chimeric antigen receptor (CAR)-T cell therapy has achieved considerable success in treating B- cell hematologic malignancies. However, the challenges of extending CAR-T therapy to other tumor types, particularly solid tumors, remain appreciable. There are substantial variabilities in CAR-T cellular kinetics across CAR-designs, CAR-T products, dosing regimens, patient responses, disease types, tumor burdens, and lymphodepletion conditions. As a “living drug”, CAR-T cellular kinetics typically exhibit four distinct phases: distribution, expansion, contraction, and persistence. The cellular kinetics of CAR-T may correlate with patient responses, but which factors determine CAR-T cellular kinetics remain poorly defined. Herein, we developed a cellular kinetic model to retrospectively characterize CAR-T kinetics in 218 patients from 7 trials and systematically compared CAR-T kinetics across patient populations and tumor types. Based on our analysis results, CAR-T cells exhibited a significantly higher cell proliferation rate constant and capacity but a lower contraction rate constant in patients who responded to treatment. CAR-T cells proliferate at a higher rate constant in hematologic malignancies than in solid tumors. Within the assessed dose ranges (107-109 cells), CAR-T doses were weakly correlated with CAR-T cellular kinetics and patient response status, suggesting steep dose-response curves. In conclusion, the developed CAR-T cellular kinetic model adequately characterized the multiphasic CAR-T cellular kinetics and supported systematic evaluations of the potentially influencing factors, which can have significant implications for the development of more effective CAR-T therapies.
INTRODUCTION
The success of immunotherapy, including chimeric antigen receptor (CAR)-T cell therapy, has fundamentally altered the landscape of cancer treatment and shows the potential to make previously incurable cancers now curable1,2. Chimeric antigen receptor (CAR), a genetically engineered receptor in T cells, consists of T-cell-activating domains (CD3ζ and costimulatory signals, such as CD28 or 4-1BB) and extracellular single-chain variable fragment (scFv) that binds to tumor-associated antigen2,3,4. The CAR equips the patient’s own T cells to recognize and subsequently eradicate cancer cells. While the mechanism of actions is not fully understood, evidence showed that CAR-T cells, once bound to the specific antigen on tumor cells, could release cytokines and other cell lysis mediators (granzyme B and perforin) that may directly kill antigen-expressing tumor cells. CD19-targeted CAR-T therapy has produced a high rate of durable remission in refractory B-cell malignancies, such as B cell acute lymphocytic leukemia (ALL) and chronic lymphocytic leukemia (CLL)3,5. The promising efficacy and the approval of two autologous CD19 CAR-T therapies (Yescarta and Kymriah) by the US FDA have motivated hundreds of follow-up CAR-T trials including different CAR constructs, tumor antigen, and tumor types2,6. Among these CAR-T trials, there are about 73.8% (284/385) trials evaluating efficacy in hematologic malignancies and 26.2% (101/385) in solid tumors (clinicaltrials.gov, accessed Jan 2020).
With the increasing number of CAR-T trials, remarkable inter-trial and inter-individual variabilities in CAR-T cellular kinetics and therapeutic responses have been unfolded. For instance, CD19 CAR-T cell induced a significantly higher response rate in patients with ALL (> 80%) compared with CLL2,3. By contrast, CAR-T therapy has shown limited success in solid tumors, although several positive trials have been reported7. The dose-response relationships of CAR-T therapy, although critical for the CAR-T clinical study design, remain largely undefined8-10. Patients who received higher doses of CAR-T cells did not consistently see greater CAR-T cellular expansion and persistence, nor greater efficacy and long-lasting effect. Many other factors may confound the dose-response relationships, such as CAR-T constructs, lymphodepletion conditions, and baseline tumor burden. Some of these factors have been assessed in specific CAR-T trials, but it remains to be defined whether these factors could be generalized to other CAR-T therapies. To address these challenges, a model-based meta-analysis of CAR-T cellular kinetics and responses is warranted.
As a “living drug”, CAR-T cells rapidly proliferate upon antigen recognition, which distinguishes itself from traditional therapeutic modalities11. There are multiple phases in CAR-T cellular kinetics: distribution, expansion, contraction, and persistence, each of which reflects an aspect of its functionality, as well as its interactions with host conditions, such as tumor baselines and host immune functions. A rapid and high expansion of CAR-T cells after dosing is usually believed to be a positive sign for response, and the lymphodepleting therapy consisting of cyclophosphamide and/or fludarabine is routinely performed and sometimes relevant to CAR-T rapid cellular expansion12,15. The ensuing contraction phase after expansion is related to mechanisms of activation-induced cell death (AICD) and the loss of antigen stimulation16. Durable responses are usually accompanied by long-term CAR-T cell persistence10. Along with the rapid clonal expansion, higher CAR-T cell exposures often elicit higher adverse events, such as cytokine release syndrome (CRS) characterized by fever and multiple organ dysfunction3,17.
The traditional pharmacokinetic models are not applicable to characterize CAR-T cellular kinetics as it does not follow the typical disposition and elimination pathways as the conventional therapeutic molecules. An empirical cellular kinetics model has been developed by Stein et al11, which was further taken to evaluate the extrinsic and intrinsic factors that may impact the tisagenlecleucel expansion. Herein, we developed an empirical CAR-T cellular kinetics model based on a previously established immune dynamic model18, in attempt to characterize the multi-phasic kinetics of CAR-T cells and systematically analyze the factors influencing CAR-T therapy in humans.
METHODS
Clinical data
Literature search covered CAR-T clinical trials with different targets and indications, including both hematologic and solid tumors. In total, seven clinical trials were included (Table 1) based on the inclusion criteria: (1) Second generation CAR-T construct with one co-stimulatory domain; (2) CAR abundance vs time profiles were available; and (3) CAR transgene was quantitated by qPCR (copies/μg DNA). Pharmacokinetic data of CAR-T cells were digitized by WebPlot Digitizer (https://automeris.io/WebPlotDigitizer).
Overview of included CAR-T clinical trials
ALL, acute lymphocytic leukemia; BCMA, B-cell maturation antigen; CLL, chronic lymphocytic leukemia; CRS, cytokine release syndrome; DLBCL, diffuse large-B cell lymphoma; EGFR, epidermal growth factor receptor; EGFRvIII, epidermal growth factor receptor variant III; GBM, glioblastoma; MM, multiple myeloma; NSCLC, non-small-cell lung cancer; scFv, single-chain
Model structure
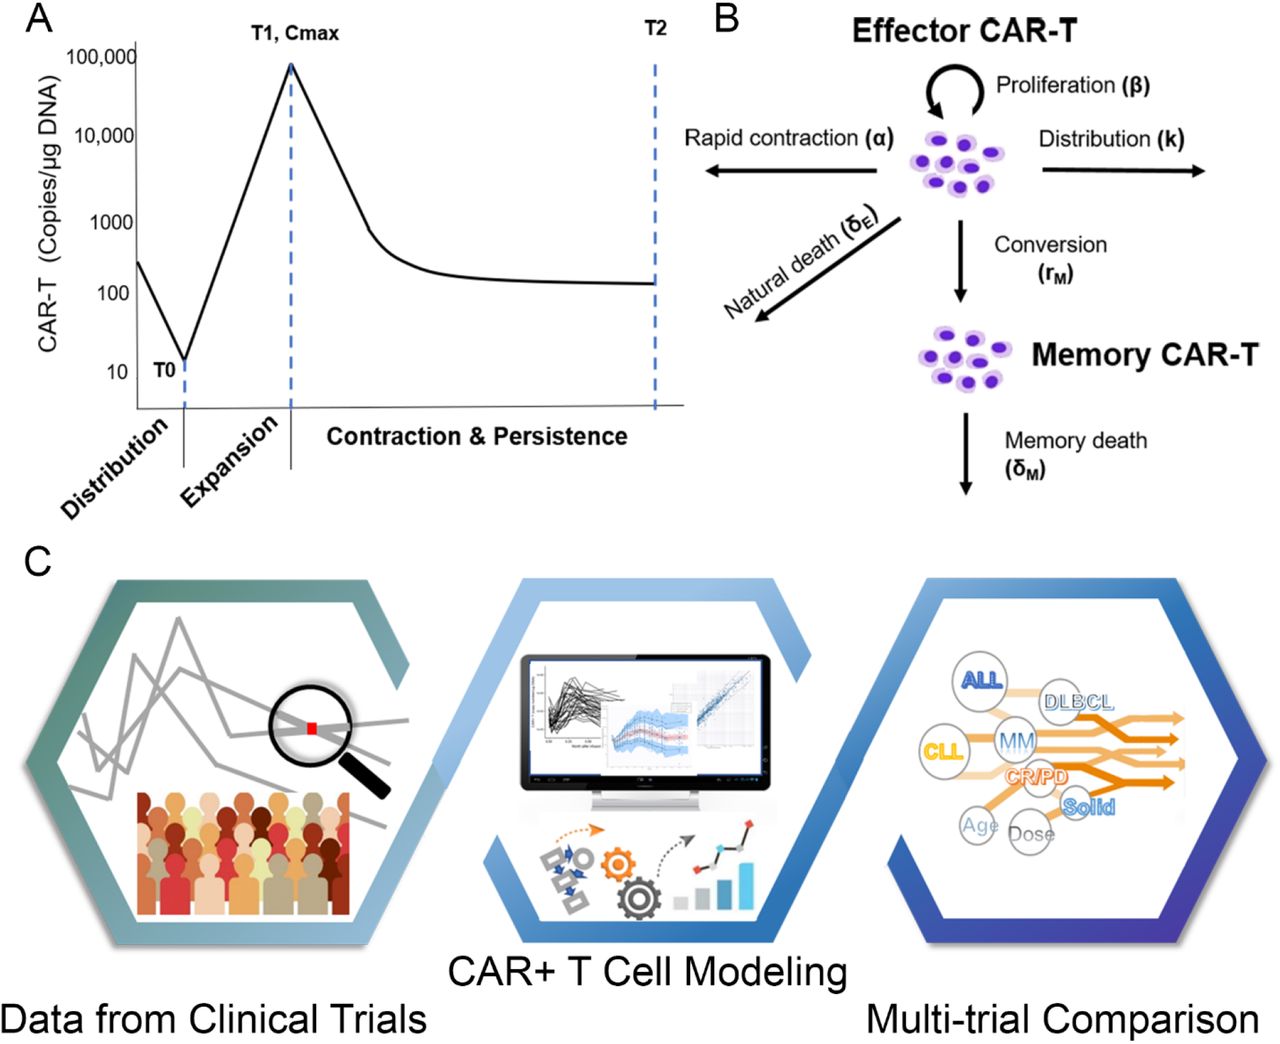
The model was built on the following assumptions: (1) Multiple phases of kinetics occur in a chronological order; (2) Memory differentiation is not reversible during the time of clinical trials. More specifically, circulating CAR-T cells first experience a transient decline due to tissue distribution after infusion (Fig. 1A).

(A) A typical three-phase kinetics of CAR-T cell: rapid distribution phase, expansion phase, contraction and persistence phase; (B) Model structure for CAR-T kinetics; (C) Schematic diagram of three-step workflow for modeling and analysis.
 where k is rapid distribution rate constant, T0 is distribution duration, and E is effector CAR-T concentration. The rapid distribution generally occurs immediately after administration, only lasts for a couple of days, and was not captured in most clinical trials. For all trials analyzed, the rapid distribution phase was clearly depicted in the trial of DLBCL. In the model, for the trials without a clear rapid distribution phase, equation (1) was not included (T0 = 0).
After distribution, CAR-T cellular kinetics is governed by an exponential growth, up to the peak at time T1. It is assumed that there are negligible cell death and memory differentiation during the expansion phase (i.e. before T1).
 where β is proliferation rate constant, T1 is proliferation duration. To improve model estimation on the time constants, T0 and T1 were pre-determined based on each CAR-T profile.
In the phase of contraction and persistence, effector CAR-T cells are eliminated in three ways (Fig. 1B). AICD is a featured mechanism of the lymphocyte homeostasis after immune activation19-21, which mainly contributes to the initial rapid contraction (Fig. 1A). Meanwhile, a small fraction of effector CAR-T cells convert to memory cells or undergo a natural turnover.

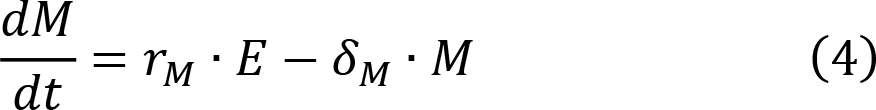 where α is rapid contraction rate constant, δE is natural death rate constant of effector CAR-T, rM is differentiation rate constant to the memory cell, M is memory CAR-T concentration and δM represents memory cell death rate constant. A biphasic contraction was observed in almost all individual CAR-T profiles, a rapid contraction followed by a shallower phase (Fig. 1A). We did not assume that the rapid contraction stopped at the inflection point of the curves; therefore, α was allowed during the entire contraction. T2 is the last sampling time-point of each trial (Fig. 1A), which is associated with CAR-T persistence duration. Accordingly, the time interval between T1 and T2 (T2-T1) indicate the duration of contraction.
Data fitting and simulation
Initial effector CAR-T concentration E (0) was set to be equal to the value of the first sampling or the limit of quantification, while initial memory CAR-T concentration M (0) was assumed to be zero. Rapid distribution constant (k) was only applicable for the trial of DLBCL, and δE was fixed to 0.435 mon-1 according to a previous report22. Thus, there were in total five parameters (β, α, rM, and δM) requiring estimated from the data. Random effects were also modeled on those parameters assuming log-normally distributed variance. A proportional residual error model was used with a log-normal distribution of the residuals. Model output was total CAR-T concentration (E + M). The maximum CAR-T concentration (Cmax) at time T1 is also derived as a function of T1 and β as:


Population pharmacokinetic analyses were conducted using the stochastic approximation expectation maximization (SAEM) algorithm for nonlinear mixed-effect modeling, as implemented in Monolix version 2018R2 (Lixoft, France).
Parameter estimation was conducted separately by trial and all estimates were summarized in Table S1. Model simulations were performed to illustrate the dynamics of total, effector, and memory CAR-T for each CAR-T therapy and tumor type. The population values of parameters with and without inter-individual variability were applied to simulate concentration-time profiles of total, effector, and memory CAR-T. Simulated CAR-T cellular kinetics between responders and non-responders were also compared. Monolix and R (3.5.3) were both used in simulation and graphing.
Multi-trial comparison
Because of large variabilities in CAR-T trial design, data analysis was performed independently across trials to compare the CAR-T cellular kinetics among different types of tumors, as well as to explore other potential factors (covariates) that contribute to inter-individual and inter-study variabilities. Estimates of six model parameters (Cmax, β, T1, α, rM, and δM), which jointly determine the cellular profiles, were compared among trials and between groups with different responses. Patients were also pooled into three categories of cancer types (ALL/CLL/MM, lymphoma, and solid tumors) to evaluate the variability by tumor type. Moreover, the correlations of model parameters with CAR-T cell dose, age, initial tumor burden, CD4:CD8 ratio in CAR-T products, as well as the lymphodepletion effect were explored. Statistical analysis and data visualization were performed using R (3.5.3).
Patient response status to CAR-T treatment was extremely variable across CAR-T cell therapies, tumor types, and clinical evaluation criteria. Namely, there were complete response (CR), very good partial response (VGPR), partial response (PR), minimal response (MR), stable disease (SD), no response (NR), progressive disease (PD), and unknown (UNK). In our analysis, the reported response status for each patient within each trial was directly adopted, and the response status was grouped as either CR/PR or PD/NR for multi-trial comparisons. More specifically, VGPR was grouped into CR/PR, while MR and UNK were defined as PD/NR. SD was categorized as PD/NR in the trials of MM and DLBCL, and as CR/PR in the case of NSCLC. Survival information was provided in the trial of GBM. Although individual responses were not directly reported, three patients with the longest duration of follow-up while in this study were defined as CR/PR, and others were considered as PD/NR. For the trial of ALL (pediatric), there was no individual information on patient response status.
RESULTS
Clinical trial datasets and CAR-T cellular kinetics model
An increasing number of CAR-T trials are ongoing, the published data with complete profiles of CAR-T cellular kinetics and quantitation of CAR abundance were digitized. In total, seven clinical trials with 218 patients were included in our final analysis, CAR-T therapies targeting hematological malignancies, lymphomas, and solid tumors10,11,14,15,23,25. The selected CAR-T therapies targeting different tumor antigens contained the same intracellular co-stimulatory domain 4-1BB belonging to the second generation of CAR-T construct (Table 1).
The multiphasic features in CAR-T cellular kinetics are similar, regardless of tumor types, dosing regimens, and sampling intensities. As shown in Figure. 1A, the typical CAR-T cell kinetic profile is comprised of four distinct phases: rapid distribution phase, expansion phase, contraction phase and persistence phase, which illustrate physiological dynamics of CAR-T in the body upon dosing: tissue distribution, proliferation, contraction and memory differentiation, respectively11. The rapid distribution phase was clearly characterized in the patients with DLBCL and a few patients with CLL due to intensive sampling in earlier time points, whereas the expansion, contraction and persistence phases were clearly observed in all trials.
These features are well characterized by our CAR-T cellular kinetic model (Fig. 1B). The model structure originates from an immune-dynamic model reported by De Boer et al. with modifications for CAR-T cells11, 18. To perform comparisons across trials with different study designs, we fitted all individual data from each trial and subsequently examined model-based parameter estimates with a series of post-hoc analyses on model parameters, patient responses, and many other potentially influencing factors. The whole workflow schema was summarized in Fig 1C.
Model fitting and model parameters
Overall, the developed cellular kinetic model well-characterized the 218 individual CAR-T profiles. In the case of DLBCL, the model well-captured each of the phases, as shown in the fitting plots of representative patients (Fig 2A). The goodness-of-fit plot demonstrated good agreement between observed and model-predicted CAR-T concentrations (Fig 2B). Additionally, visual predictive check (VPC) for the model showed good overall agreement between observed and simulated data in terms of percentiles of the individual distribution. The percentiles of observed data were close to the predicted percentiles and remained within the corresponding prediction intervals (Fig 2C). Individual fitting and model diagnostics plot for other trials were included in Figure S1-S6.

Model fitting and validation plots in the trial of DLBCL. (A) Individual fitting plots of representative patients; (B) The goodness-of-fit plot; (C) Visual predictive check (VPC) plot
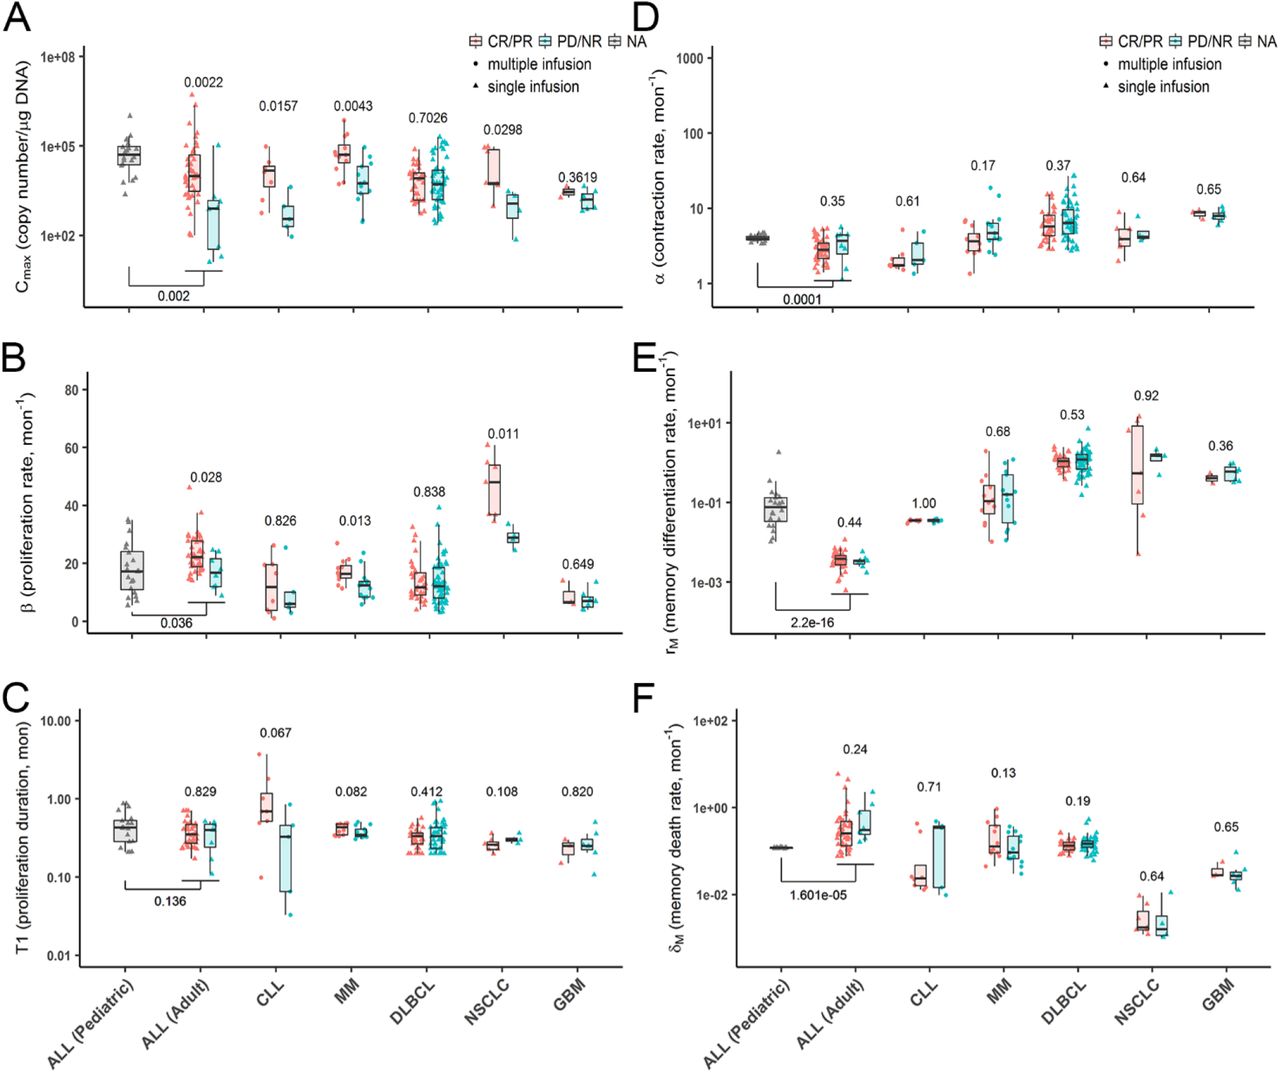
Population parameter estimates, inter-individual variability (IIV), and estimation precision were listed in Table S1. Taking the MM patient data for example, the population estimate of β is 13.9 mon-1 with an IIV of 0.389, and α is 3.78 mon-1 with an IIV of 0.791, while rM and δM have relatively higher IIV (1.64 and 1.35, respectively), largely owing to the lack of a distinct persistence phase in many individuals. Overall, model parameters were reasonably estimated with acceptable estimates for precision and inter-individual variability. Of note, the data in the phase of contraction were sparse in many patients, suggesting a relative high error of posterior individual parameters in these trials which was also reflected in certain VPC plots. Parameter estimates for all individual patients were shown in Figure 3.

Individual model-estimated parameters for responders (CR/PR) and non-responders (PD/NR). Data from responders and non-responders are shown separately and compared for each trial. Two ALL trials were also compared, although response information was not available in the trial of ALL (Pediatric). Data distribution were described by boxplot (minimum, first quartile, median, third quartile, and maximum). p < 0.05 (Wilcoxon test) is considered as significant difference.
Responders vs Non-responders
Individual model parameters were compared by response status across trials to explore if responders (CR/PR) and non-responders (PD/NR) displayed different CAR-T cellular kinetics (Fig 3, S7 and S8). For the rapid distribution phase in DLBCL patients, responders had a significantly higher rate (k) of distribution with a shorter duration (T0) than those in non-responders (Fig S7A-B). During CAR-T expansion phase (Fig 3A-B), responders in most trials showed a significantly higher proliferation capacity (Cmax) that was accounted by a higher proliferation rate constant (β). Responders with CLL or MM appeared to have a longer proliferation duration (T1), although not reaching statistical significance, which still resulted in a significantly higher Cmax (Fig 3C). In addition to the higher proliferation, CAR-T cells in responders tended to have a relatively slower contraction rate constant (α), but no statistical significance was detected (Fig 3D). There was no statistically significant difference between responders and non-responders in terms of the memory cell differentiation and death rate constants (rM and δM) (Fig 3E-F). A relatively longer duration of contraction and differentiation (T2-T1) was observed in responders for most trials that resulted in a more durable CAR-T cell persistence (T2) than in non-responders (Fig S8A-B).
Hematologic malignancies vs Solid tumors
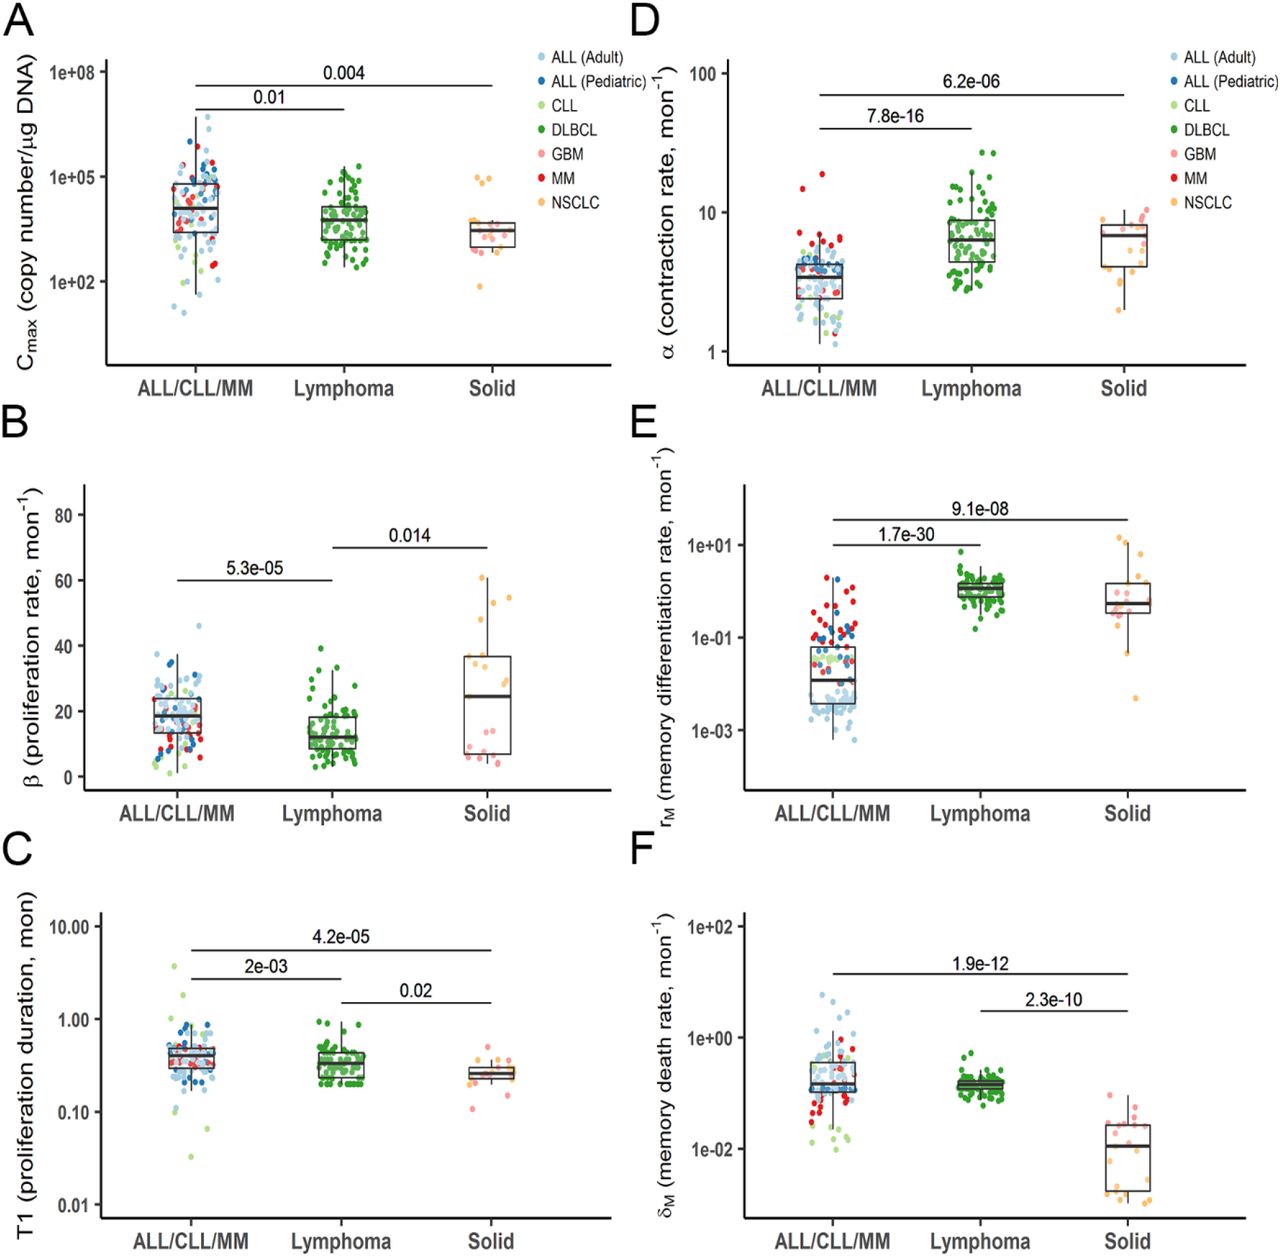
In hematologic malignancies (ALL/CLL/MM), CAR-T cells seemed to proliferate for a longer duration (T1) and reach a significantly higher proliferation capacity (Cmax) than in lymphoma and solid tumors (Fig 4A and C). Hematologic malignancies were associated with a higher CAR-T proliferation rate constant (β) than lymphoma but not solid tumors due to large variability in CAR-T proliferation rate in NSCLC and GBM (Fig 4B). By contrast, solid tumors were associated with a higher CAR-T contraction rate constant (α) and a memory differentiation rate constant (rM). CAR-T cells tend to have a lower memory-cell death rate constant (δM) in solid tumors than in hematologic malignancies, but this observation should be interpreted with caution as some CAR-T trials had limited samples in the terminal phases (Fig 4D-F).

Individual model-estimated parameters of three tumor types (ALL/CLL/MM, lymphoma and solid tumors). Data from corresponding trials were pooled into three main categories. Data distribution were described by boxplot (minimum, first quartile, median, third quartile, and maximum). p < 0.05 (Kruskal–Wallis test) is considered a significant difference.
Effect of CAR-T doses, baseline tumor burdens, and CD4:CD8 ratios
The influence of CAR-T cell doses on the model parameters were assessed in four trials (CLL, MM, GBM and NSCLC) that had individual dosing records available. Due to high variabilities, CAR-T doses in the range of 107 - 109 cells/patient were weakly correlated with patient responses, regardless of tumor types (Fig 5A). Furthermore, neither any parameter showed significant dose correlation within each trial (Fig S9).

Patient covariates for responders (CR/PR) and non-responders (PD/NR). (A) A comparison for individual dosing by the response in the trials of CLL, GBM, MM, and NSCLC; (B) A comparison for pre-treatment tumor burden by the response in the trials of CLL and MM. Tumor burden values were not comparable across trials, as they were measured differently, indicated as “BCMA MFI” and “total IgH reads”, respectively; (C) CD4:CD8 ratio was compared by the response in the trials of MM and NSCLC; (D) Patient age was compared by the response in the trials of MM, GBM and NSCLC.
Pre-treatment tumor burdens were individually measured in the CAR-T trial of MM and CLL. Similar as TCR-mediated T cell activation, the size of tumors is generally considered as a crucial factor for efficient CAR-T cell activation and expansion. This was evidenced in several CAR-T trials that patients with large tumor burdens frequently suffered from high cytokine release syndromes, suggesting rapid and substantial CAR-T expansions in these patients26-28. However, based on the data utilized within our analysis, in MM and CLL patients, pre-treatment tumor burdens were not statistically correlated with the potential of CAR-T proliferation (Fig S10). For CLL, patients with a higher tumor burden showed an uptrend toward a higher Cmax, but no significance was reached (Fig S10B). There was no apparent difference in pre-treatment tumor burdens between responders and non-responders either (Fig 5B). The reasons for this inconsistency were not fully clear, which was probably associated with the uses of circulating tumor antigens as biomarkers for tumor burden quantification in the analyzed studies.
The CD4:CD8 ratios in the infused CAR-T cell products were also quantified in both MM and NSCLC trials. Responders appeared to have CD4:CD8 ratios that were closer to 1 while non-responders (Fig 5C) showed relatively higher and diverse ratios, although no statistical difference was detected. Similarly, the CAR-T proliferation capacity (Cmax) and rate constant (β) tended to negatively correlate with CD4:CD8 ratios, but significance was not reached in either trial of MM or NSCLC (Fig S11A-B).
Other factors (patient age and lymphodepletion)
The effect of other factors, such as patient age and lymphodepletion treatment, were evaluated similarly. To some extent, patient age is associated with immune functions29. Compared with adult patients with ALL, pediatric patients with ALL displayed a significantly higher CAR-T proliferation capacity, a higher contraction rate constant, a higher memory differentiation rate constant, a lower memory death rate constant, a prolonged contraction duration and in vivo persistence (Fig 3 and S8). By contrast, for adult patients between 40 and 80 years, age did not seem to correlate with any kinetic parameters in any CAR-T trial (Fig S12). Interestingly, patients in the CR/PR group appeared to be younger than patients in the PD/NR group (Fig 5D) even though no statistical significance was reached.
Lymphodepletion has become a standard procedure prior to CAR-T cell infusion to minimize immune-mediated CAR-T cell rejection30. In the trial of MM, lymphodepletion effect was evaluated by comparing two cohorts of patients with the same CAR-T doses with or without lymphodepletion. The data showed that lymphodepletion resulted in a higher CAR-T proliferation rate constant (β) and a higher capacity (Cmax) in MM patients (Fig S13). However, similar results were not observed in the NSCLC trial, which was probably because lymphodepletion was only applied to NSCLC patients with larger tumor size. With regards to the lymphodepletion regimen, applying fludarabine tended to improve CAR-T proliferation (Fig S14).
Parameter correlations
Statistical correlations among model parameters were explored (Fig S15). As expected, higher CAR-T proliferation capacity (Cmax) were associated with faster proliferation rates (β) and/or longer proliferation durations (T1), considering that Cmax is a function of β and T1 (Fig S15A-B). Proliferation durations (T1) were negatively correlated with proliferation rate constant (β) (Fig S15C), resulting in a comparable proliferation potential across individual, and suggesting a host-restricted proliferation capacity in humans. CAR-T contraction rate constant (α) tended to decrease with an increasing proliferation rate constant (β) (Fig S15D). A similar negative correlation was not obvious between α and Cmax, suggesting that CAR-T contraction was not directly associated with peak concentrations but with proliferation rate (Fig S15E). In addition, the memory differentiation rate constant (rM) negatively correlated with the memory cell death rate constant (δM), contraction rate constant (α), as well as Cmax in most trials (Fig S15F-H).
Model simulation
The inter-individual and inter-study variability were further explored and visualized by simulating 1000 virtual patients for each trial (Fig S16). The simulation was performed using the population-typical values of the parameters for each trial along with the estimated inter-individual variabilities (IIV). The distribution profiles of actual populations were located within 10th – 90th percentile intervals.
To distinguish the kinetics of effector CAR-T and memory CAR-T, the profiles of total CAR-T as well as those two subpopulations were simulated for each trial (Fig 6). Although the terminal phase was not fully monitored in some trials, the simulations still help to characterize the rapid contraction of effector CAR-T and the persistence of memory CAR-T within or beyond the study durations of clinical trials. Compared with adult ALL patients, pediatric ALL patients seemed to have an earlier and higher memory differentiation (Fig 6). A relatively higher CAR-T proliferation potential was observed in ALL patients than in CLL patients (Fig 6), which is consistent with the observation that CD19 CAR-T therapy exhibited a higher response rate in ALL than in CLL. Because of the short durations of sampling, the interpretation of extrapolated profiles of CAR-T persistence in DLBCL and GBM patients must be performed with caution. Furthermore, CAR-T kinetics of responders and non-responders were simulated and compared (Fig S17A). Responders in the trial of ALL and MM displayed a higher peak of effector CAR-T, a higher formation of memory CAR-T, and a slower contraction rate of effector CAR-T. As considerable heterogeneity of effector and memory CAR-T kinetics was observed across trials (Fig 6), the inter-individual heterogeneity of those populations was simulated as well (Fig S17B).

The simulated kinetics of effector CAR-T (green), memory CAR-T (red), and total CAR-T (blue) for each clinical trial. Simulations were performed based on the population typical values of parameters. CAR-T cell kinetics were simulated until 10 months. Dotted lines represent the duration beyond the period of the clinical trials.
DISCUSSION
CAR-T therapy has achieved exceptional success in lymphoid B cell malignancies, but numerous challenges exist in extending this therapy to other tumor types, particularly solid tumors31. There exist substantial variabilities in CAR-T cellular kinetics and patient responses. Some experiences have been gained during clinical practice. For example, compared to the first-generation, second-generation CAR consisting of an intracellular costimulatory domain (either CD28 or 4-1BB) exhibited much higher CAR-T cell expansion and persistence, which appeared to be the drive for the improved response probability and efficacy3,32. Lymphodepletion prior to CAR-T infusion has been routinely applied to eliminate the native lymphocyte competition and facilitate CAR-T cell rapid expansion, which often results in enhanced patient response13-15. However, the key determinants governing CAR-T cellular kinetics and patient responses remain to be characterized, particularly considering which showed high variabilities and were confounded by a broad range of factors. Moreover, the quantitative impact of these factors on CAR-T cellular kinetics as well as the clinical outcomes has not been systematically analyzed yet, which is sometimes inconsistent across CAR-T types, dosing regimens, and pre-treatment tumor burdens.
It is difficult to perform a direct comparison of clinical outcomes across multiple trials with distinct CAR-T cell products, dosing regimens, tumor types, and heterogeneous patient populations. In this report, we developed a cellular kinetic model to characterize the pharmacokinetic behaviors of CAR-T cells and thereafter quantitatively and systematically evaluated CAR-T cellular kinetics and clinical outcomes across patient populations (Fig 1B-C). Our work offered a means to systematically characterize CAR-T kinetics–response relationships as well as the potential influencing factors across multiple CAR-T trials.
Different from other therapeutic modalities, CAR-T cells that is capable of proliferation and differentiation in the system typically exhibit multiphasic kinetics. Moreover, CAR-T proliferation potential and systemic exposure are not strictly dose-dependent. Conventional compartmental pharmacokinetic models are therefore not strictly applicable to characterize CAR-T cellular kinetics. The developed model can recapitulate the multiple functional phases of CAR-T cells before, during, and after encountering tumor antigens. The model predicts the phases of rapid distribution, expansion, and biphasic contraction, which consists of rapid contraction and memory cell differentiation and a patient-specific duration of each phase (Fig 1A). Although cell proliferation may take place during long-term persistence or memory cells may be generated during the proliferation phase, our model set T1 to a distinctly separate proliferation phase and contraction phase to keep the model mechanistic, yet simple, which enabled the model to capture the diverse CAR-T profiles (Fig 2 and S1-S6).
Patient response status was closely associated with CAR-T cellular kinetics (Fig 3, S7 and S8). Responders were associated with an average of higher CAR-T expansion capacity and higher proliferation rate constant than non-responders (Fig 3A, B). A relatively lower contraction rate constant for a longer contraction duration was observed in responders (Fig 3D-F and S8B). Despite a similar proliferation duration (Fig 3C), a prolonged period of CAR-T cell persistence was observed in responders, which is associated with a long-term benefit (Fig S8A). Although the rapid distribution phase was attainable only in DLBCL CAR-T trial, the responders exhibited significantly faster distribution than non-responders (Fig S7). The mechanism for this observation remains unknown. To confirm and fully capture the rapid distribution phase in future CAR-T trials, more intensive time-samplings soon after infusion is preferable. Of note, there were high inter-study variabilities in model parameters (Fig 3 and Table S1), particularly for rM and δM, which were estimated with high biases in CAR-T trials owing to the sparse sampling during the terminal phase.
Hematological cancers exhibited a higher CAR-T proliferation capacity (Cmax) and a lower contraction rate constant (α) compared with that in solid tumors (Fig 3, 4A and D). This may be largely attributable to the fluidic form of hematological cancers that enable the fast and high antigen accessibility upon CAR-T injection. In solid tumors, cancer cells are often spatially restricted33, providing poor antigen accessibility to CAR-T cells. CAR-T cells have to extravasate into the tumor bed, migrate toward the tumor cells, contact, and then engage the tumor cells7,34. Differences in tissue accessibility and delivery rate for CAR-T cells may account for large variability on proliferation rate constant (β) between two solid tumor trials (Fig 4B). Cell proliferation duration (T1) was the most conservative parameter across CAR-T trials and patient populations (Fig 3C), while blood cancers experienced longer proliferation than lymphoma and solid tumors (Fig 4C).
Substantial inter-individual variabilities in CAR cellular kinetics were observed (Fig 3 and S16). The sources of variability and the influencing factors were analyzed. The CD4:CD8 ratios and lymphodepletion conditions showed a certain degree of influence on CAR-T expansion and differentiation, while pre-treatment tumor burden did not (Fig S10, S11, S13 and S14). When comparing multiple trial results in the dose range of 107 ~ 109, neither CAR-T cell expansion nor contraction was associated with CAR-T doses (Fig S9). Nevertheless, in the trial of MM15, cohorts 2 and 3 were treated with cyclophosphamide before the injection of a low (1-5 × 10⁷) or high dose (1-5 x 10⁸) of CAR-T cells. The high-dose cohort exhibited a significantly higher proliferation rate constant (β) and higher capacity (Cmax) compared to the low-dose cohort (data not shown). Studies also observed limited CAR-T expansion at low dose (< 5 × 10⁷)35, 36 and no CAR-T expansion at very low doses (< 106)37, indicating a potential threshold of dose to assure rapid CAR-T expansion and a steep dose-response curve for CAR-T therapy2,34,38. Similarly, although patient age was not correlated with any parameter in adult patients (40 - 80 years old), pediatric patients showed significantly higher CAR-T expansion and persistence than adult patients (Fig 3 and S12), which is probably due to the immature pediatric immune system that creates more friendly environment to the proliferation of CAR-T cells. Along with the rapid expansion of CAR-T candidates, more mechanistic cellular kinetics and dynamics models are warranted to disentangle the complicated relationships between target engagement, tumor burdens, as well as the dynamic native immune systems34.
In conclusion, the developed cellular kinetic model adequately characterized the CAR-T profiles in humans. The potential sources of variabilities in CAR-T cellular kinetics were systematically analyzed across patient populations and tumor types. Our analysis provided a starting point to further understand CAR-T cellular kinetics and kinetic-response relationships, which have implications for future CAR-T development and clinical optimization.
Data Availability
All the data analyzed in this manuscript was from the published literature, which were all cited in the manuscript.
Conflicts of interest
Authors declare no conflict of interest
Financial support
National Institute of Health (GM119661) and Janssen R&D
Author Contributions
Cao Y, Singh AP, Heald D, Wang W, and Liu C designed the research. Liu C collected the data. Liu C and Cao Y performed the data analysis. All authors discussed the results and wrote the manuscript.
Reference


