
Abstract
Background Novel coronavirus (SARS-CoV-2) is extending its range of transmission in all parts of the world, with substantial variation in rates of transmission and severity of associated disease.
Methods We evaluated whether and under which conditions it is possible to control and slow down a COVID-19 epidemic in the early stages by isolation and contact tracing. We used a stochastic transmission model in which every person generates novel infections according to a probability distribution that is affected by the incubation period distribution (time from infection to symptoms), distribution of the latent period (time from infection to a person becoming infectious), and overall transmissibility. The model distinguishes between close contacts (e.g., within a household) and other contacts in the population.
Findings The analyses showed that transmissibility and the duration of the latent period relative to the duration of incubation period have strong impact on the controllability of the disease. Delays in diagnosis of cases and proportion of asymptomatic cases are key factors for containment and slowing down the epidemic.
Interpretation Isolation and contact tracing can be an effective means to control early epidemics, but only if transmissibility as measured by R0 is in the lower ranges of reported values. Timeliness as well as completeness of tracing and diagnosis of cases are paramount to achieve containment and effective slowing down of the epidemic growth rate.
Funding This research was funded by the Dutch Ministry of Health, Welfare and Sport and by ZonMw project number 91216062.
Research in context
Evidence before this study
Information on the epidemiological characteristics of SARS-CoV-2 and COVID-19 disease are accumulating at an astounding pace. Evidence to date suggests that a substantial portion of transmission may occur before the onset of symptoms and before cases can be isolated. This has potentially important implications for the prospect of containment by isolation and contact tracing, which had previously been successful in the control of SARS.
Added value of this study
Using a stochastic transmission model armed with current best estimates of epidemiological parameters, we evaluated under which conditions containment would be possible for various delays in diagnosis, isolation, and contact tracing. In addition, if containment is not possible, as seems likely in many settings, we estimated the impact of isolation and contact tracing on the epidemic growth rate and the doubling time for the number of infections. Our results indicated that substantial reductions in the epidemic growth rate (from more than 0.1 per day to well under 0.1 per day) and epidemic doubling time (from approximately 6 days to perhaps more than 14 days) are feasible if the diagnosis delay is short (<3 days) and a high proportion of non-household contacts are traced and isolated (>70%).
Implications of all the available evidence
Even with containment out of reach, our analyses based on best understanding of the epidemiology of COVID-19, highlight that isolation and contact tracing can be valuable by delaying and lowering the epidemic peak, thus reducing stress on healthcare systems.
Introduction
As of early March 2020, the number of infections of the novel coronavirus (SARS-CoV-2) is still increasing at an almost exponential rate, while the virus is rapidly expanding its range in all parts of the world. There are no registered effective medicines, treatment options are mainly supportive, and there are no vaccines available, limiting preventive measures mainly to isolation of infected persons and those that have high likelihood of being infected, for instance because they have been traced as contacts of infected persons. 1
To what extent local containment or local slowing down of an early epidemic is successful depends on the effectiveness of case isolation and contact tracing. It is known that a high probability of asymptomatic infection, a high proportion of transmission occurring before the onset of symptoms, a long delay between case finding and isolation, and high overall transmissibility all factor in negatively in the likelihood that an outbreak can be contained.2-5 For SARS-CoV-2, evidence indicates that a high fraction of infected persons is infectious before they show symptoms (up to 50%), that a substantial fraction of infections may be asymptomatic or show only mild symptoms, and that the epidemic doubling time in the absence of interventions is approximately one week.6-14
Here we provide model-based analyses of the impact of isolation and contact tracing, using varying levels of the effectiveness of contact tracing and varying delays in diagnosis, isolation, and contact tracing. We focus on conditions that make containment of an early epidemic possible, but also on the impact of isolation and contact tracing when containment is not possible. In the latter case we report the (exponential) rate of increase and the doubling time of the epidemic for scenarios without and with interventions. Considering that the capacity of healthcare systems is limited, it is important to assess which interventions are most effective in slowing down the rate of increase of healthcare demand during an ongoing outbreak. As it is likely that isolation and contact tracing will be more effective in close contact settings with well-defined contacts (household, workplace) than in the community (commuting, public spaces), while the potential impact of household interventions on the epidemic could be smaller, we stratify the analyses by transmission settings (henceforth called household and non-household).4 As many of the relevant epidemiological and intervention parameters are still quite uncertain, or may be variable in different settings, we focus throughout on a systematic analysis of the relation between key parameters for timeliness and completeness of contact tracing and main outcomes such as effective reproduction number and epidemic growth rate.
Methods
We modify a model that was developed earlier for similar aims in another context.4 The stochastic model describes an epidemic in its early phase as a branching process. Starting from a small set of initially infected individuals, the model calculates the numbers of latently infected persons, infectious persons, and persons that are diagnosed and isolated in time steps of one day. Latent infection, infectivity during the infectious period, and daily contact rates are quantified using distributions taken from published literature (Table 1). We distinguish between household contacts and non-household contacts, which differ in the risk of infection and the delay and effectiveness of tracing and isolation. Intervention effectiveness is determined by the daily probability of being diagnosed during the infectious period, which can differ between cases occurring before the first diagnosis has taken place, and later cases (Table 2). Furthermore, intervention effectiveness depends on the delays in tracing household and non-household contacts, respectively, and which proportions of contacts can be found and isolated. We assume that isolation is perfect, i.e. that isolated persons cannot transmit any longer. The model is described by a set of difference equations, and allows for explicit computation of the basic reproduction number R0 and the effective reproduction number under interventions Re. The model was coded in Mathematica 11.2.
Disease and transmission related parameters.
Parameters related to diagnosis and contact tracing.
Natural history
We assume that the latent period lasts between 4 and 6 days. Individuals then become infectious for at most 10 days. Infectivity is high at the beginning of the infectious period and decays to low levels during these 10 days (Figure 1a). The probability of symptoms onset increases during the first 4 days of the infectious period, thereby influencing the daily probability of diagnosis during the infectious period (see below).

Baseline assumptions concerning transmission and diagnosis: (a) Transmission probability per contact per day of the infectious period. (b) Probability distribution for the number of contacts per day, including both household and non-household contacts. (c) Distribution of percent onward transmission per day of the infectious period. (d) Probability of being diagnosed by day of infectious period for the when all infections are symptomatic there is no delay in diagnosis.
An infectious individual makes contact with household members and persons outside the household. We model the daily number of household contacts with a Poisson distribution, and the numbers of non-household contacts with a negative binomial distribution (Table 1), with parameters based on the average household size in the Netherlands, and numbers of contacts observed in a contact study in the Netherlands (Figure1b).15 With the chosen parameters, the mean number of contacts per day is 13.2 (SD 8.5).
On each day of the infectious period, an individual makes a number of contacts according to the contact distribution. This number is reduced by a factor describing the probability that the contact person has already been infected during earlier contacts with the index person. More precisely, the number of contacts is reduced by a factor fk per day k of the infectious period, describing the probability that a contact has already been infected on previous days of the infectious period of the index case, such that the probability of transmitting to a contact on day k is given by  , where pi denotes the probability of transmission on day i of the infectious period. The probability of transmission upon contact with a susceptible household contact is given by the distribution in Figure 1a. As contacts with persons outside the household are assumed to be less close, we assumed that the transmission probability for these contacts is lower by factor 0.25. Figure 1c shows the percentage of onward transmissions per day of the infectious period, e.g. more than half of all onward transmissions occur during the first 3 days of the infectious period.
Diagnosis, contact tracing, and isolation
An infectious person becomes symptomatic with a given probability per day of the infectious period. We assume that the probability of developing symptoms is high in the first few days of the infectious period. If an infected person has not developed symptoms by day 6, the probability that he/she will still do so is very small. The probability of developing symptoms determines whether he/she will be diagnosed and isolated. The total probability of developing symptoms determines the fraction that remains asymptomatic or otherwise undiagnosed, i.e. if the total probability of developing symptoms is smaller than 1, a proportion of infected will remain undiagnosed and can transmit throughout their infectious period. With the assumed distributions, on average about half of all potential onward transmissions will have occurred before an infected person is diagnosed and isolated. The diagnosis can be delayed, which in the model is implemented by setting the diagnosis probability to zero for the number of days of delay. This delay describes the time between symptom onset until a symptomatic person visits a GP or hospital and gets diagnosed.
If an individual is diagnosed, his/her contacts will be traced, and in case they are infected will be diagnosed and isolated. Tracing goes back in time to trace all contacts during the infectious period of the index case. There may be a delay before contacts are found and diagnosed, and only a fraction of all contacts may be found. These parameters, tracing delay and tracing coverage, may be different for household and non-household contacts. We assume that all traced infected persons are immediately isolated and cannot transmit any further. So the only individuals who will continue transmitting are those who are not found by tracing and are not yet diagnosed.
Baseline scenario
We use a best case scenario, where all parameters are set to very optimistic values. We assume that all cases develop symptoms at some point during their infectious period, and will then immediately be diagnosed and isolated. Isolation will stop onward transmission completely. With respect to contact tracing, we assume that all contacts will be traced and if found infected will be isolated immediately. We assume that it takes 1 day to find and isolate both household and non-household contacts. The rationale for using these overly optimistic assumptions as a baseline is that we want to investigate for various control parameters at which point of diverging from the baseline parameters control of the outbreak will be lost. To contrast the analysis of the baseline scenario, we also considered an alternative scenario, where we used more pessimistic parameter settings. For the alternative, we assumed that 80% of cases will be diagnosed and isolated, but that there is a delay in diagnosis of 5 days. It takes 4 days to trace and isolate non-household contacts, and only 50% of those will be found and isolated if infected.
Output variables
The model allows an explicit calculation of the basic reproduction number R0 and the effective reproduction number Re.4 R0 is defined as the number of secondary cases an index case generates on average in a susceptible population, and Re is the number of secondary infections per case when an intervention is in place. R0 is determined by daily transmission probabilities and numbers of contacts. The effective reproduction number is in addition determined by diagnosis probabilities, tracing delays, and tracing coverages per day of the infectious period. We can therefore investigate how Re depends on R0 and on those intervention parameters.
We are interested in the critical tracing coverage, i.e. what proportion of non-household contacts needs to be found and isolated to control the outbreak, and in the epidemic growth rate (or epidemic doubling time) without and with contact tracing and isolation. We study how these quantities depend on the delay to diagnosis of cases and on the delay in contact tracing. We assume that household contacts can be traced with a high coverage and without delay, but that tracing of non-household contact may take longer and be less complete.
Based on the distribution of the latent and infectious periods and infectivity, we calculate the exponential growth rate and doubling time under various assumptions on the intervention parameters. This gives additional information for situations where the outbreak is not controllable, because intervention measures will lower the growth rate and increase the epidemic doubling time.
We are interested in how controllability of the outbreak depends on the fraction of infections that develop symptoms. In our baseline scenario we assume that all infected persons develop symptoms, and we then vary this percentage between 0% and 100%. Although simulations of outbreaks can be run with the model, we focus here on general results with regard to the dependence on R0, Re, and the exponential growth rate. Finally, we consider an alternative scenario, where we assume that contact tracing is not perfect.
Role of the funding source
The funders of the study had no role in study design, data collection, data analysis, data interpretation, writing of the manuscript, or the decision to submit for publication. All authors had full access to all the data in the study and were responsible for the decision to submit the manuscript for publication.
Results
Basic and effective reproduction numbers
In the baseline scenario without intervention we calibrate the transmission probability such that R0 = 2.5. In that case, 39% of transmissions take place among household contacts. The basic reproduction number of household contacts is 0.97, that of non-household contacts 1.53. So, if all non-household transmissions could be prevented, the outbreak would be just under the control limit. In the baseline scenario without interventions the exponential growth rate is 0.127 per day and the doubling time is 5.5 days, which seem reasonable. 11
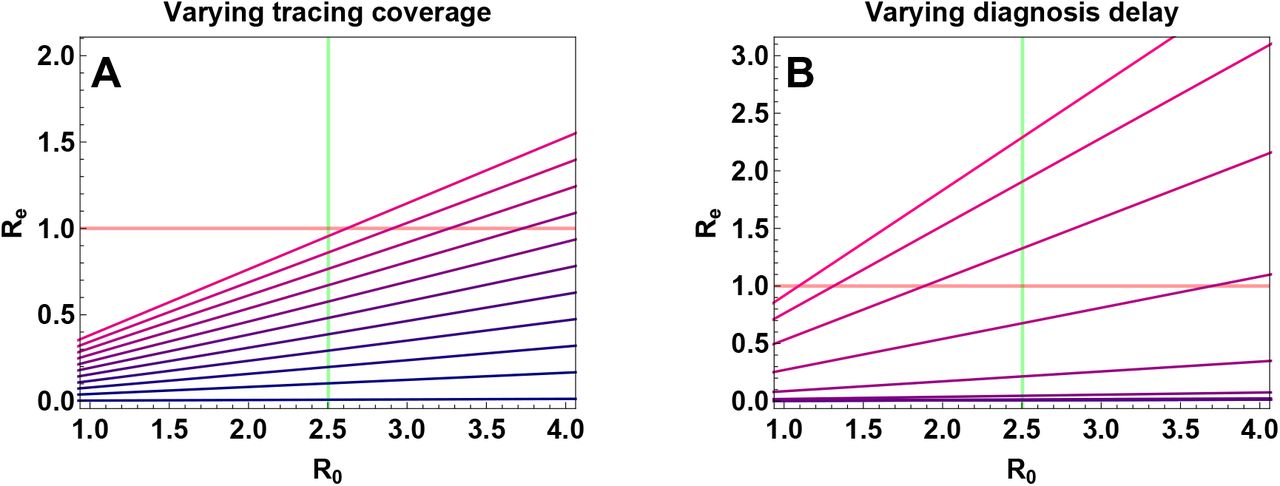
In Figure 2 we show how basic and effective reproduction number are related. We explore how varying the fraction of non-household contacts that are traced, and the time to diagnosis of index cases influence the effective reproduction number. In the first case, we observe that failure to find all infected contacts does not lead to a loss of control for R0=2.5 or lower (Figure 2a). This is only due to the optimistic values of all other parameters, in particular that cases will be diagnosed and isolated without delay as soon as they become symptomatic. If there is delay in diagnosis, loss of control will occur for delays above 1 week, even if all non-household contacts can be found and isolated (Figure 2b). Contacts have then already entered the infectious period and have had time to spread the infection. So we conclude that timeliness of diagnosis is of utmost importance for controlling an outbreak.

The effective reproduction number Re for varying the basic reproduction number R0 in the optimistic baseline scenario. (a) Colors indicate a range from 100% of infected non-household contacts isolated (Blue) to no non-household contacts isolated (Pink) in steps of 10%; (b) Colors indicate a range of no delay in diagnosis (Blue) to 10 days delay in diagnosis (Pink) in steps of 1 day; all other parameters are at baseline values.
Fraction of non-household contacts needed to trace and isolate
If there is a diagnosis delay, the question arises how successful contact tracing has to be to keep the outbreak under control. We therefore computed the minimum fraction of non-household contacts that need to be traced and isolated (henceforth termed “critical tracing coverage”) to bring Re to below 1. The results are shown in Figures 3a and 3b. For a diagnosis delay up to 4 days, there is a chance of controlling the outbreak if the coverage of tracing non-household contacts is above the critical fraction (Figure 3a). In Figure 3b, we varied the time it takes to trace non-household contacts between 1 and 7 days, assuming no diagnosis delay. In this case, the time needed to trace contacts does not have a large impact on the critical tracing coverage. This is because diagnosis is quick enough, such that despite a delay in tracing infected contacts, they are found before they become infectious, or if they are not found by contact tracing, they get rapidly diagnosed themselves.

The critical fraction of non-household contacts that need to be found and isolated to control the outbreak for a range of the basic reproduction number R0. The vertical green line depicts the baseline value of R0=2.5. Blue shows the critical tracing coverage in the optimistic baseline scenario, pink the worst case scenario. In panels A, C, and E, the delay in diagnosis was varied between 1 and 10 days in steps of 1 day; in the panels B, D, and F, the time needed to trace non-household contacts was varied between 1 and 7 days in steps of 1 day. The rows differ in the fraction of asymptomatic infections: 100% symptomatic (A and B), 80% symptomatic (C and D), and 60% symptomatic (E and F).
Impact of asymptomatic cases
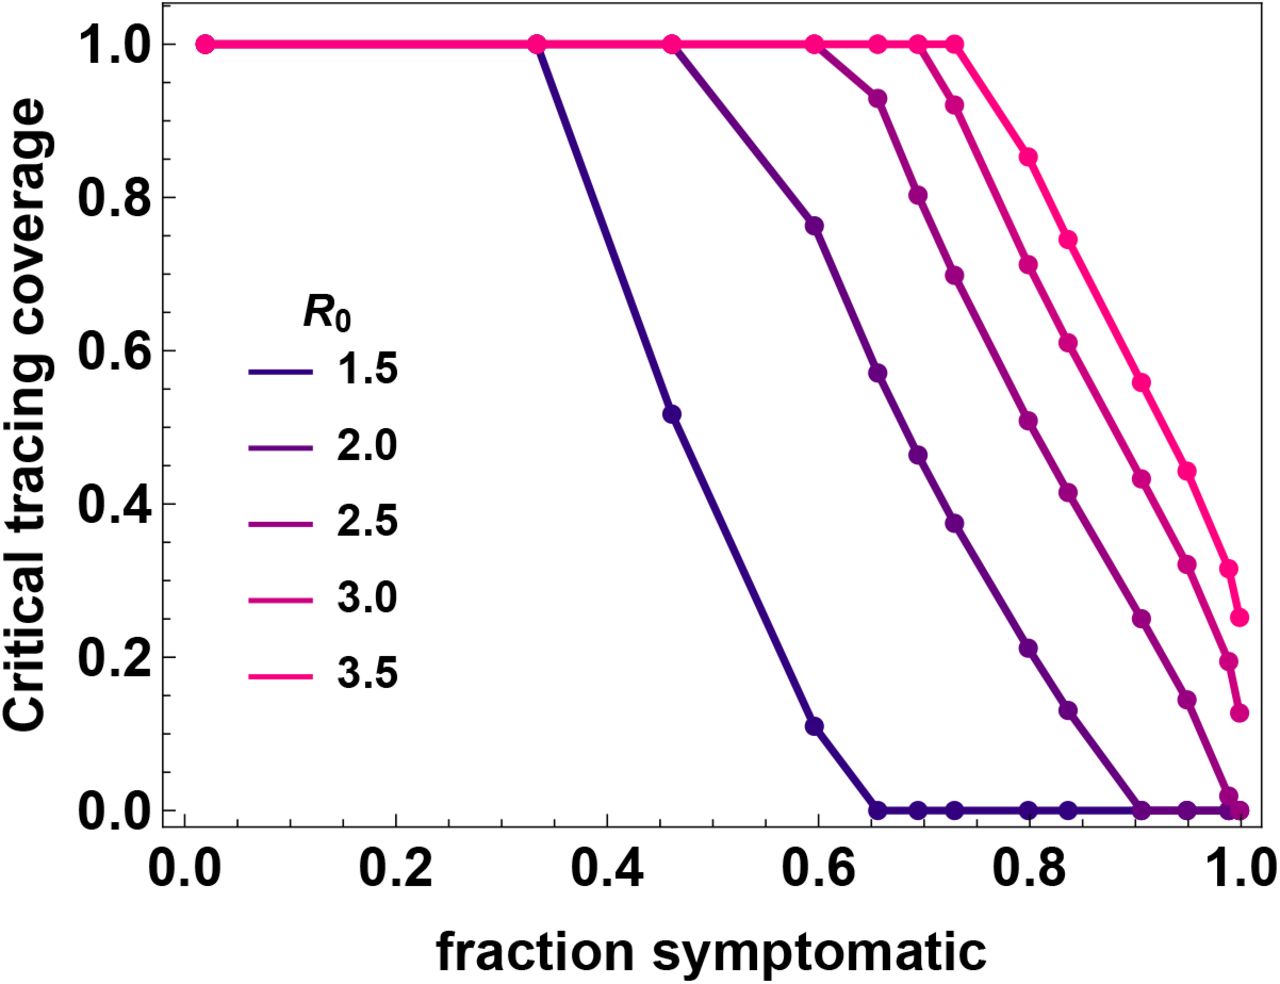
If we look at these same plots for situations where not all infected cases are diagnosed, the possibility of controlling the outbreak quickly fades. Not being diagnosed can be a consequence of not developing symptoms, having only mild symptoms, or any other reason why infected persons might not be identified by health care. We subsume these possible reasons for cases not being ascertained under the term “asymptomatic”. In Figure 3b critical tracing coverages are shown for a situation of 80% symptomatic cases, and in Figure 3c for 60% symptomatic cases. In the latter case, control of the outbreak is not possible, even if all other parameters are set at the most optimistic values. This is also shown in Figure 4, where we plotted the critical tracing coverage for several values of R0 as a function of the fraction of symptomatic cases (i.e. the fraction of those who will eventually develop symptoms during their entire infectious period). The figure shows that for R0 = 2.5 control is not possible with isolation and contact tracing, if less than 60% of all infected persons develop symptoms or are otherwise not detected by the health care system, even if all other parameters are at the most optimistic values. Other interventions measures are then needed for containment of the outbreak.

The critical tracing coverage needed for control of the outbreak for varying percentages of asymptomatic infections and values of R0 between 1.5 and 3.5. If more than 40% of cases escape diagnosis because they are asymptomatic or have only mild infections, for R0 = 2.5 the outbreak is not controllable even with our optimistic baseline values for the intervention parameters.
Exponential growth rate and doubling time
In situations, where control of the outbreak is not possible with isolation and contact tracing only, it might still be possible to slow down the epidemic by those measures and thereby gain time for the health care system to deal with the outbreak. We find that contact tracing has an impact on the epidemic growth rate for diagnosis delays less than 3 days (Figure 5a) and high coverages of tracing non-household contacts (Figure 5c). Figures 5b and 5d show doubling times of the epidemic for situations where the fraction of symptomatic cases is 60% or lower. For very successful contact tracing interventions (i.e. small diagnosis delays and high tracing coverages) the doubling time can be increased to 30 days if 60% are symptomatic. Below that value there is little impact on the doubling time.

The exponential growth rate for (A) varying delay in diagnosis and (C) varying tracing coverage. The colors depict varying levels of symptomatic infections: Blue: 100% symptomatic cases; Pink: 2% symptomatic cases. When the exponential growth rate is smaller than zero (red horizontal line), the outbreak is controlled. In (B) and (D), the doubling time of the epidemic is shown for situations where the exponential growth rate is positive. In (B) delay in diagnosis is varied and in (D) tracing coverage is varied. The uppermost curve corresponds to a situation with 60% symptomatic cases, the lowest one to 2% symptomatic cases. For the situation with 60% asymptomatic cases, contact tracing and isolation can slow down the epidemic substantially, but not control it, even if there is no diagnosis delay and all non-household contacts are traced.
Realistic scenario
In the above we considered the impact of diverging from an optimistic baseline scenario one parameter at a time. In reality, many parameters will be imperfect and their impact on the success of contact tracing will add up. As an illustration, we considered a more pessimistic scenario, where it takes 7 days to find and isolate infected non-household contacts, the coverage of tracing is 50%, the delay in diagnosis is 5 days, and only 80% of cases develop symptoms. For this scenario, the effective reproduction number is 1.4, the exponential growth rate is 0.05, and the doubling time is 14.4 days. So while containment is not possible in this scenario, the doubling time can be increased by a factor of 2.6, which implies a substantial slowing down of epidemic spread.
Discussion
Our analyses showed that rapid diagnosis and isolation of infections based on COVID-19 disease alone cannot control outbreaks of SARS-CoV-2, but that the addition of tracing and isolation of traced cases could in theory be successful (Figure 2). In practice, however, the potential for containment will be seriously jeopardized by various delays and imperfections in the tracing process. Especially delays in diagnosis and isolation, and the existence of asymptomatic and mild infections that contribute to onward transmission could easily make an outbreak uncontrollable (Figure 3). For instance, if in our default scenario the delay between onset of infectiousness and isolation is more than 4 to 6 days, the outbreak cannot be controlled even with perfect tracing. Likewise, if the fraction of asymptomatic cases is more than 40%, containment is not possible with contact tracing.
Even though it is unlikely that early SARS-CoV-2 epidemics can be contained by a mix of contact tracing and rapid isolation alone, this does not render contact tracing useless. In fact, healthcare systems throughout the world generally are ill-prepared for sudden spikes in healthcare demand, especially in intensive care units, where laws of economics dictate that costly surplus capacity is kept to a minimum.16 Our analyses showed that isolation and contact tracing can contribute to reducing the growth rate and doubling time of epidemics, thereby buying time, spreading the number of severe cases out over a longer period of time, and potentially also reducing the total number of infections (the “final size”).17 This will lower peak healthcare demand, alleviate the stress on healthcare systems, and contribute to reducing the burden of disease.
Our analyses add to an earlier study by a more systematic analysis of the relation between key parameters (transmissibility, fraction asymptomatic, fraction of contacts traced, diagnosis delays), and by incorporating household versus non-household contacts.18 Household contacts are at a higher risk of becoming infected than non-household contacts as persons in a household will usually have repeated contacts. On the other hand, our analyses show that household infections contribute less to onward transmission than non-household infections simply because the numbers of household contacts are much lower than numbers of other contacts. As a consequence, the effectiveness in isolating non-household contacts is key for a successful contact tracing strategy.
A strength of the model is that quantitative information about distributions of the latent and infectious periods, and the infectivity per day of the infectious period can be incorporated easily, such that if new and better data on those quantities emerge, the analysis can be updated quickly. In particular, the model can incorporate non-standard distributions based on empirical data (e.g. viral load measurements to quantify infectiousness per day), should they become available.
A limitation of the analyses presented here is that they apply to a situation in which the epidemic is described by a branching process and is growing exponentially. This also applies to another modelling using a (one-type) branching process.18 Ultimately, as the number of persons who are or have been infected increases, the number of persons that are still susceptible will start to dwindle, and epidemic growth will ultimately come to a halt. Hence, strictly speaking our results apply to the early stages of an epidemic. In fact, even when the number of infected persons is still relatively small in the early stage of an epidemic it is possible that exponential growth is not observed, for instance due to local depletion of susceptible persons in combination with clustering in contact patterns, spatial effects, and inhomogeneous mixing.19 Therefore, our model results should be viewed as a worst-case scenario in which the epidemic (without interventions) is growing unchecked.
Another limitation that deserves scrutiny is that we have assumed that epidemiological parameters remain constant throughout the epidemic. This is unlikely to be the case, and it is to be expected that there will be behavioral changes and consideration of interventions such as school closure and limiting of mass gatherings. Such measures have proven effective earlier during the 2009 influenza pandemic20-22, and are increasingly being considered for COVID-19 as well.23 If implemented, transmissibility of the virus at the population level will be reduced, and this could help to increase the effectiveness of isolation and contact tracing.
In conclusion, our results show that isolation and contact tracing are not expected to be able to fully control outbreaks of COVID-19, but are still important ingredients of effective containment strategies, as they are expected to reduce growth rates and increase epidemic doubling times. This is especially true when combined with transmission-reducing behavioral changes and interventions such as school closures and reducing community events.
Data Availability
We only used data from published literature.
Contributors
MEK, MvB, and GR conceived the study. MK designed and programmed the model, and produced output. All authors interpreted the results, contributed to writing the manuscript, and approved the final version for submission.
Declaration of interests
We declare no competing interests.
Data sharing
No data were used in this study. The code can be requested from MK.
Acknowledgments
To be included later
References


