
Abstract
Malignant pleural mesothelioma (MPM) is an aggressive malignancy that lacks effective therapy. To identify therapeutic targets we integrated SNP genotyping, sequencing and transcriptomics from tumours and low-passage patient-derived cells. Previously unrecognised losses of SUFU, observed in 21% of 118 tumours, resulted in disordered expression of Hedgehog pathway transcripts and genes from the T-cell synapse, including VISTA. Co-deletion of Interferon type I genes and CDKN2A was present in half of tumours and was a predictor of poor survival. We found previously unrecognised deletions in RB1 in 26% of cases and show sub-micromolar responses to downstream PLK1, CHEK1 and Aurora Kinase inhibitors in primary MPM cells. Defects in Hippo pathways that included RASSF7 amplification and NF2 or LATS1/2 mutations were present in 50% of tumours and were accompanied by micromolar responses to the YAP1 inhibitor Verteporfin. The results indicate multiple new therapeutic avenues in MPM and include targets and biomarkers for immunotherapy.
Statement of Significance We have discovered previously unreported copy number aberrations in MPM that led us to find micromolar responses of patient-derived primary cell lines to PLK1, CHEK1, Aurora Kinase and YAP1 inhibitors. Deletions of the hedgehog modulator SUFU had marked effects on the expression of T-cell synapse genes, providing a rational basis to VISTA inhibition for MPM immunotherapy.
- Mesothelioma
- RB1
- SUFU
- immunity
- therapy
Introduction
Malignant pleural mesothelioma (MPM) is an aggressive malignancy associated with asbestos exposure. Global mesothelioma deaths are estimated to be 38,400 each year(1). MPM shows limited responses to all treatments. Although 20% of tumours may transiently regress after checkpoint immunotherapy(2,3), PD-L1 is expressed at a low level in most MPM(3) and predictors of response are unknown. The molecular landscape is not complex but known recurrent lesions have not yet defined effective therapeutic targets(4,5).
Intense fibrosis invariably accompanies MPM, causing intractable pain and dyspnoea. In the UK MesobanK tumour repository, for example, 65% of MPM have less than 25% of tumour cells visible on biopsy and only 8% of MPM comprise >75% malignant cells. It is likely therefore that tumour-matrix interactions are cardinal features of the disease.
Inflammation and fibrosis in the pleura are normally adaptive mechanisms that seal off foci of injury or infection. Within mesothelial cells however, insoluble fibres induce reactive oxygen species and double strand DNA breakages(6) that can cause malignant transformation.
Previous genomic analyses of MPM have shown a mutational landscape dominated by loss of function mutations in BAP1 and NF2(4,5). Larger structural variations in MPM are common(7), and recurrent deletions are recognised for CDKN2A (located at chromosome 9p21.3), NF2 (22q12) and BAP1 (3p21.3).
Given the proclivity for asbestos to induce DNA damage, we extended genomic findings in 121 MPM tumours by fine mapping of copy-number alterations (CNAs) with high density SNP arrays. We explored the mutational spectrum with whole exome sequencing (WES) in 50 subjects (21 of which had paired blood samples for germline DNA), before extending mutation detection to all tumours with a 57-gene targeted capture next-generation sequencing (TC NGS) panel (Supplementary Data Figure 1a,b and Supplementary Data Table 3). In addition, 19 low-passage primary mesothelioma derived cell cultures (8) (PMCC) were whole-genome sequenced (WGS).
Results
Demographic and clinical characteristics
One hundred and five of the 121 patients (87%) were male (Supplementary Data Table 1). Ninety tumours exhibited the epithelioid subtype of MPM, 25 were biphasic and 6 were sarcomatoid (Supplementary Data Figure1c). Patients with sarcomatoid disease were older than the other two groups (P= 0.05). Asbestos exposure had been documented clinically in 69% of cases. Survival time from diagnosis to death or last follow-up was available for 110 patients. The median overall survival (OS) for all subjects was 9.9 months with sarcomatoid patients showing a worse outcome than others, as described(9) (P=0.065) (Supplementary Data Table 1 and Figure 1d).

a) Statistically significant regions of amplification and deletion from GISTIC analysis of 118 subjects. Peak regions which pass both the G-Score (derived from amplitude and frequency) and q-bound (<0.05) threshold cut-offs are shown for deletions (blue) and amplifications (red) (see also Supplementary Data Table 2); b) Detailed map of the CDKN2A locus using the UCSC Genome Browser (hg19), showing histogram representation of overlap among deletion segments from the 118 subjects. IFN Type I genes are commonly within the deleted segments; c) Kaplan-Meier survival analysis of patients with and without CDKN2A locus deletions; d-f) Similar Genome Browser based maps of the BAP1, RB1 and SUFU deleted segments; g) Map for amplification segments from the RASSF7 locus.
Recurrent Copy number alterations (CNAs)
We analysed >950K SNPs (Illumina Infinium OmniExpressExome-8 v1.3 and v1.4) for CNAs using the GISTIC program. GISTIC estimates genomic boundaries for recurrent CNA events and assigns statistical significance after false discovery rate (FDR) corrections(10).
Deletion of CDKN2A was the most frequent event observed in our sample, detected in 71/118 tumours (60%), with 58 deletions (82%) predicted to be homozygous (Figure 1a and Figure 2). As previously reported(4,5), CDKN2A loss was associated with worse OS when compared with CDKN2A wild type patients (8.8 vs 13.0 months, Kaplan-Meier P=0.02) (Figure 1c).

The most common deletions (top panel), amplifications (middle panel) and mutations (bottom panel) are shown in 118 subjects. CNA analyses are derived from SNP arrays and mutated genes from the targeted capture sequencing panel.
Deletion of the CDKN2A region is extensive in many malignancies, and a full locus map (Figure 1b) revealed large deletions to also be present in MPM. The map showed a frequent and previously unremarked loss of the closely neighbouring Type I Interferon (IFN) genes (Figure 1b): 38/118 patients (32%) had predicted homozygous IFN Type I loss and 24/118 (20%) had heterozygous loss. Co-deletion of CDKN2A and IFN type I genes correlated with worse overall survival of the patients (p-value=0.01, 8.13 months for CDKN2A and IFN type I genes and 12.97 months for CDKN2A wild-type patients).
We observed frequent deletions at multiple other loci (Figure 1d-f, Supplementary Data Table 2). The most common novel deletion was the RB1 locus on 13q14.2 in 31/118 patients (26%). The RB1 tumour suppressor is activated downstream of CDK4 and CDK6(11) and its loss predicts a mechanism for resistance to CDK4/6 inhibitors.
Loss of a locus on 10q24.32 containing SUFU (Suppressor of Fused) was observed in 25/118 tumours (21%). SUFU inhibits activation of GLI transcription factors in the Hedgehog pathway, which is known to be disordered during MPM carcinogenesis(12,13).
Previously unrecognised regions of amplification (Figure 1a and Figure 2, Supplementary Data Table 2) included a locus on 11p15.5, amplified in 39/118 tumours (33%) and containing RASSF7 and miR-210 (Figure 1g). When up-regulated RASSF7 controls cell growth and apoptosis in different tumours(14), and functions as an oncogene in non-small cell lung cancer (NSCLC) interacting with MST1 to dysregulate Hippo signalling(15).
Other substantial amplifications included 19q13.43 in 24/118 tumours (20%), containing NLRP5, ZNF444 and ZNF787; 5q35.2 in 27/118 tumours (23%), containing GPRIN1 immediately adjacent to CDHR2 which may moderate contact inhibition of epithelial cells(16); and 5q35.3 in 26/118 tumours (22%) containing LTC4S and SQSTM1. The latter encodes p62, a mediator of autophagy influencing tumorigenesis, malignant growth and resistance to therapy(17).
Somatic mutations
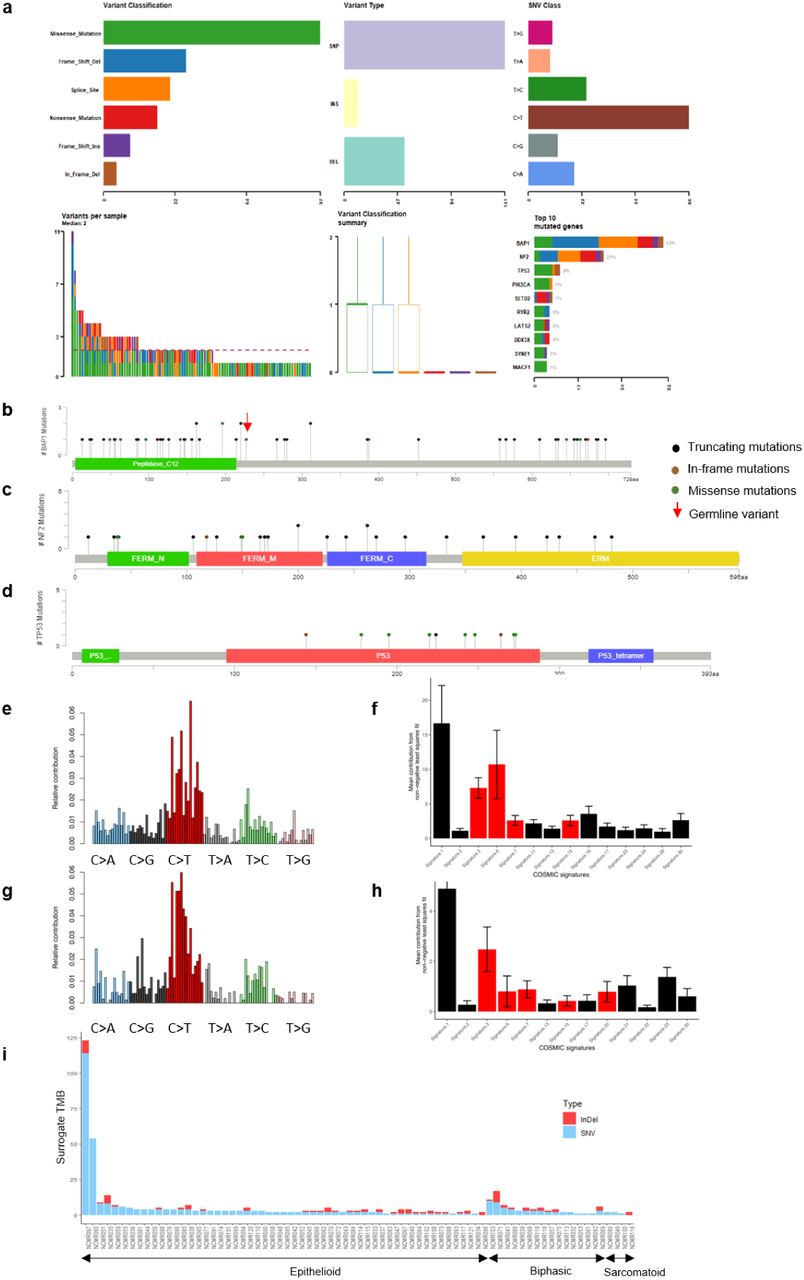
WES in 50 tumours (21 with paired peripheral blood DNA (PBL)) revealed no major loci beyond those previously described(4,5). We completed TCS in 119 patients, 77 of which had PBL, achieving a mean coverage of 792X for tumours and 802X for PBL. BAP1 was mutated in 39 subjects (33%); NF2 in 24 subjects (20%); TP53 in 9 subjects (8%) and SETD2 in 7 subjects (6%) (Figure 2 and Supplementary Data Figure 2). Mutations were scattered across coding regions of these genes (Supplementary Data Figure 3 b-d), consistent with their putative role as tumour suppressors.
We found two NRAS mutations at known oncogenic RAS hotspots (G12V and Q61H). Both mutations were found in sarcomatoid subtype tumours that did not have alterations in CDKN2A, BAP1 or NF2. Three other RAS pathway related genes were identified by WES: a NF1 stop mutation (c.6439C>T, p.Q2147*), a splice site RASA1 mutation (c.829-1_858.del) and a HRAS in-frame deletion (c.187_189del, p.E63del).
TP53 mutations carried a worse prognosis compared with TP53 wild-type counterparts (mean OS 5.7 vs. 13.6 months, P=0.0005), as previously described(5). We did not detect significant associations of other mutations with survival.
Combined analysis of CNA, WES and TCS (Figure 2) showed CDKN2A deletion to be present in 60% of tumours; BAP1 mutated or deleted in 54%; RASSF7 amplification in 33%; RB1 deleted or mutated in 26%; NF2 mutated in 20%; TP53 mutated in 8%; SETD2 in 6%; DDX3X in 5% and LATS2 in 5%.
We detected a missense germline mutation localized in the UCH domain of BAP1 from one patient with epithelioid subtype (Supplementary Data Figure 3b). In other subjects, single deleterious germline mutations were found in MSH5 and MSH6 (representing the mismatch-repair (MMR) pathway), RB1, SETD6 and BRCA2.
Mutational burden and signatures
A median of 31 non-synonymous somatic mutations per tumour exome were present in the 21 WES paired samples, consistent with the low rate observed by Bueno et al(5). We observed a similar low tumour mutational burden in the 77 paired samples that underwent targeted capture sequencing (Supplementary Data Figure 3i).
One patient (NCMR033) had a hypermutated tumour (167 somatic mutations), accompanied by a frame-shift deletion in MSH6 (p.Phe1104LeufsX11) and a frame-shift insertion in PALB2 (p.Met1049AspfsX4). PALB2 encodes a protein that recruits BRCA2 and RAD51 at the site of double-strand breaks(18) and plays a critical role in homologous recombination repair.
The mutation spectrum was characterized by C>T transitions, in both WES and TCS panel data (Supplementary Data Figure 3e and a respectively), consistent with earlier reports(4,5). Analysis of mutational signatures(19,20) found COSMIC signatures 3, 6 and 15 to be prevalent in the 21 paired WES samples (Supplementary Data Figure 3e, f) and in WGS from 19 PMCC(8) (Supplementary Data Figure 3g, h).
Signatures 3, 6 and 15 are all indicative of DNA damage and failed breakpoint repair(20). In other cancers, signature 3 mutations accompany biallelic inactivation of BRCA1 or BRCA2, where the inability to repair DNA predicts good responses to platinum therapy. MPM responds poorly to such therapies, and we hypothesise that signatures of DNA damage may follow the actions of asbestos in the progenitor neoplastic cell.
Histological correlations
We did not see any significant associations between common lesions and histological subtypes. RNA sequencing (RNASeq) however revealed differential transcription between histologies (Supplementary Data Table 4). As reported previously(5), WNT5B had higher expression in sarcomatoid tumours. Other genes significantly upregulated (Padjusted<0.001) in non-epithelioid tumours included GPR176 which acts as a circadian pacesetter(21), and known adverse factors for other cancers such as IGF2BP1, CCBE1, HS3ST3A1, TRAM2 and SERTAD2.
Loss of BAP1
We explored the effects of genetic alteration by comparing RNA-sequencing samples with and without specific genetic alterations. When compared to other tumours, BAP1 mutations or deletions were associated (Padjusted<0.05) with up-regulation of the RET proto-oncogene(22) and NNAT, which is associated with poor outcome in multiple cancers(23) (Supplementary Data Table 6). We found the negative association of BAP1 with RET to be present also in the Bueno et al.(5) (r=-0.32, P=2.2E-06) and TCGA-Meso(4) (r=-0.45, P=1.3E-06) datasets.
Hedgehog signalling
Loss of the SUFU locus in 25/121 tumours (21%) was associated with marked upregulation of the Patched 2 tumour suppressor (PTCH2) (Table 1). Ptch2 overexpression has been observed in Sufu knockout mice and is indicative of aberrant Hedgehog signalling(13). Hedgehog pathways are activated in MPM patients, in the absence of obvious mutations(12). Also upregulated were NHS, HOXA7 and TRPS1, each of which regulate tissue differentiation (Table 1).
Genes differentially regulated with SUFU deletions
We found a SMO (Smoothed) inhibitor (Vismodegib, GDC-0499) to be inhibitory in only one PMCC (Figure 3h). Hedgehog inhibition may be more effective in modulating tumour and stromal interactions(24) that should be investigated in organoid or murine models.

a) Characterisation by western blot of endogenous levels of RB, BAP1, Merlin (NF2), PTCH2, SUFU and p16 (CDKN2A) in primary cells and cell lines; b-g) Sensitivity dose curves for patient-derived MPM primary cells and cell lines against eight compounds. Standard errors of the mean are shown as bars. Dashed lines mark 50% inhibition; h) IC50 values for responses normalized to the control (DMSO), calculated by fitting a dose-response curve model in Graph Pad Prism and tabulated as concentration of drugs in µM. In cases where responses were above the highest drug concentration used in the experiment, IC50 estimates are marked as >50µM. Values in bold depict sensitive primary cells and cell lines, where IC50 to compounds <10µM and R2 (goodness of fit of curve) >0.7
SUFU loss unexpectedly correlated with downregulation of prominent T-cell genes (Table 1), including ODF3B; the killer-cell receptor KLRD1 (CD94); and HSH2D, a target of T-cell activation. Downregulated monocyte/macrophage and dendritic cell markers included IL4R, SCIMP, SIGLEC1 (CD169), CLEC10A, and CR1 (Complement C3b/C4b receptor 1).
We confirmed these results in independent datasets from Bueno et al.(5) and TCGA-Meso(4), finding that abundances of Hedgehog pathway transcripts SUFU, PTCH1 and PTCH2 correlated with KLRD1 and CR1 (Supplementary Data Table 5).
Hippo signalling
Hippo monitors external factors that shape tissue structure(25). NF2 recruits core Hippo signalling pathway members (LATS1/2) to inhibit activation of the transcriptional cofactors YAP1 and TAZ(26). RASSF7 also regulates Hippo pathways, and its overexpression promotes phosphorylation and nuclear translocation of YAP1(15). We found RASSF7 amplification in 39 MPMs, NF2 mutations in 24, LATS2 mutations in 6 and LATS1 in 2, so that non-overlapping lesions in Hippo pathways were present in 52/121 MPMs (43%) and a further 9 MPM had more than one lesions (total 50%) (Figure 2). WNT5B, increased in sarcomatoid tumours, may also induce YAP/TAZ activation through non-canonical pathways(27).
We did not find significant differences in transcript abundances when comparing RNASeq derived transcriptomes for RASSF7 amplifications to other tumours; or for lesions in Hippo signalling genes (NF2, LATS1, LATS2) singly or combined; or for MPMs with or without SETD mutations. We did not detect RASSF7 amplification in any of 19 primary cell lines examined by SNP array, which may reflect selection in culture for MPM genotypes that grow independently of a fibroblast matrix.
Immuno-histochemistry (IHC)
We tested how the most frequent genomic alterations, BAP1 mutation and CDKN2A deletion, were translated at protein levels by staining 28 tumours (Figure 4a) with antibodies against BAP1 and MTAP (as a potential surrogate marker for CDKN2A deletion) (Figure 4d, e).

a) Oncoplot of IHC staining and common genomic alterations; b-e) representative IHC images for PD-L1, MTAP and BAP1 (100x); f) analysis on BAP1 genomic and proteomic status by Fishers’ exact test; g) analysis of MTAP H-score in CDKN2A/MTAP deleted vs CDKN2A/MTAP wild-type by Fisher‘s exact t-test, with a threshold for MTAP H-score set at 50; h) Spearman correlation between PD-L1 gene expression and HC.
BAP1 staining revealed general or focal loss in 17/28 (61%) of cases, which partially associated with BAP1 mutation or deletion (P=0.01) (Figure 4f). There was significant difference when comparing MTAP H-score between CDKN2A/MTAP deleted and wild-type samples (P=0.001) (Figure 4g). The mitotic count and Ki-67 (both indicators of proliferation) correlated with each other (P<0.0001, r=0.42). Ki67 correlated with copy number burden (P=0.03, r=0.42) and with MTAP score (P=0.04, r=0.39), consistent with disordered cellular division accompanying CDKN2A loss.
Checkpoint inhibitors targeting PD-1 and its ligand PD-L1 cause marked tumour regression in some patients with MPM(3). However, PD-L1 is expressed at a low level, if at all, in most MPM and its status imperfectly predicts response to immune checkpoint inhibitors(3).
In our tumours, IHC staining for PD-L1 was also low, with only 4/28 cases (14%) exhibiting ≥ 10% expression, including one case > 70%. There was a good correlation between PD-L1 (SP263) staining and transcript abundance (P<0.01, r=0.7) (Figure 4h). We did not see a consistent relationship between any Hedgehog-related transcripts and PD-L1 in transcriptomic data (Supplementary Data Table 5).
High-level staining of the alternative immune-checkpoint protein VISTA (V-domain Ig suppressor of T cell activation)(28) has been observed in epithelioid MPM, and implies a better prognosis(4,29). We confirmed a high level of VISTA by IHC in our samples (Figure 4a), and in RNASeq data replicable associations were seen between VISTA and SUFU, PTCH1, PTCH2, KLRD1 and CR1 (Supplementary Data Table 5).
Drug-testing in primary cell models of MPM
We explored potential therapeutic pathways by determining the half maximal inhibitory concentration (IC50) of selected compounds with three PMCC(8) that had been whole-genome sequenced. We assessed by Western blots if deletions or mutations of the main MPM drivers were translated to protein levels (Figure 3a). For comparison, we included an immortalized mesothelioma cell line (H2052), a lung adenocarcinoma cell line (A549), and a transformed normal mesothelial cell line (Met-5A). We exposed cells to a range of drug concentrations (0.0005 to 50 micromolar (µM)), using as controls DMSO treated cells (Figure3b-g).
Because we had observed mutation signatures of DNA breaks, we tested two PARP inhibitors (Niraparib and Olaparib) that are effective in homologous repair deficiency(30). Despite reports suggesting utility in MPM(31), we did not see a consistent inhibition of primary cell growth (Figure 3h). A CDK4/CDK6 inhibitor (Palbociclib, PD0332991) showed only minor effects in our cell lines (Figure 3h).
RB1 loss has recently been shown to confer a robust and selective vulnerability to drugs that target DNA damage checkpoint (CHEK1) and chromosome segregation proteins such as Polo-Like-Kinase 1 (PLK1)(32). CHEK1 is over-expressed in MPM(33), and RNAi screens have shown MPM lines to be sensitive to CHEK1 and PLK1 knockdown. RB1 deficient tumours are hyper-dependent on Aurora kinase B (AURKB) for survival(34), and AURKB inhibitors are efficacious against RB1 deficient lung cancers at non-toxic doses(34). Consistent with these observations, we found micromolar (µM) to sub-µM responses when treating with an Aurora Kinase inhibitor (Alisertib, MLN8237); an inhibitor of PLK1/2/3 that induces G2/M arrest and apoptosis (Volasertib, BI6727)(35); and a CHEK1/2 inhibitor that abrogates the G2/S checkpoint (AZD7762).
The involvement of Hippo pathways in our results supports previous suggestions that YAP1 axis inhibition may be used in MPM therapy(26), and we found µM IC50 responses to the YAP inhibitor Verteporfin in all MPM cell lines (Figure 3h). Notably, immortalised Met-5A mesothelial cells that are not deficient in NF2 also responded.
Discussion
MPM is of low genetic complexity(5), implying the presence of core pathways mediating cell proliferation and raising the hope that therapies directed at these pathways will be effective. Cellular exposure to asbestos is accompanied by double strand DNA breaks(6) and DNA damage signatures were present in our tumour sequences. Consequently, we have extended previous genomic studies by testing for copy number aberrations (CNAs) through SNP genotyping arrays. We found genetic lesions to be enriched in RB1/cell-cycle, Hippo and Hedgehog pathways, and identified two major immunological influences.
The results of our investigations should be interpreted in the light of several limitations. Dense fibrosis is a variable feature of MPM, and tumour-matrix interactions may qualitatively differ across the fibrosis range. The TCGA analysis of MPM was confined to tumours with >70% MPM cells(4), providing a reference for one extreme of the range. Although we examined tumours with fibrosis extents down to 30%, we were not powered to investigate determinants of fibrosis extent.
Similarly, we were not powered to test systematically for the determinants of histological subtypes or histological features which may be important in clinical decision making. We did find distinctive transcriptome changes for some common lesions (BAP1 and SUFU loss), but not for lesions in the RB1 or NF2 pathways. This may be due to lack of power, or possibly to differences in gene expression that result from either acceleration or braking of cellular division.
We tested tool therapeutic compounds in patient-derived low-passage MPM cells. Although these cells contained the most common mutations, some CNAs, such as RASSF7 amplification were not found. We speculate that they may have been lost by weaning of pure MPM cultures from other cell types. Additionally, 2D cultures are not suitable for testing tumour-matrix interactions, and tumour explants, mixed 3D cultures and organoids may all help future investigations.
Amongst our positive findings, Cdkn2a loss and Hedgehog and Hippo pathway activation have been observed in murine models of asbestos exposure well before tumour development(12,36,37). Our results and the remarkable consistency of genetic lesions in MPM in humans(4,5) and in mice(36,37) suggest a hypothesis that recurrent MPM breakpoints and mutations occur in regions of chromatin that have been accessed during the inflammatory response to asbestos.
The most frequent genomic alteration in our subjects was deletion of the CDKN2A locus on 9p21.3. This deletion predicts a worse OS than other MPM. We observed that tumours with this deletion had a higher copy number burden compared with CDKN2A wild type patients, consistent with cell cycle dysregulation.
The CDKN2A locus encodes INK4A (p16) and ARF (p14) genes. p16 normally restrains cyclin-dependent kinases, so that CDK4/CDK6 inhibitors are potentially therapeutic for MPM(11). However, CDK4 and CDK6 downstream effects include phosphorylation and activation of RB1(11). Our finding of RB1 deletions in 34% of tumours with CDKN2A loss makes responses to CDK4/CDK6 antagonists less likely and as a possible consequence the CDK4/CDK6 inhibitor Palbociclib had marginal effects on primary cell survival.
We therefore tested compounds downstream of RB1, and showed that RB1 defective primary cells responded well (irrespective of CDKN2A deletion) to an Aurora Kinase inhibitor (Alisertib, MLN8237); an inhibitor of PLK1/2/3 that induces G2/M arrest and apoptosis (Volasertib, BI6727) and a CHEK1/2 inhibitor (AZD7762). These findings encourage the clinical investigation of these or related compounds.
We identified a recurrent novel amplification of RASSF7 in 31% of tumours. Taken with other Hippo pathway members (NF2, LATS1 and LATS2), 50% of tumours had at least one lesion of this pathway. Our testing of primary cells revealed micromolar responsiveness of MPM to the YAP inhibitor Vertiporfin, although it did not seem to depend on the presence of NF2 or other Hippo mutations. Vertiporfin is in common use as a photosensitiser in the therapy of macular degeneration and is relatively non-toxic.
BAP1 is the archetypal MPM gene(38) and was mutated in 31% of tumours and deleted in 33%. We gained some insight into its function by comparing transcriptome abundances between BAP1 mutation/deletion and BAP1 wild type tumours, where we found replicated up-regulation of the RET proto-oncogene. These results suggest tumour suppressor activities of BAP1 beyond deubiquitination(39). It may be of interest that RET inhibitors are effective in RET-driven NCSLC and thyroid cancers(40).
An important finding of our study was deletion of SUFU on chromosome 10q24.32 in 21% of tumours. However, we did not find SUFU deletions in primary cells and Vismodegib, a Hedgehog inhibitor, was efficient in only one primary cell line. A role for Hedgehog pathways in mesothelial-matrix interactions (as opposed to simple driving of cell division) is suggested by the upregulation of PTCH2, GJB2, NHS and HOXA7 in SUFU deleted tumours (Table 1). We speculate that Vismodegib could be more effective in stroma-rich settings than in isolated tumour cell culture.
A striking finding in RNA-sequencing expression data of tumours with SUFU loss was the downregulation of T-cell and antigen-presenting cell genes (Table 1). Although unexpected, these findings were strongly replicated in other data (Supplementary Data Table 5) and are consistent with the known central function of Hedgehog signalling in T-cells at the immunological synapse(41,42).
High levels of VISTA, an alternative checkpoint inhibitor, have previously been reported in MPM and confer a better outcome(4,29). We confirmed the strong staining for VISTA by IHC and found that VISTA abundance strongly correlated with other SUFU-affected immune-synapse genes. By contrast, PD-L1 staining was generally weak in the tumours. These findings provide a stimulus further to investigate VISTA therapeutic blockade in MPM. In the same context, Vismodegib might be considered as an adjuvant to immunotherapy in the presence of SUFU loss. It will be relevant to test if aberrant Hedgehog immune signalling is detectable in other malignancies.
It may also be of interest that the Type I Interferon genes on 9p21.3 were deleted in 52% of all MPM. Interferons induce complex pro-inflammatory responses within tumour cells as well as in accessory immune cells(43,44). Homozygous deletion of IFN genes is associated with poor response to CTLA4 blockade in patients with malignant melanoma(45). Historically, administration of IFNA2 to patients with MPM has occasionally induced complete regression(46,47). Additionally, early stage trials suggest that intra-pleural infection with viral vectors containing IFNA2(48) or IFNB1(49) induce inflammation and encourage beneficial responses in MPM, suggesting an adjuvant role for interferons in therapy.
The association with CDKN2A loss with higher copy number burdens might indicate a beneficial effect of immune checkpoint inhibitors, but the co-deletion of IFN type I could enhance tumour cell evasion of immune surveillance. Additionally, the loss of IFN genes may encourage the use of oncolytic virus as therapies. These alternatives could be explored in immunocompetent murine models of MPM
In conclusion, our analyses suggest roles for Aurora Kinase, PLK, CHEK and YAP inhibitors in the treatment of MPM growth. IFN Type I and SUFU deletions as biomarkers may guide more effective immunotherapies. VISTA inhibition may directly modify immune recognition of MPM, and an adjuvant role in immunotherapy seems possible for Hedgehog inhibitors. The involvement of Hippo and Hedgehog signals and the intense fibrosis seen clinically assert a central role for tumour-matrix interactions in the pathogenesis of MPM and suggest therapeutic avenues beyond tumour cell killing.
Methods
Sample collection
Thirty unpaired tumour samples were obtained from the NIHR-BRU Advanced Lung Disease Biobank and Royal Brompton and the Harefield NHS Trust (RBH) Diagnostic Tissue Bank (NRES:10/H0504/9 and 10/H0504/29) with eighty-two paired (tumour and blood) and 4 unpaired tumour samples obtained from MesobanK UK, Cambridge (NRES:13/EE/0169). Seven additional paired samples were obtained from the EQUALITY study (NRES:10/H0808/53). Tissues were optimally collected during diagnostic or surgical procedures prior to any anti-cancer treatment and were all snap frozen with or without RNAlater. Formalin-fixed paraffin embedded tissues were sectioned, stained with routine haematoxylin and eosin, and reviewed by two experienced pathologists to verify tumour histology and abundance. For RBH and EQUALITY tumours, tissues with 30% or more viable-appearing malignant cells were selected for whole exome sequencing (WES). MesobanK samples contained only tumours with > 50% malignant cells.
Genomic DNA isolation and quality control
Genomic DNA was isolated from frozen tumour tissues and matched normal tissue (blood) with routine methods (Qiagen DNA and RNA extraction kits, Qiagen, Hilden, Germany). DNA yield and purity were assessed with the Quant-iT™ PicoGreen dsDNA Assay Kit (Life Technologies, Carlsbad, USA) or Qubit 3.0 fluorimeter (Thermo Scientific, Massachusetts, USA) according to manufacturers’ protocols.
Whole exome sequencing
WES was performed at the McGill University and Genome Quebec Innovation Centre, Canada. Genomic DNA from tumour and blood samples were fragmented and hybridised as per SureSelectXT Target Enrichment System (Agilent SureSelect Human All Exon V4) for the Paired-End Multiplex Sequencing protocol. The captured libraries were sequenced on an Illumina HiSeq2000 according to standard protocols.
Targeted sequencing of a custom gene panel
The entire coding regions of fifty-seven genes were included in a hybridisation capture panel (Supplementary Data Table 3), based on: recurrence in our WES tumour set; reported in the Catalogue of Somatic Mutations in Cancer (COSMIC) database; implicated in cancer(50); or reported in the TCGA or Bueno et al. studies(4,5). Sequencing libraries were prepared from DNA extracted from tumours and normal tissue (whole blood) samples using the SureSelect QXT Target Enrichment System (Agilent, Santa Clara, USA) according to the manufacturer‘s protocols. Sequencing was performed on a MiSeq or NextSeq500/550 platform (Illumina) with a mean read depth of 780.6X (all samples).
Data processing and quality control
Raw fastq were quality checked before alignment with BWA mem (v 0.7.12). GATK software (v 3.8 and 4.1) was used to refine the alignment data before variant calling. For Target capture sequencing (TCS), somatic and germline variant calling was performed for the paired samples using VarScan software (v 2.4.2). For the un-paired samples joint variant calling was performed using Platypus (v 0.8.1). In case of WES, joint variant calling was performed at McGill using the GATK HaplotypeCaller.
Detection of candidate pathogenic somatic and germline variants
Candidate somatic and germline variants were checked for presence in population data and those with frequency >=10−3 were deemed polymorphic and filtered out. Further selection was based on either being assigned as High or Moderate impact by VEP (51) or predicted to be splice-site altering (dbscSNV (52) score of >0.6) by at least two of three algorithms. Further prioritisation of SNV (single nucleotide variant) candidates was done based on predicted deleteriousness from any one of SIFT, Polyphen and MutationTaster algorithms.
Copy-number (CN) analysis
121 DNA samples were interrogated at Eurofins against the Human Infinium Omni-Express-Exome v 1.3 and v 1.4 Bead Chips (Illumina) arrays containing >950K markers. 118 samples remained (77 paired and 43 unpaired) after QC checks. Raw copy number data (LRR and BAF) were exported from GenomeStudio software (v 1.9.4). GC correction was performed to account for genomic ‘wave artefacts affecting SNP arrays using ASCAT (v 2.4.4). The GC corrected Log R ratios (LRR) were then processed using DNACopy (v 1.52) for segmentation and filtered for marker support. Recurrent germline CN segments were identified and subtracted from the tumour sample CN segments. Germline subtracted copy number segments were then processed with GISTIC (v 2.0.23). Plotting of GISTIC results were done in maftools (v 1.4.28).
Mutation signature analysis
Somatic single nucleotide variants (SNVs) from the 21 paired WES samples were analysed for tri-nucleotide frequency around the mutated base using MutationalPatterns(53) in R. The Sanger COSMIC signature panel (n=30) was used to infer mutational processes by obtaining the percentage contribution of 30 signatures per sample. Only signatures contributing to >25% of samples were carried forward. Paired germline samples were not available for whole-genome sequencing (WGS) of 19 MPM primary cells (PMCC) (one MPM primary cell WGS had failed QC), and so annotation-assisted filtering of the total SNVs was done and only those SNVs that were non-polymorphic and either protein-sequence altering or predicted to be splice-site altering, were considered and analysed as described for the tumour tissue samples.
RNA sequencing
Total RNA was isolated by means of RNEasy Fibrous Midi kit (Qiagen, Hilden, Germany) according to manufacturer‘s protocol from 35 tumours. Concentration and quality were determined with the 2100 Bioanalyzer and Total RNA Nano kit (Agilent Technologies, California, United States) as per manufacturer’s instructions. RNA sequencing was performed at McGill.
Immunohistochemistry
3μm whole slide FFPE tumours sections mirroring fresh frozen tissue used for molecular analysis underwent H& E staining according to routine histopathological protocols. Further sections underwent staining for BAP-1 (Santa Cruz BioTechnology, clone C4), Ki67 (Ventana, 30-9), MTAP (NovusBio, 2G4), PD-L1 (Ventana, SP263) and VISTA (D1L2G, Cell Signalling Technology). Mitotic activity was evaluated by counting the number of mitotic figures in the area of highest activity, over 10 high powered fields (0.24mm2).
Whole genome sequencing of primary cell lines
Genomic DNA extracted from patient derived MPM cell lines (n=20, of which one failed QC) and primary normal mesothelial cells, MES-F (purchased from ZenBio, USA) underwent WES (McGill) and SNP genotyping (Eurofins). Genomic details of the commercial cell line were obtained from published data (COSMIC, CCLE databases, 61).
In vitro drug testing
Patient-derived primary cells, Meso-27T, Meso-33T and Meso-70T were obtained from the MRC Toxicology Unit, University of Cambridge, UK. Commercial cell lines NCI-H2052 (sarcomatoid mesothelioma), A549 (lung adenocarcinoma) and Met-5A (normal mesothelial, SV40 transformed) previously obtained from ATCC were gifted from the MRC Toxicology Unit. Original establishment of the primary cells was as previously described21. All primary cells and cell lines were maintained in RPMI-1640 growth media supplemented with L-glutamine (2 mM), penicillin (100 U/ml), streptomycin (100 μg/ml) and 10% FBS at 37 °C in 5% CO2.
Eight drugs were investigated: Niraparib (MK-4827, HY-10619, MedChem Express), Olaparib (HY-10162, MedChem Express), Palbociclib, PD0332991 (A8316, ApexBio), Alisertib (MLN8237, S1133, Selleckchem), Volasertib (BI6727, S2235, Selleckcehm), Vismodegib (GDC-0499, S1082, Selleckchem), AZD7762 (S1532, Selleckchem) and Verteporfin (SML0534, Sigma Aldrich). All drugs were diluted in DMSO and aliquots maintained at −20°C. Drug aliquots were freeze-thawed no more than three times. For all experiments, controls consisted of DMSO-alone treated primary cells or cell lines.
Cells were seeded in 96-well plates (4 × 10³ cells/well) 24h prior to drug treatments. Each line was treated for six days (except for drug PD0332991 where treatment was 3 days) with a range of concentrations from 50 to 0.0005μM. Cell viability was measured with MTS assay (CellTiter 96® AQueous One Solution Cell Proliferation Assay, Promega) on a plate reader (Tecan).
Three independent experiments, each having three technical replicates, were conducted for each drug tested. Results are represented as the average normalized to the control at each time point (mean ± s.e.m.). Briefly, the raw optical densities obtained from each well were normalized to the average of DMSO control wells, that was considered 100% viability (maximal DMSO concentration used was 0.5%). IC50 values were calculated with Graph Pad Prism 5 software using a dose-response curve fit model using the nonlinear log (inhibitor) versus response-variable slope (four parameters) equation. In addition, the IC50 values were only considered if the software gave unambiguous results and the R2 value was > 0.7.
Statistical analysis
Categorical variables were evaluated using Fisher’s exact test for two-by-two comparison or Pearson’s χ2 for comparison that exceeded the two-by-two condition. Differences between groups were evaluated by means of nonparametric Mann-Whitney or Kruskal-Wallis test.
Clinical outcomes
Overall survival (OS), defined as time from date of diagnosis to time of death, was available for 110 patients. OS was estimated using the Cox-Mantel log-rank test, Kaplan-Meier method. Censoring of OS was done at the date of the last follow-up if death did not occur. Survival analyses were performed using the long-rank Kaplan-Meier and the differences in survival curves were assessed by Mantel Cox Log rank test. A P≤0.05 was considered statistically significant and noted as: *P≤0.05, **P≤0.01, ***P≤0.001. Tests and graphs were performed with Graph-Pad Prism 5 (GraphPad Software Inc, San Diego, CA), SPSS Statistic 25 or R studio.
Data Availability
All sequence data is being depositited with the European Genome Archive and will be made freely available following acceptance in a peer-reviewed journal
Author contributions
WOCMC, MFM, ML, SP and AMB planned the study; AN processed samples and prepared libraries for targeted capture sequencing, post-analysed whole exome, TCS, RNA sequencing and IHC data, and performed drug testing on primary cells and cell lines; AM performed bioinformatics analysis of whole exome and whole-genome sequencing, target capture, RNA sequencing and copy number data; SG and SKL processed and prepared samples for whole exome, RNA sequencing and copy number analysis; HA analysed WES data; DMR and ME provided support in generating the TCS panel and analysis of the libraries; AB performed immunohistochemistry staining, YZZ and AGN interpreted immunohistochemistry data; TC, XMS, AEW and MM established and characterized primary cells from tumours; ML oversaw whole-exome and RNA sequencing of the samples and advised on analyses; EL, RCR and TB gathered samples and associated metadata for the study; and SP and ANT provided clinical and epidemiological scientific guidance. AN and AM wrote the first draft of the manuscript with guidance by WOCMC, MFM and AMB, before editing by all the other authors.
SUPPLEMENTARY DATA
Patient demographics
Significant copy number deletions and amplifications
Targeted sequencing gene panel
Genes differentially regulated in histological subtypes
Correlation of SUFU and immune function genes and replication
Genes differentially up-regulated in BAP1 mutated tumours

a) Summary of samples used in each analysis; b) Venn diagram showing overlapping of samples used in WES, SNP genotyping and targeted capture sequencing; c) Sankey diagram on histological subtype and patients’ gender; d) Kaplan-Meier survival curves on histological subtypes


a) Summary of mutation spectrum observed for genes from targeted capture sequencing panel; b-d) Distribution of mutations in BAP1, NF2, and TP53; e) Mutational signature in 21 paired MPM analysed by WES; f) Mean percentage of contribution for COSMIC signatures; g) Mutational signature in 19 patient-derived MPM cell lines; h) Mean percentage COSMIC signatures in each cell line; i) Tumour mutation burden (TMB) derived from targeted capture sequencing of 57-gene panel and hence abbreviated as ‘Surrogate TMB’, in 77 paired samples. Briefly, all somatic SNVs or, InDels observed per sample, across the gene-panel are summed to derive surrogate TMB.
Footnotes
Financial support This study was financially supported by a Libor Fund grant from the UK Department of Health, by the British Lung Foundation and by the Asmarley Foundation. MMF, AEW, XMS and TC are funded by the UK Medical Research Council. SP acknowledges NHS funding to the Royal Marsden Hospital-Institute of Cancer Research Biomedical Research Centre. We thank Cambridge Biomedical Research Centre and Cambridge Cancer Centre.
Conflict of interest disclosures SP reports honoraria from BMS, Roche, Takea, AstraZeneca, Chugai, Novartis, Pfizer, MSD, EMD Serono, Guardant Health, AbbVie, Boehringer Ingleheim, and Tesaro. All other authors have no competing interests to declare.
References


