
Abstract
Background Pay-for-performance reimbursement ties hospital payments to standardized quality of care metrics. The impact of pay-for-performance reimbursement models on safety-net hospitals, which care primarily for uninsured or underinsured patients, remains poorly defined. This study evaluates how standardized quality of care metrics vary by a hospital’s safety-net status, and helps us better understand the potential impact that pay-for-performance reimbursement could have on funding of safety-net hospitals.
Methods We identified 1,703,865 bladder, breast, cervix, colon, endometrium, gastric, lung, ovary, or rectum cancer patients treated at 1,344 hospitals diagnosed between 2004 and 2015. Safety-net burden was defined for each hospital as the percentage of uninsured or Medicaid patients cared for by that hospital. Hospitals were grouped into low-, medium-, and high-burden hospitals. We evaluated the impact of safety-net burden on concordance with 20 standardized quality of care measures, adjusting for differences in patient age, gender, stage at diagnosis, and comorbidity.
Results Patients seen at high-burden hospitals were more likely to be young, male, black, Hispanic, and to reside in a low-income and low-educated region. High-burden hospitals had lower adherence to 13 of 20 quality measures compared to low-burden hospitals (all p<0.05). Among the 350 high-burden hospitals, the quality measures were lowest for those caring for the highest fraction of uninsured or Medicaid patients, minority serving hospitals, and those caring for less educated patients (all p<0.001).
Discussion Cancer care at safety-net hospitals was associated with lower concordance to standardized quality of care measures. Under a pay-for-performance reimbursement model these lower quality of care scores could decrease payments to safety-net hospitals, potentially increasing health disparities for at-risk cancer patients.
Background
Reimbursement for healthcare in the United States (US) has steadily moved from a fee-for-service reimbursement model to pay-for-performance or value-based reimbursement models1-3. Paying providers and hospitals for high quality care (pay-for-performance), as opposed to simply paying for providing care (fee-for-service), appeals to multiple stakeholders. Modern pay-for-performance reimbursement strategies depend on standardized assessments of quality of care, and typically hospitals with higher aggregate quality scores receive performance bonuses, whereas hospitals performing poorly incur financial penalties. In general, the quality of care metrics used to define reimbursement are adjusted to account for differences in patient age, gender, geography, disease severity, and underlying patient comorbidity. However, payers such as Medicare typically do not account for differences in race, ethnicity, socioeconomic status, or other social determinants of health, based on the argument that hospitals with higher percentages of underserved patients should not be held to a lower standard of care4.
Safety-net hospitals provide care for a large proportion of uninsured and Medicaid-insured patients, and overall provide a valuable service for underserved individuals across the US5-7. Given the insurance status of patients cared for by safety-net hospitals, these institutions at baseline receive lower reimbursement for providing healthcare, and therefore often struggle financially8. Furthermore, the population of patients treated by safety-net hospitals often face social, economic, and logistic barriers to receiving high quality timely healthcare9-11. Under a pay-for-performance reimbursement model, these barriers to providing high quality care could reduce hospital revenue for safety-net-hospitals, which could indirectly widen health disparities among an at-risk population of patients. In areas outside of oncology, research demonstrates that pay-for-performance reimbursement policies could lead to decreased payments to hospitals caring for underserved patients12,13, though this question has not been addressed within the field of oncology. We hypothesize that the complex and multidisciplinary treatment required for timely, high quality cancer care could lead to decreased quality of cancer care at safety-net hospitals. This in turn could lead to decreased reimbursement under a pay-for-performance reimbursement model. The purpose of this study was to evaluate the relationship between safety-net hospitals and standard quality of care metrics in a large population-based cohort of cancer patients. Understanding this relationship will provide insight into the impact that pay-for-performance reimbursement for oncology could have on safety-net hospitals.
Methods
Data source
Patients were identified from the National Cancer Database (NCDB), which is a large cancer registry jointly supported by the American College of Surgeons and the American Cancer Society. The NCDB represents a hospital-based cancer registry that collects patient clinical and treatment data on incident cancer cases diagnosed from over 1,500 facilities, which covers 70% of cancer cases diagnosed each year in the United States.
Quality of care measures
The Commission on Cancer (CoC) is a consortium of professional organizations dedicated to improving survival and quality of life for cancer patients through standard-setting, prevention, research, education, and the monitoring of comprehensive quality care14. The CoC has produced several cancer quality of care measures which directly draw from data collected within cancer registries15. Each quality measure focuses on one of three areas: accountability, quality improvement, or surveillance. Accountability measures are backed by high levels of evidence typically including multiple randomized trials. Quality improvement measures are not backed by randomized trials, and are derived from lower levels of non-randomized evidence. Surveillance measures have more limited evidence, and often reflect the status quo. We evaluated 20 quality of care measures across nine cancer sites: bladder, breast, cervix, colon, endometrium, gastric, non-small cell lung, ovary, and rectum. Descriptions of the 20 quality of care measures included in this study are included in Table 1.
Patient selection
The individual quality of care measures inherently assess quality among patients with different tumor sites, stages and treatments. Our initial patient selection strategy within NCDB identified patients using standard inclusion criteria to identify eligible patients for each quality metric16. This initial query identified 1,762,441 patients aged 18 and over with the appropriate stage and treatment diagnosed between 2004 and 2015. Our estimation of hospital safety-net status required knowledge of insurance status, therefore our initial query only included subjects with known insurance status. We excluded 58,576 patients with missing tumor- or treatment-related variables required to calculate specific quality of care endpoints. Supplementary Table 1 demonstrates details of the patient selection process. There was no difference in the proportions of Medicaid and uninsured patients versus insured patients included in the initial query compared to the final study cohort. The final study cohort included 1,703,865 patients (Table 2).
Hospital safety-net burden
As defined by the Institute of Medicine, healthcare safety-net hospitals refer to facilities that deliver a significant level of healthcare to patients with no insurance or Medicaid17. We defined each hospital’s safety-net burden as the proportion of cancer patients cared for throughout the study period without insurance or with Medicaid. To measure safety-net burden, we used all solid tumor cancer patients within NCDB diagnosed between 2004 and 2015 with known insurance status (4,696,779 patients), as opposed to using only patients in this study. Similar to prior research, we divided hospitals by safety-net burden into quartiles and assigned the lowest quartile as low-burden hospitals, the middle 2 quartiles as medium-burden hospitals, and the highest quartile as high-burden hospitals18. Therefore, high burden hospitals care for the largest fraction of uninsured or Medicaid patients.
Study covariables
Study covariables included patient factors such as age at diagnosis, year of diagnosis, gender, race, ethnicity, and Charlson comorbidity score. Socioeconomic information included zip-code level median household income and high school graduation rate. Clinical factors included AJCC 6/7th edition tumor stage.
Statistical analysis
Pearson chi-square tests and Wilcoxon rank sum tests were used to identify differences in patient characteristics by hospital safety-net burden group. We calculated quality metric concordance rates for each of the 20 quality metrics, defined as the fraction of patients receiving concordant care stratified by safety-net status. Keeping consistent with Medicare’s pay-for-performance reimbursement models, we risk-adjusted our quality concordance rates to remove the hospital-specific imbalance of patient age, gender, comorbidity, and differences in stage at presentation4,19-22.
We conducted subset analyses among high-burden hospitals to determine how quality metric concordance rates vary by different hospital characteristics. This subset analysis evaluated the total hospital concordance level with all metrics. Hospital characteristics assessed included the hospital safety-net burden (fraction of uninsured or Medicaid patients), as well as the proportion of minority patients the hospital serves (non-White or Hispanic patients), and income and education level of patients. This subset analysis consisted of a linear regression treating each hospital as an independent observation, weighting the hospitals by their patient volume.
Statistical analyses were conducted with SAS (Version 9.4; SAS Institute Inc., Cary, NC), and regression figures were generated with R (Version 3.6.1; The R Foundation for Statistical Computing, Vienna, Austria). Statistical tests were two-sided, and p-values < 0.05 were considered statistically significant.
Results
Hospital and patient characteristics
Our study cohort included 1,703,865 cancer patients treated at 1,344 hospitals. This included 326 low-burden hospitals (lowest quartile of uninsured or Medicaid patients), 668 middle-burden hospitals, and 350 high-burden hospitals (highest quartile of uninsured or Medicaid patients). High-burden hospitals treated a median of 13.4% uninsured or Medicaid patients, compared to 7.7% for middle-burden hospitals, and 3.9% for low-burden hospitals. In general, higher-burden hospitals were more likely to be academic and located in the Midwest and West, compared to middle- and low-burden hospitals. High-burden hospitals were also more likely to treat black, Hispanic, younger, male, low education, low income, and advanced stage patients compared to middle- and low-burden hospitals. See Table 2 for full descriptive characteristics of the study subjects stratified by hospital.
Concordance with quality of care measures
The general level of quality metric concordance across the whole study population varied substantially by the individual quality metric, ranging from a low of 37.5% with appropriate lymph node removal in surgery for lung cancer to a high of 91.0% with appropriate radiation after breast conserving surgery (Table 3). Quality metrics involving surgery (appropriate surgery or lymph node removal) had the lowest concordance rates (mean 67.7%), followed by radiation alone (78.2%), chemotherapy or hormonal therapy alone (79.1%), and combination chemotherapy/radiation (81.1%). High-burden hospitals were significantly less likely to meet recommendations for 13 of 20 quality measures (65%) compared to low-burden hospitals (Table 3). Among the underperforming low-burden hospitals, the quality gap in concordance levels between high- and low-burden hospitals ranged from 2.1% to 11.1%. High-burden hospitals underperformed low-burden hospitals in 4 of 8 quality measures related to surgery (50%), in 5 of 5 quality measures related to chemotherapy or hormonal therapy alone (100%), in 3 of 4 quality measures related to radiotherapy alone (75%), and in 1 of 3 quality measures related to combination chemoradiotherapy (33.3%). Of note, high-burden hospitals underperformed low-burden hospitals in 5 of 5 “accountability” quality measures (100%) which reflect measures backed by the highest levels of evidence. In 1 of 20 quality measures, the high-burden hospitals outperformed low burden hospitals – this specific quality metric represented overuse of surgery in lung cancer, with low-burden hospitals more likely to overuse surgery compared to high-burden hospitals.
Variation in quality among high-burden hospitals
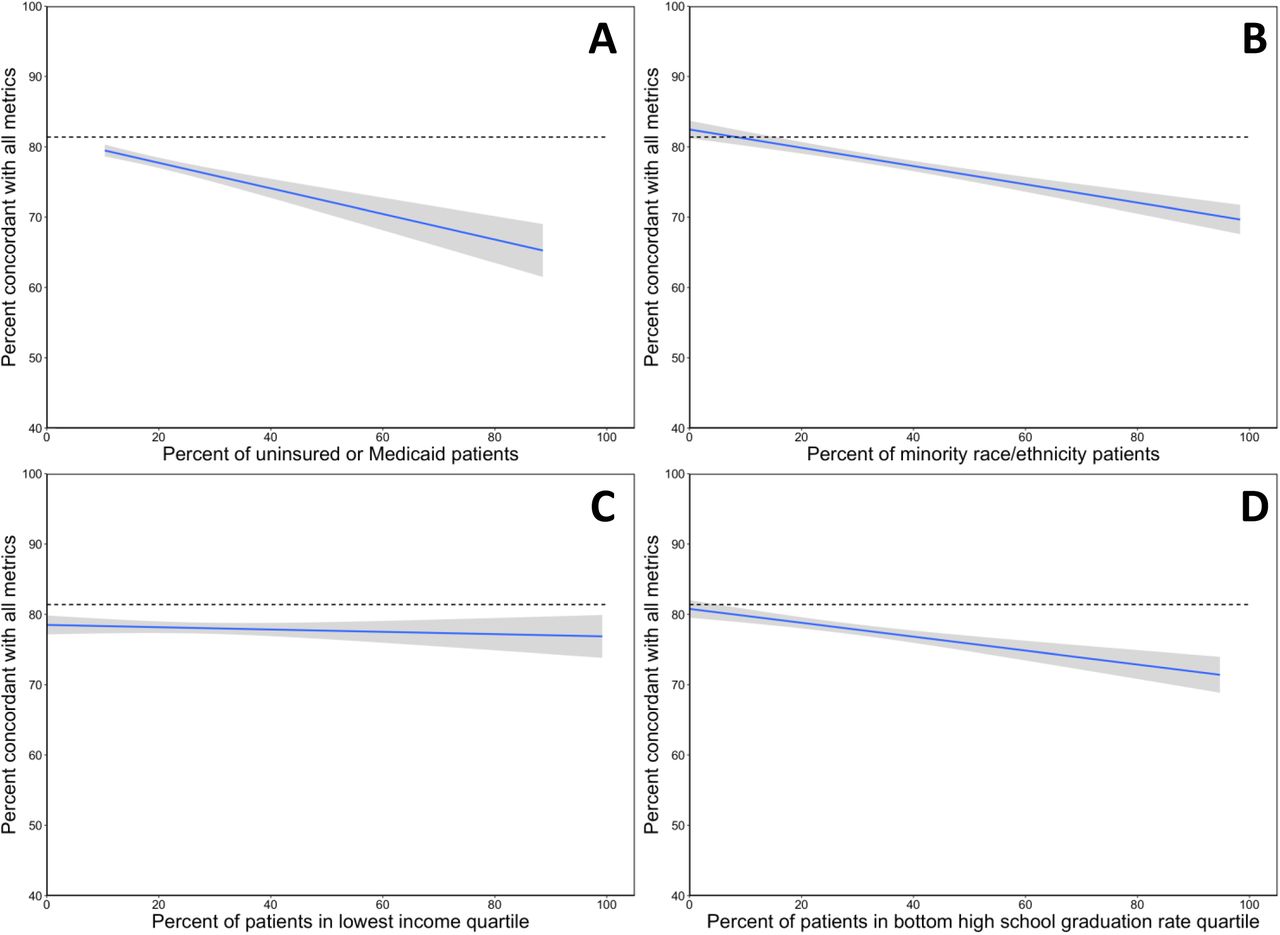
Among the 350 high-burden hospitals, we found that overall hospital guideline concordance rates varied by hospital characteristics (Figure 1). Hospitals caring for larger fractions of uninsured or Medicaid patients (Figure 1A), minority serving hospitals (Figure 1B), and hospitals caring for less educated patients (Figure 1D) all had significantly lower levels of guideline concordance with quality measures (all p<0.001). We found no correlation between income level of patients and guideline concordance rates (Figure 1C; p=0.43).

This figure represents an analysis among the high-burden hospitals (hospitals caring for highest quartile of uninsured or Medicaid patients) comparing hospital-wide characteristics to concordance with quality of care metrics. The solid line represents the relationship between hospital characteristic and concordance level, and the shaded region represents the 95% confidence band. The dotted line represents the average quality metric concordance level among low- and medium-burden hospitals (81.6%).
Discussion
This current study with over 1.7 million cancer patients demonstrates that hospitals caring for a disproportionate number of uninsured or Medicaid patients have a lower likelihood of providing care concordant with standard quality measures. While our study represents the first to evaluate concordance with quality of care measures, others have studied patterns of care and outcomes at safety-net hospitals. Themes that arise among patients treated at high-burden hospitals include longer hospital stays, higher rates of operative complications, increased mortality, and increased costs of care18,23,24. Our study supports this existing literature, and overall research demonstrates a consistent association between high-burden hospitals and decreased quality of care.
The association between hospital safety-net status and decreased quality of care represents an important point worth further discussion. One must consider that this association between hospital safety-net status and patient outcomes does not imply causality. Safety-net hospitals by definition provide care for poor and disadvantaged patients. This current study supports prior research25,26, which demonstrates that hospitals with a higher safety-net burden care for a higher fraction of racial and ethnic minorities, with decreased income, lower levels of education, and more advanced stage cancer on presentation. These at-risk patients may have economic, social, or health care access-related barriers which directly influence the quality and timeliness of care. A substantial body of literature demonstrates that these social determinants of health independently influence patterns of healthcare delivery27,28. Hospitals should strive to provide equal care to all patients irrespective of their sociodemographic backgrounds; however, providing high quality timely care can prove challenging with our most underserved patients.
Healthcare is rapidly transitioning from a fee-for-service reimbursement model to pay-for-performance reimbursement, which strives to reward hospitals and providers for delivering high-quality healthcare. While pay-for-performance reimbursement models may appeal to both payers and stakeholders, one must consider the impact these alternative reimbursement policies will have on health disparities. In general, quality of care measurements represent a central feature in value-based reimbursement models. For example, the Oncology Care Model, an alternative payment model currently being piloted by CMS, includes four clinical care quality measures29. Three of these four quality measures were evaluated in this current study, and high-burden hospitals underperformed low-burden hospitals in all three (chemotherapy in colon cancer, chemotherapy in breast cancer, hormone therapy in breast cancer). Similar to CMS, private insurers are also piloting alternative payment models30-32. This current study points to a concerning reality that moving to a pay-for-performance reimbursement paradigm in oncology may further decrease payments to hospitals caring for underserved and minority patients.
This current study highlights another area of concern in that among safety-net hospitals, those with the lowest concordance with quality metrics cared for the highest fraction of underinsured, minority, and uneducated patients. This suggests that hospitals caring for the most at-risk patients may incur the highest financial penalties under pay-for-performance reimbursement models. Our finding of safety-net hospital vulnerability with oncology reimbursement supports research in other areas in healthcare demonstrating that value-based payments can exacerbate health disparities33. A recent study by Chen et al., evaluated the Medicare Physician Value-Based Payment Modifier Program, initiated in 2015, which provides bonuses to practices based on quality and costs of care. This study found that practices caring for more socially at risk patients had lower quality scores, fewer bonuses and more penalties34. This so-called “reverse Robin Hood” effect takes money from underserved hospitals (in the form of penalties) and gives it to wealthier hospitals (in the form of bonuses)35.
Ideally, payment models should strive to define fair, equitable, and non-discriminatory quality measures upon which to base reimbursement. However, identifying good quality measures independent of race or socioeconomic status in oncology, and in medicine in general, can prove difficult36. Regardless, value-based reimbursement models should consider actionable solutions to avoid expanding health disparities. Adjusting quality scores for a patient’s race and socioeconomic status represents one potential solution. While this approach might help reduce the reimbursement gap it also in theory sends a message that poor quality of care is acceptable at hospitals serving underserved patients. Another pay-for-performance approach to minimize disparities would include comparing “apples to apples”33 – or in other words, compare hospitals based on their patient-risk profile. This would include comparing performance for safety-net hospitals to other safety-net hospitals, which research demonstrates has the potential to substantially reduce disparities in payments across organizations37. Regardless of the solution, researchers and policymakers should continue to focus on the complex intersection of reimbursement policy and health equity to help optimize patient care for the underserved.
This retrospective observational study has potential limitations worth considering. First, the NCDB does not capture information on patient variables including performance status, body habitus, smoking status, and other risk factors which may help explain the differences in concordance to quality of care measures. However, it would be unlikely for these risk factors to factor into any risk-adjustment protocol given the difficulty of measuring these data points at a national level. Overall, the data recorded within NCDB reflect the data used in current quality measures in oncology29. Another potential limitation refers to generalizability. While the NCDB includes over 70% of incident cancer cases in the US, this only includes Commission on Cancer accredited facilities. Given the barriers to accreditation and costs associated with data collection, it is likely that under-resourced safety-net hospitals could be underrepresented in our study population. However, including these more under-resourced facilities in our study may in fact widen the gap between high-burden and low-burden hospitals, though more research is needed to address this question. Lastly, our assessment of guideline concordance depends on data captured by individual hospital registrars. Any inaccuracies in data collection would result in misclassification of our endpoints, and could influence our results. However, individual facilities undergo credentialing and internal quality assurance procedures38 to assure high quality of data collection. Despite this internal quality assurance, misclassification could add bias to the study findings. Though one must consider that the data captured by registrars is the same data used to determine hospital performance metrics, therefore this misclassifications would translate into bonuses or penalties under a pay-for-performance reimbursement model.
Despite these limitations, our results highlight a concerning pattern of diminished quality of care among hospitals caring for disproportionate numbers of uninsured or Medicaid patients. These differences in quality of care in part reflect the social and economic challenges faced by our underserved patients. As we move towards pay-for-performance healthcare, these quality gaps will translate to reimbursement gaps, which could in fact exacerbate health disparities among our underserved population. Value-based reimbursement represents the future of healthcare; however, policymakers must remain cognizant of the impact that reimbursement policy has on our at-risk population.
Data Availability
All data referred to in the manuscript is publicly available through the National Cancer Database (NCDB).
Footnotes
Support: NIH TL1 TR001443 (RRS, PTC, PR, MGB), NIH U54 CA132379 (JDM)
Disclosures: RRS and JDM receive compensation for consulting from Boston Consulting Group. PR receives compensation for consulting from Peptide Logic, LLC.
REFERENCES


