
Abstract
As vaccination against COVID-19 stalls in some countries, increased accessibility and more adaptive approaches may be useful to keep the epidemic under control. Here we study the impact of reactive vaccination targeting schools and workplaces where cases have been detected, with an agent-based model accounting for COVID-19 natural history, vaccine characteristics, individuals’ demography and behaviour and social distancing. We study epidemic scenarios ranging from sustained spread to flare-up of cases, and we consider reactive vaccination alone and in combination with mass vaccination. With the same number of doses, reactive vaccination reduces cases more than non-reactive approaches, but may require concentrating a high number of doses over a short time in case of sustained spread. In case of flare-ups, quick implementation of reactive vaccination supported by enhanced test-trace-isolate practices would limit further spread. These results provide key information to promote an adaptive vaccination plan in the months to come.
Introduction
Achieving high vaccination coverage against COVID-19 is now the main strategy to reduce disease burden and pressure on health care organisations and to lift non-pharmaceutical interventions (NPI). To this end, mass vaccination campaigns started in Western countries mainly prioritising health care workers and groups more at risk of severe infection 1–4 – i.e. the elderly and those with comorbidities. However, now that vaccination has been opened to all adults, vaccine uptake remains below needs - e.g. in France, the United States - due to logistical issues, vaccine accessibility and/or hesitancy. With cases on the rise again due to the emergence of new viral variants, vaccine delivery must become more adaptive in response to the epidemic situation. For instance, it could preferentially target people at higher risk of infection, e.g. because attending places where more cases are reported. As people who are hesitant to vaccinate are more likely to accept vaccination when the perceived risk of infection is higher 5, this would help overcome barriers to vaccination 6.
Hotspot vaccination, which involves redirecting vaccine supplies to geographic areas of highest incidence, is already part of some European countries’ plans to combat the emergence of variant Delta 6. But other reactive vaccination schemes are possible, such as ring vaccination that targets contacts of confirmed cases or contacts of those contacts, or vaccination in workplaces or schools where cases have been detected. This could potentially improve vaccine impact by preventing transmission where it is active and even enable the efficient management of flare-ups. For outbreaks of smallpox or Ebola fever, ring vaccination has proved effective to rapidly curtail the spread of cases 7–10. However, the experience of these past epidemics cannot be transposed directly to COVID-19 due to the many differences in the infection characteristics and epidemiological context. For example, COVID-19 cases are infectious a few days before symptom onset 11, but generally detected a few days later. This means they may have had time to infect their direct contacts, potentially limiting the efficacy of ring vaccination. Vaccinating an extended network of contacts, as could be done with the vaccination of whole workplaces or schools, could have a larger impact, especially if adopted in combination with strengthened protective measures to slow down transmission, such as masks, physical distancing, and contact tracing. This could be feasible in many countries, leveraging the established test-trace-isolate (TTI) system that enables prompt detection of clusters of cases to inform where vaccines should be deployed. Properly assessing the interest of reactive vaccination therefore requires to consider in detail the interactions of vaccine characteristics, pace of vaccination, COVID-19 natural history, case detection practices and overall changes in human contact behaviour.
We therefore extend an agent-based model that has been previously described 12 to quantify the impact of a reactive vaccination strategy targeting workplaces, universities and 18+ years old in high schools where cases have been detected. We compare the impact of reactive vaccination with non-reactive vaccination in similar settings or with mass vaccination, and test these strategies alone and in combination. We explore differences in vaccine availability and logistic constraints, and assess the influence of the dynamic of the epidemic (low/high incidence, new emerging variant) and different stages of the vaccination campaign.
Results
COVID-19 vaccination strategies targeting workplaces and schools
We extend a previously described SARS-CoV-2 transmission model 12 to simulate vaccine administration, running in parallel with other interventions - i.e. contact tracing, telework and social restrictions. Following similar approaches 13–16, the model is stochastic and individual based. It takes as input a synthetic population reproducing demographic, social-contact information, workplace sizes and school types (Figure 1A) of a typical medium-sized French town (117,492 inhabitants). Contacts are described as a dynamic multi-layer network 12 (Figure 1B).
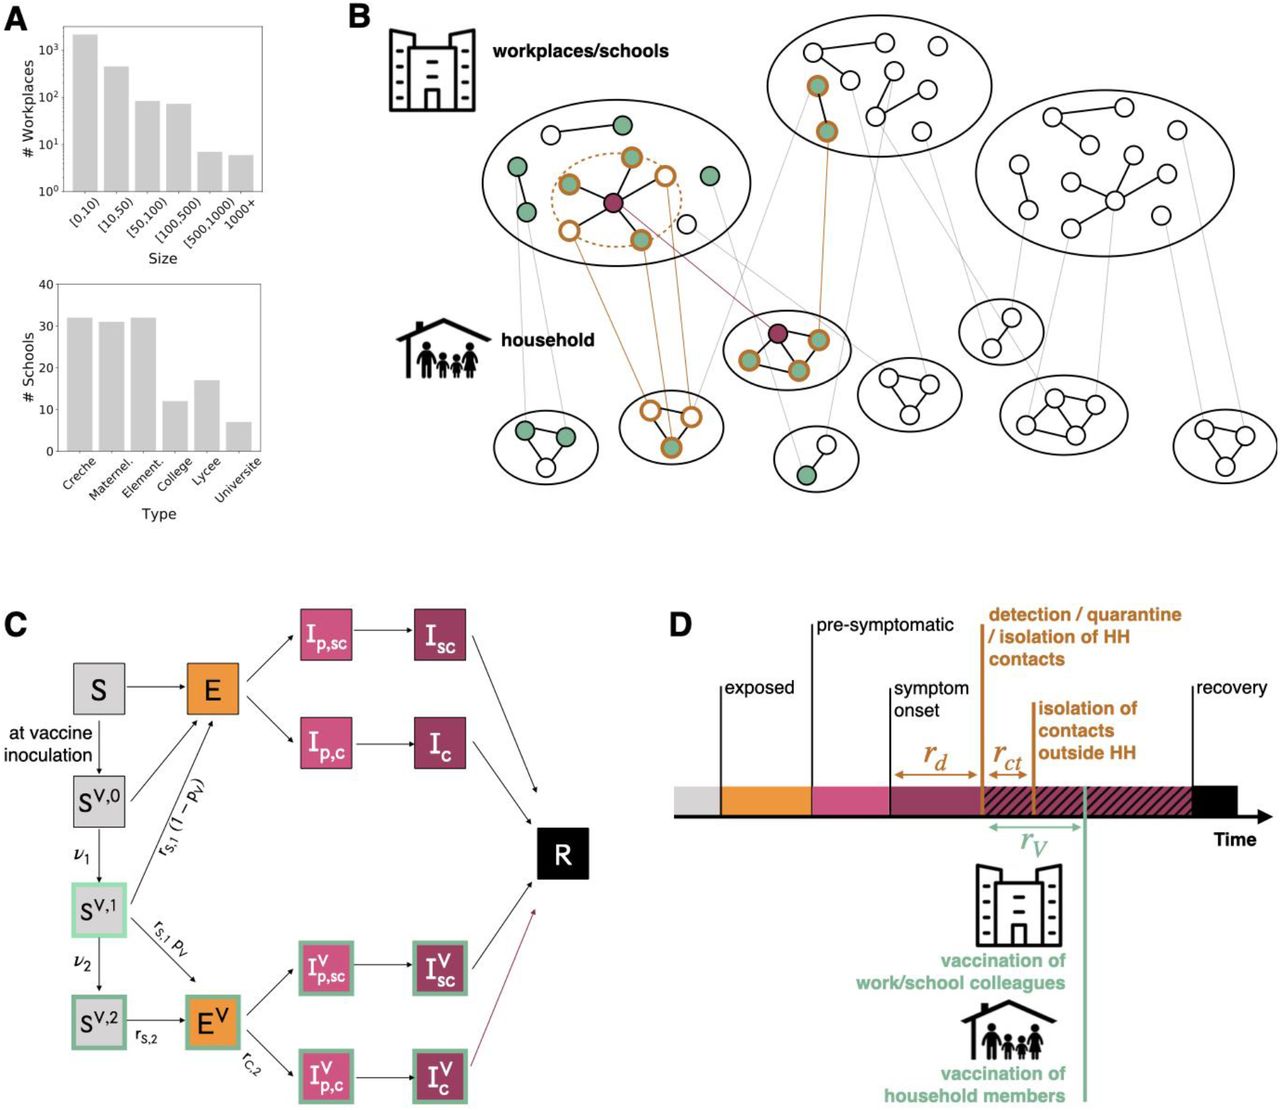
A Distribution of workplace size and of school type for the municipality of Metz (Grand East region, France), used in the simulation study. B Schematic representation of the population structure, the reactive vaccination and contact tracing. The synthetic population is represented as a dynamic multi-layer network, where layers encode contacts in household, workplace, school, community and transport. In the figure, school and workplace layers are collapsed and community and transport are not displayed for the sake of visualisation. Nodes repeatedly appear on both the household and the workplace/school layer. The identification of an infectious individual (in purple in the figure) triggers the detection and isolation of his/her contacts (nodes with orange border) and the vaccination of individuals attending the same workplace/school and belonging to the same household who accept to be vaccinated (green). C Compartmental model of COVID-19 transmission and vaccination. Description of the compartments is reported on the Methods section. D Timeline of events following infection for a case that is detected in a scenario with reactive vaccination. For panels C, D transition rate parameters and their values are described in the Methods and in the Supplementary Information.
We assume that the vaccine reduced susceptibility, quantified by the vaccine efficacy VES, and symptomatic illness after infection, quantified byVESP 17 (Figure 1C). The vaccine-induced protection is described based on the characteristics of mRNA vaccines 18,19 with no protection up to 1 week after inoculation, intermediate protection after 1 week (VES,1 = 52% and VESP,1 = 62%), and maximum protection after 2 weeks (VES,2 = 87% and VESP,2 = 90%).
To parametrise the epidemiological context, we assume 26% 20,21 of the population was fully immune to the virus and the reproductive ratio is R = 1.2, in the range of values estimated during the ascending phase of winter 20-21/spring 2021 epidemic waves 22. We model the baseline TTI policy after the French situation, allowing 3.6 days on average from symptoms onset to detection and 2.8 average contacts detected and isolated per index case 23 (Figure 1 D). We assume that 50% of clinical cases and 10% of subclinical cases are detected. Scenarios with enhanced TTI are described later in the text.
We then model vaccination of 18+ years old population assuming vaccination uptake is bounded above by vaccine acceptance, set to 66% in the 18-65 years old and 90% in the over 65 years old at baseline, based on surveys conducted on the French population 24. When the vaccine is proposed in the context of reactive vaccination, we also consider uptake up to 100%. We model a reactive vaccination strategy, where the detection of a case thanks to TTI triggers the vaccination of household members and those in the same workplace or school (Figure 1D). In this scenario, a delay of 2 days on average is assumed between the detection of the case and vaccination to account for logistical issues - i.e. ∼5.6 days on average from the index case’s symptoms onset. We also model three non-reactive vaccination strategies, i.e. i) where vaccination is deployed randomly throughout the mass vaccination program (mass) or ii) in school sites (school location) or iii) workplaces/universities (workplaces/universities) chosen at random, up to the maximum number of doses available daily. In the school location vaccination, we assume vaccine sites are created in relation with schools to vaccinate pupils and their household members who are above 18 years old. The impact of these strategies is evaluated based on the comparison with a reference scenario, where no vaccination campaign is conducted during the course of the simulation and vaccination coverage remains at its initial level.
Comparison between reactive and non-reactive vaccination strategies
In Figure 2 we compare all strategies, assuming that vaccine uptake is the same in reactive and non-reactive vaccination as reference, and initial vaccination coverage among adults is small, i.e. 13% of the [18,60] group. During the course of the simulation we consider daily first-dose vaccination rates for non-reactive strategies between 85 first doses per 100,000 inhabitants (corresponding to the initial vaccination capacity in France in January/February 2021) and 512 first doses per 100,000 inhabitants (close to highest vaccination capacity values reached in May/June 2021 before it declined in June). Panels A-C show the results for a high incidence scenario, here defined by initial incidence at ∼160 clinical cases weekly per 100,000 inhabitants - close to values registered during the first half of May 2021 in France.

A-D High incidence scenario, with initial weekly incidence of clinical cases ∼160 per 100,000 inhabitants. A Relative reduction (RR) in the attack rate (AR) over the first two months for all strategies as a function of the vaccination pace. RR is computed as (ARref -AR)/ARref where ARref is the AR of the reference scenario, with initial vaccination only. AR is computed from clinical cases. B Incidence of clinical cases with different vaccination strategies. The grey curve indicates the reference scenario. The non-reactive scenarios plotted are obtained with 255 new daily vaccinations per 100,000 inhabitants. In the reactive vaccination the average pace is 247 new daily vaccinations per 100,000 inhabitants. C Number of daily first-dose vaccinations, and workplaces/schools (WP/S in the plot) where vaccines are deployed. D-F Same as A-C for the low incidence scenario with initial incidence of clinical cases 5 per 100,000 inhabitants. In panel E, the vaccination pace is 85 and 46 daily first-dose vaccinations per 100,000 inhabitants for the non-reactive and reactive strategies, respectively. In all cases we assumed the following parameters: R=1.2; Initial immunity 26%; vaccinated at the beginning 81% and 13% for 60+ and <60, respectively; 20% of individuals are doing teleworking and 30% of community contacts are removed. Values are means over 2000 stochastic simulations, error bars in panels A and D are derived from the standard errors of the AR. Error bars in panels B, C, E, F, are not displayed for the sake of visualisation.
Panel A shows the relative reduction in the attack rate after two months as a function of the number of first daily doses, while Figure 2B compares the incidence profiles under different strategies at a similar number of vaccine doses. The mass, school location and workplaces/universities strategies have a similar impact on the epidemic. They lead to a reduction between 3.6% and 4.9% of the attack rate, when 85 first doses per 100,000 inhabitants are administered each day, and between 20% and 22% with 511 per 100,000 inhabitants. Among the three, mass vaccination has the lowest impact. This is because the workplaces/universities and school location strategies target a portion of the population with more contacts - working population, or population living in large households - with a greater potential to transmit the infection. Compared with each of the three strategies, reactive vaccination produces a stronger reduction in cases at equal number of doses in the two-month period, i.e. a reduction of 24.5% with the number of first-dose vaccinations being 247 per 100,000 inhabitants each day on average.
In panel C we show the number of first doses in time and the number of places to vaccinate - as a proxy to the incurred costs of vaccine deployment. The number of daily inoculated doses is initially high, with 1112 doses per 100,000 inhabitants used in a day at the peak of vaccine demand, but declines rapidly afterwards down to 86 doses. More than 10 workplaces/schools (0.3% of workplaces and eligible schools of the municipality considered) would need to be vaccinated each day at the peak of vaccine demand.
In Figure 2 D-F we consider a low incidence scenario, i.e. 5 clinical cases weekly per 100,000 inhabitants. In this scenario, reactive vaccination yields a relative reduction in the attack rate that is twice the one produced by the workplaces/universities strategy with 85 daily doses per 100,000 inhabitants, but only using 46 daily doses per 100,000 on average in the two-months period. The deployment of vaccines and the number of workplaces/schools to vaccinate is initially low and increases gradually with incidence.
We have considered so far specific scenarios in terms of epidemiological and vaccine parameters. In the Supplementary Information we explore alternative values of key parameters, e.g. initial incidence, transmission, immunity level of the population, fraction of adults initially vaccinated, reduction in contacts due to social distancing, vaccine efficacy and time needed for the vaccine to become effective. In particular, we explore a reduction in vaccine efficacy of 30% and a longer time needed for the vaccine protection to mount - parameterized according to 25. In varying these parameters, the overall effectiveness of vaccination, regardless of the strategy, changes. However, reactive vaccination remains in all cases the most effective strategy when the comparison is done at equal number of doses. We also tested the robustness of our results according to the selected health outcome, using hospitalisations, ICU admissions, ICU bed occupancy, deaths, life-years lost and quality-adjusted life-years lost, finding the same qualitative behaviour.
Combined reactive and mass vaccination for managing sustained COVID-19 spread
With high availability of vaccine doses, reactive vaccination could be deployed on top of mass vaccination. We consider first the high incidence scenario defined in the previous section and compare mass and reactive vaccination simultaneously (combined strategy) with mass vaccination alone. We focus on the first two months since the implementation of the vaccination strategy. At an equal number of doses within the period, the combined strategy outperforms mass vaccination in reducing the attack rate. For instance, the relative reduction in the attack rate would go from 18%, when 448 daily doses per 100,000 inhabitants are deployed for mass vaccination, to 29%, when the same number of doses are used for reactive and mass vaccination combined (Figure 3A).
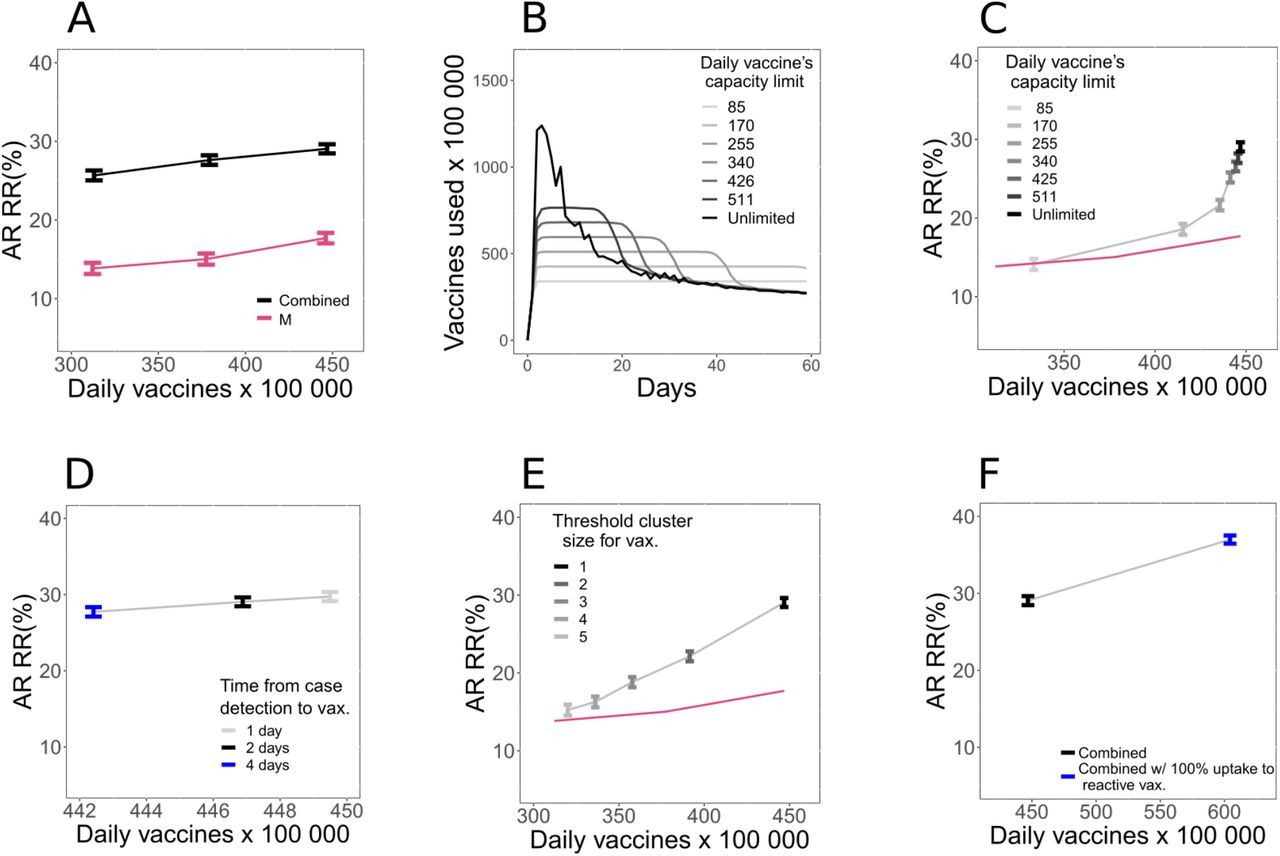
A Relative reduction (RR) in the attack rate (AR) over the first two months for the combined strategy (mass + reactive) and the mass strategy with the same number of first-dose vaccinations as in the combined strategy during the period. RR is computed with respect to the reference scenario with initial vaccination only, as in Figure 2. Combined strategy is obtained by running in parallel the mass strategy - with 81, 170, and 255 daily vaccination rate per 100,000 inhabitants - and the reactive strategy. Number of doses displayed in the x-axis of the figure is the total number of doses used by the combined strategy. Corresponding incidence curves are reported in Figure S6 of Supplementary Information. B Number of first-dose vaccinations deployed each day for the combined strategy with different daily vaccines’ capacity limits. C, D, E AR RR for the combined strategy as a function of the average daily number of first-dose vaccinations in the two-month period. Symbols of different colours indicate: (C) different values of daily vaccines’ capacity limit; (D) different time from case detection to vaccine deployment; (E) different threshold size for the cluster to trigger vaccination. In panel C and E the curve corresponding to mass vaccination (the same one as in panel A) is also plotted as a guide to the eye. F Comparison between 100% and baseline vaccination uptake in case of reactive vaccination. In all cases we assumed the following parameters: R=1.2; Initial immunity 26%; vaccinated at the beginning 81% and 13% for 60+ and <60, respectively; 20% of individuals are doing teleworking and 30% of community contacts are removed. Values are means over 2000 stochastic simulations, error bars are derived from the standard errors of the AR.
We explore alternative scenarios where the number of vaccines used and places vaccinated are limited due to availability and logistic constraints. We assess the effect of three parameters: (i) the maximum daily number of vaccines that can be allocated towards reactive vaccination (with caps going from 85 to 512 per 100,000 inhabitants, compared with unlimited vaccine availability assumed in the baseline scenario), (ii) the time from the detection of a case and the vaccine deployment (set to 2 days in the baseline scenario, and here explored between 1 and 4 days), and (iii) the number of detected cases that triggers vaccination in a place (from 2 to 5 cases, vs. the baseline value of 1).The number of first-dose vaccinations in time under the different caps is plotted in Figure 3B. A small cap on the number of doses limits the impact of the reactive strategy. Figure 3C shows that the attack rate relative reduction drops from 21% to 8.2% if only a maximum of 85 first doses per 100,000 inhabitants daily can be used in reactive vaccination. However, the inclusion of reactive vaccination is beneficial (i.e. RR is above the mass strategy only with a similar number of doses) as soon as the cap in the number of doses is higher than 85 per 100,000 inhabitants. Doubling the time required to start reactive vaccination, from 2 days to 4 days, has a limited effect on the reduction of the AR (relative reduction reduced from 29% to 27%, Figure 3D). Increasing the number of detected cases used to trigger vaccination to 2 (respectively 5) reduces the relative reduction to 22% (respectively 15%) (Figure 3E).
We so far assumed that vaccine uptake is the same in mass and reactive vaccination. In Figure 3F we consider a scenario where vaccine uptake with reactive vaccination climbs to 100%. Attack rate relative reduction increases in this case from 29% to 37%, with a demand of 604 daily doses per 100,000 inhabitants on average.
Combined reactive and mass vaccination for managing a COVID-19 flare-up
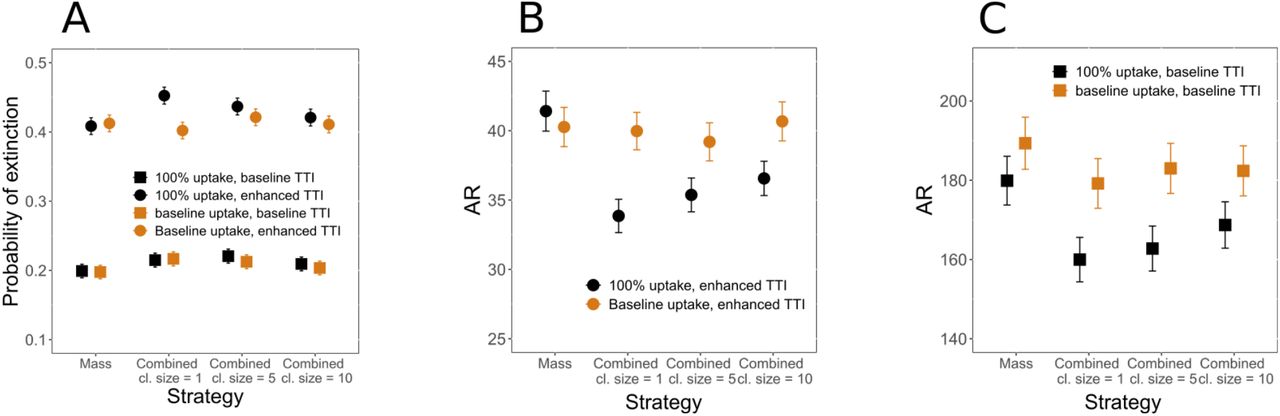
We then quantify the impact of reactive vaccination on the management of a flare-up of cases, as possibly implemented upon detection of a new viral variant in the territory. We consider here a higher vaccination coverage among adults at the beginning (i.e. 33% of [18,60]) and no teleworking and social restrictions, similarly to what was observed in June 2021. A mass vaccination campaign with 512 first doses per day per 100,000 inhabitants is underway from the start and baseline TTI is in place prior to cases’ introduction. To start a simulation, three infectious individuals are introduced in the population where the virus variant is not currently circulating. Upon detection of the first case, we assume that TTI is enhanced, finding 100% of clinical cases, 50% of subclinical cases and three times more contacts outside the household with 100% compliance to isolation (Table S4 of the Supplementary Information) - the scenario without TTI enhancement is also explored for comparison. As soon as the number of detected cases reaches a predefined threshold, reactive vaccination is started on top of the mass vaccination campaign. We assume vaccine uptake increases to 100% for reactive vaccination but stays at its baseline value for other approaches. In Figure 4A, B, C we quantify the probability of extinction and the average attack rate. We compare the combined scenario with mass vaccination alone at an equal number of doses, and we investigate starting the reactive vaccination after 1, 5 or 10 detected cases.

A Probability of extinction for an outbreak starting with three cases according to the measure implemented. Four vaccination strategies are compared: mass only, combined where the reactive vaccination starts at the detection of 1, 5, 10 cases (Combined cl. size= 1, 5, 10 in the figure). Four scenarios are compared, considering both baseline and 100% uptake for reactive vaccination, and both baseline and enhanced TTI after the detection of the first case. Probability of extinction is computed from the fraction of runs for which the epidemic reaches extinction (no active infections) within the first two months after the first detected case. Error bars are computed assuming the probability of extinction follows a binomial distribution. For mass vaccination the number of first-dose vaccinations during the period is the same as in the combined cl. size=1 of the same scenario. B Average attack rate two months after first detected case for the enhanced TTI scenario. C Average attack rate two months after first detected case for the baseline TTI scenario. In panel B and C error bars are the standard error from 8000 stochastic realisations. In all panels we assume the following parameters: R=1.2; Initial immunity 26%; 81% and 33% for 60+ and <60 already vaccinated at the beginning, respectively; no reduction in contacts due to social distancing or teleworking. Corresponding incidence curves are reported in Figure S7 of Supplementary Information.
With enhanced TTI and 100% uptake for reactive vaccination starting from the first detected case, the probability of extinction would increase (from 0.41 to 0.45) and the attack rate decrease (from 41 to 34 cases per 100 000 inhabitants), compared with the mass scenario. The added value of reactive vaccination would decrease if more detected cases are required to start the intervention. We consider a similar level of uptake for reactive vaccination and mass vaccination, finding no advantage of reactive vaccination in this case. Assuming no enhancement in TTI occurs after the detection of the first case, we find no effect of the reactive vaccination in disease containment, irrespective of the level of vaccination uptake. Instead, the effect of the strategy on the reduction in attack rate is qualitatively similar to the enhanced TTI case.
Discussion
As of July 2021, social distancing and NPI intervention started to be lifted in many Western countries owing to the decrease in COVID-19 incidence and increase in vaccination coverage. However, cases have recently started to rise again, due to the more transmissible Delta variant. Under these circumstances the prospects for getting back to normal are becoming short-lived 1,26–30. More transmissible viruses call for vaccination of a larger proportion of the population. Vaccination must be made more accessible and able to adapt to a rapidly evolving epidemic situation 6. In this context, we have here analysed the reactive vaccination of workplaces, universities and schools to assess its potential role in managing the epidemic.
We presented an agent-based model that accounts for the key factors affecting the effectiveness of reactive vaccination: disease natural history, vaccine characteristic, individual contact behaviour, social distancing interventions in place and logistic constraints. Model results suggest that: First, reactive vaccination would have a stronger impact on the COVID-19 epidemic than non-reactive vaccination strategies, when the comparison is done at equal number of doses within the two months. Second, combining reactive and mass vaccination would be more effective than mass vaccination alone in both mitigating the sustained spread and containing a flare-up in a context of diffusion of an emerging variant of concern (VOC). Third, for the reactive strategy to be effective, vaccines should be administered quickly - i.e. right after the detection of the first case. In addition, when the goal is to contain a flare-up, reactive vaccination should be combined with enhanced TTI.
Reactive vaccination has been studied for smallpox, cholera and measles, among others 7– 9,31,32. Hotspot vaccination was found to help in cholera outbreak response by both modelling studies and outbreak investigation 32,33. It may target geographic areas defined at spatial resolution as diverse as districts within a country, or neighbourhoods within a city, according to the situation. For Ebola and smallpox ring vaccination was successfully adopted to accelerate epidemic containment 7–9. For these infections, vaccine-induced immunity mounts rapidly compared to the incubation period and contacts of an index case can be found before they start transmitting since pre-symptomatic and asymptomatic transmission is almost absent. Ring vaccination is also likely effective when the vaccine has post-exposure effects10 - e.g. hepatitis A, B, measles, rabies and smallpox. Reactive vaccination of schools and university campuses has been implemented in the past to contain outbreaks of meningitis 34 and measles 35,36.
For COVID-19, the use of reactive vaccination has been reported in Ontario, the UK, Germany, France, among others 6,37–42. In these places, vaccines were directed to communities, neighbourhoods or building complexes with a large number of infections or presenting epidemic clusters or surge of cases due to virus variants. The goal of these campaigns was to minimise the spread of the virus, but it also addressed inequalities in access and increased fairness, since a surge of cases may happen where people have difficulty in isolating due to poverty and house crowding 43. In France, reactive vaccination was implemented to contain the emergence of variants of concerns in the municipalities of Bordeaux, Strasbourg and Brest 40–42. In the municipality of Strasbourg, vaccination slots dedicated to students were created following the identification of a Delta cluster in an art school 40. Despite the interest in the strategy and its inclusion in the COVID-19 response plans, very limited work has been done so far to quantify its effectiveness 44,45. A modelling study on ring-vaccination suggested that the strategy could be valuable if the vaccine has post-exposure efficacy and a large proportion of contacts could be identified 45. Still, post-exposure effects of the vaccine remain currently under-investigated, 46 and it is likely that the vaccination of the first ring of contacts alone would bring little benefit. We have here tested reactive vaccination of workplaces and schools, since focusing on these settings may be an efficient way to easily reach an extended group of contacts. Workplaces have been found to be an important setting for COVID-19 transmission, especially specific workplaces where conditions are more favourable for spreading 47,48. University settings also cover a central role in the COVID-19 transmission, due to the higher number of contacts among students, particularly if sharing common spaces in residence accommodations 49. Model results show that reactive vaccination of these settings could have a stronger impact than simply reinforcing vaccination as in hotspot strategies.
However, the feasibility and advantage of the inclusion of reactive vaccination imply a trade-off between epidemic intensity and logistic constraints. At a high incidence level, combining reactive and mass vaccination would substantially decrease the attack rate compared to mass vaccination for the same number of doses, but the large initial demand in vaccines may exceed the available stockpiles. Even with large enough stockpiles, issues like the timely deployment of additional personnel in mobile vaccine units and the need to quickly inform the population by communication campaigns must be solved to guarantee the success of the campaign. We explored with the model the key variables that would impact the strategy effectiveness. Delaying the deployment of vaccines in workplaces/schools upon the detection of a case (from 2 to 4 days on average) would not have a strong impact on its effectiveness - relative reduction going from 29% to 27% in Figure 3D. However, vaccines should be deployed at the detection of the first case to avoid substantially limiting the impact of the strategy - e.g. the relative reduction goes from 29% to 15% when workplaces/schools are vaccinated at the detection of 5 cases (Figure 3E). At a low incidence level, the reactive strategy would require a few extra doses in a few workplaces/schools, but the advantage with respect to mass vaccination is overall reduced in this case.
Parameters that could greatly impact the effectiveness of reactive vaccination in containing a flare-up of a new variant have been explored. We found that an early start of the reactive vaccination campaign since the detection of the first VOC case was required. This requires that tests for the detection of variants must be carried out quickly and with large coverage. In France genomic surveillance has ramped up since the emergence of the Alpha variant in late 2020, with nationwide surveys every two weeks involving the full genome sequencing of randomly selected positive samples 50. Approximately 50% of positive tests are also screened for key mutations to monitor the circulation of variants registered as VOC or VUI 50. While these volumes of screening may be regarded as sufficient to quickly identify the presence of variants, the quick rising of large clusters of cases is possible, notably due to super spreading events, becoming increasingly frequent as social restrictions relax. Second, reactive vaccination must be part of a wider response plan, including notably a strong intensification of TTI 51. Rapid and efficient TTI increases the chance of epidemic containment on its own, but it is also instrumental to the success of reactive vaccination as it allows triggering vaccination in households, workplaces and schools. Third, an increased level of vaccine uptake is essential for reactive vaccination to be of interest. Only 66% of the [18,65] years-old population declared to be willing to get the vaccine in the last periodic survey by Public Health France 23. Upward trends in vaccine uptake have been observed as the vaccination campaign unfolds, thanks to the incentives by public health authorities, the communication effort and the strong evidence regarding vaccine efficacy. Yet, at the time of writing only ∼66% of 18+ years old had received at least one dose 22. As the proportion of people who declare to refuse the COVID-19 vaccine is between 10% and 15% in France,52 one could hope that a large proportion of people who did not get the vaccine already would accept it if it was more accessible, had a benefit to vaccination or received an incentive to vaccinate. An increase in vaccine uptake was indeed observed in the context of a reactive vaccination campaign during the course of a measles outbreak 5.Therefore reactive vaccination could be an important way to improve access to vaccination - especially for the hard-to-reach population - and potentially increase acceptability, e.g. due to risk perception.
The study is affected by several limitations. First, the synthetic population used in the study accounts for the repartition of contacts across workplaces, schools, households, etc., informed by contact surveys. However, numbers of contacts and risk of transmission could vary greatly according to the kind of occupation. The synthetic population accounts for this variability assuming that the average number of contacts from one workplace to another is gamma distributed 12. Still, no data were available to inform the model in this respect. Second, we model vaccination uptake according to age only, when it is determined by several sociodemographic factors. Clusters of vaccine hesitant individuals may play an important role in the dynamics and facilitate the epidemic persistence in the population, as it is described for measles 53. As vaccination coverage increases, heterogeneities in attitude toward vaccination will likely have an increasing impact. Third, the baseline analysis is based on vaccine efficacy parameters for the wild type virus that is best documented. Vaccine protection may be reduced or require more time to establish with VOC infection. For example, vaccine protection was lower for the Delta variant than for the historical variant, especially in those who had received only one dose 54–56. Scenarios with slower rise of vaccine protection - parametrised from 25 - and 30% reduced efficacy against infection were tested in the sensitivity analysis. Simulation shows a more limited impact of vaccination in this case, regardless of the strategy, but the benefit of reactive vaccination with respect to non-reactive vaccination remains, although reduced. Updated analyses should be done once more precise vaccine efficacy parameters are available.
Methods
Synthetic population
We use a synthetic population for a French municipality based on the National Institute of Statistics and Economic Studies (INSEE) censuses and French contact survey information 12,57. This includes the following input files: i) a setting-specific, time-varying network of daily face-to-face contacts; ii) the maps between individuals and their age, iii) between individuals and the household they belong to, iv) between individuals and their school, v) and between individuals and their workplace. The synthetic population has age pyramid, household composition, number of workplaces by size, and number of schools by type, reproducing INSEE statistics. Daily face-to-face contacts among individuals are labelled according to the setting in which they occur (either household, workplace, school, community or transport) and they have assigned a daily frequency of activation, to explicitly model recurrent and sporadic contacts. We consider the municipality of Metz in the Grand Est region, which has 117,492 inhabitants, 131 schools (from kindergarten to University) and 2888 workplaces (Figure 1A). Detailed description of how the population was generated is provided in 12. Information about how to access population files is provided in the Data availability section.
Overview of the model
The model is written in C/C++, and is stochastic and discrete-time. It accounts for the following components: (i) teleworking and social distancing, (ii) COVID-19 transmission, accounting for the effect of the vaccine; (iii) test-trace-isolate; (iv) vaccine deployment. Model output includes time series of incidence (clinical and subclinical cases), detailed information on infected cases (time of infection, age, vaccination status), vaccines administered according to the strategy, number of workplaces where vaccines are deployed. Different epidemic scenarios are explored and compared. In the Supplementary Information we also analyse hospitalisation entries, deaths, ICU entries, life-year lost, quality-adjusted life-year, hospital bed and ICU bed occupancy. These quantities are computed by postprocessing output files containing the detailed information on infected cases.
Teleworking and social distancing
To model social distancing, we assume a proportion of nodes are absent from work, modelled by erasing working contacts and transport contacts of these nodes. We also remove a proportion of contacts from the community layer to account for reduction in social encounters due to closure of restaurants and other leisure activities. We choose plausible reduction values in the range reported by google mobility reports 58 during the first half of 2021 in France. Specifically, we set the reduction of contacts in the community to 30% within the range of the mobility reduction in places of retail and recreation (between ∼50% to ∼5%) measured from January to June 2021, and the fraction of teleworkers to 20% within the ballpark of reduction values registered for workplaces in the same period - in general between ∼35% to ∼10%. Telework and social distancing is implemented at the beginning of the simulation and remains constant for the duration of the simulation. Scenarios with no reduction in contacts are also considered.
COVID-19 transmission model
Transmission model is an extension of the model in 12 (see Figure 1D). This accounts for heterogeneous susceptibility and severity across age groups 59,60, the presence of an exposed and a pre-symptomatic stage 11, and two different levels of infection outcome - subclinical, corresponding to asymptomatic infection and pauci-symptomatic, and clinical, corresponding to moderate to critical infection 59,61. Precisely, susceptible individuals, if in contact with infectious ones, may get infected and enter the exposed compartment (E). After an average latency period ∈−1 they become infectious, developing a subclinical infection (Isc) with age-dependent probability  and a clinical infection (Ic) otherwise. From E, before entering either Isc or Ic, individuals enter first a prodromal phase (either Ip,sc or Ip,c), that lasts on average
  days. Compared to Ip,c and Ic individuals, individuals in the Ip,sc and Isc compartments have reduced transmissibility rescaled by a factor βI. With rate μ infected individuals become recovered. Age-dependent susceptibility and age-dependant probability of clinical symptoms are parametrised from 59. In addition, transmission depends on setting as in 12. Parameters are summarised in Table S1 of the Supplementary Information.
We model vaccination with a leaky vaccine, partially reducing both the risk of infection (i.e. reduction in susceptibility, VES) and infection-confirmed symptomatic illness (VESP) 17. Level of protection increases progressively after the inoculation of the first dose. In our model we did not explicitly account for the two-dose administration, but we accounted for two levels of protection – e.g. a first one approximately in between of the two doses and a second one after the second dose. Vaccine efficacy was zero immediately after inoculation, mounting then to an intermediate level (VES,1 and VESP,1) and a maximum level later (VES,2 and VESP,2). This is represented through the compartmental model in Figure 1C. Upon administering the first dose, S individuals become, SV,0, i.e. individuals that are vaccinated, but have no vaccine protection. If they do not become infected, they enter the stage SV,1 at rate ν1, where they are partially protected, then stage SV,2 at rate ν2 where vaccine protection is maximum. SV,1 and SV,2 individuals have reduced probability of getting infected by a factor rS,1 = (1 − VES,1) and rS,2 = (1 − VES,2), respectively. In case of infection, SV,2 individuals progress first to exposed vaccinated (EV), then to either preclinical or pre-subclinical vaccinated ( or
or  ) that are followed by clinical and subclinical vaccinated respectively (
 or
or  ). Probability of becoming
  from EV is reduced of a factor rc,2 = (1 − VESP,2)(1 − VES,2) −1. For the SV,1 individuals that get infected we assume a polarised vaccine effect, i.e. they can enter either in EV, with probability pV, or in E (Figure 1D). The value of pV can be set based on VESP,1 through the relation (1 − VESP,1) = (1 − VES,1)(pV rc,2 + (1 − pV)).
Under the assumption that no serological/virological/antigenic test is done before vaccine administration, the vaccine is administered to all individuals, except for clinical cases who show clear signs of the disease or individuals that were detected as infected by the TTI in place. In our model a vaccine administered to infected or recovered individuals has no effect.
In the baseline scenario we parametrise VESP,1and VESP,2 based on the vaccine efficacies estimated in clinical trials 18,19. We then set and VES,1 and VES,2 by keeping the same ratio estimated in 25. In the sensitivity analysis we assume a more conservative hypothesis, by calibrating the model entirely from 25. We also explore a reduction of 30% in VES,1 and VES,2. Parameters are listed in Table S2 of the Supplementary Information.
Test-trace-isolate
We model a baseline TTI as regularly, in place in France, accounting for case detection, household isolation and manual contact tracing. Fifty percent of individuals with clinical symptoms were assumed to get tested and to isolate if positive. We assume an exponentially distributed delay from symptoms onset to case detection and its isolation with 3.6 days on average. Once a case is detected, his/her household members isolate with probability  , while other contacts isolate with probabilities
  and
and  , for acquaintances and sporadic contacts, respectively. In addition to the detection of clinical cases, we assumed that a proportion of subclinical cases were also identified (10%). Isolated individuals resume normal daily life after 10 days unless they still have clinical symptoms after the time has passed. They may, however, decide to drop out from isolation each day with a probability of 13% if they do not have symptoms 62.
In the scenario of virus re-introduction, we consider enhanced TTI, corresponding to a situation of case investigation, screening campaign and sensibilisation (prompting higher compliance to isolation). We assume a higher detection of clinical and subclinical cases (100% and 50% respectively), perfect compliance to isolation by the index case and household members and a three-fold increase in contacts identified outside the household.
Step-by-step description of contact tracing is provided in the Supplementary Information. Parameters for baseline TTI are provided in Table S3, while parameters for enhanced TTI are provided in Table S4.
Vaccination strategies
A vaccine opinion (willingness or not to vaccinate) is stochastically assigned to each individual at the beginning of the simulation depending on age (below/above 65). Opinion does not change during the simulation. In some scenarios we assume that all individuals are willing to accept the vaccine in case of reactive vaccination, while maintaining the opinion originally assigned to them when the vaccine is proposed in the context of non-reactive vaccination. Only individuals above a threshold age, ath,V = 18 years old, are vaccinated. We assume that a certain fraction of individuals is vaccinated at the beginning of the simulation according to the age group ([18,60], 60+). We compare the following vaccination strategies:
Mass
Vdaily randomly selected individuals are vaccinated each day until a Vtot limit is reached.
Workplaces/universities
Random workplaces/universities are selected each day. All individuals belonging to the place, willing to be vaccinated, and not isolated at home that day are vaccinated. Individuals in workplaces/universities are vaccinated each day until the daily limit, Vdaily is reached. No more than Vtot individuals are vaccinated during the course of the simulation. We assume that only workplaces with sizeth = 20 employees or larger implement vaccination.
School location
Random schools, other than universities, are selected each day and a vaccination campaign is conducted in the places open to all adult household members of school students. All household members willing to be vaccinated, above the threshold age and not isolated at home that day are vaccinated. No more than Vdaily individuals are vaccinated each day and no more than Vtot individuals are vaccinated during the course of the simulation.
Reactive
When a case is detected, vaccination is done in her/his household with rate rV. When a cluster – i.e. at least ncl cases detected within a time window of length Tcl – is detected in a workplace/school, vaccination is done in that place with rate rV. In the baseline scenario, we assume vaccination in workplace/school to be triggered by one single infected individual (ncl = 1). In both household and workplace/school, all individuals belonging to the place above the threshold age and willing to be vaccinated are vaccinated. Individuals that were already detected and isolated at home are not vaccinated. No more than Vdaily individuals are vaccinated each day and no more than Vtot individuals are vaccinated during the course of the simulation. In the baseline scenario these quantities are unlimited, i.e. all individuals to be vaccinated in the context of reactive vaccination are vaccinated.
Parameters and their values are summarised in Table S5 of the Supplementary Information.
Data Availability
Code and input files of the study are posted on the github repository
Data availability
The synthetic population used in the analysis is available on github 63.
Code availability
We provide all C/C++ code files of the model on github 63.
Supplementary Information
Additional Methods
COVID-19 transmission model
We provide here in the following the parameter values for transmission and infection natural history (Table S1), and the effect of vaccination (Table S2). For a detailed explanation of the transmission model without vaccination we refer to 1.
Test-trace-isolate
We model case detection and isolation, combined with tracing and isolation of contacts according to the following rules:
As an individual shows clinical symptoms, s/he is detected with probability pd,c. If detected, case confirmation and isolation occur with rate rd upon symptoms onset.
Subclinical individuals are also detected with probability pd,sc, and rate rd.
The index case’s household contacts are isolated, with probability pct,HH, the same time the index case is detected and isolated. We assume that these contacts are tested at the time of isolation and among those all subclinical, clinical, pre-subclinical, and pre-clinical cases are detected (testing sensitivity 100%).
Once the index case is detected, contacts of the index case occurring outside the household are traced and isolated with an average delay
 . We define an acquaintance as a contact occurring frequently, i.e. with a frequency of activation higher than fa. We assume that an acquaintance is detected and isolated with a probability pct,A, while other contacts (i.e. sporadic contacts) are detected and isolated with probability pct,sp, with pct A > pct,sp. We assume that traced contacts are tested at the time of isolation and among those all subclinical, clinical, pre-subclinical, and pre-clinical cases are detected (testing sensitivity 100%).
Only contacts (among contacts occurring both in household and outside) occurring within a window of D days before index case detection are considered for contact tracing.
The index-case and the contacts are isolated for a duration dI (for all infected compartments) and dNI (for susceptible and recovered compartments). Contacts with no clinical symptoms have a daily probability pdrop to drop out from isolation.
For both the case and the contacts, isolation is implemented by assuming no contacts outside the household and transmission risk per contact within a household reduced by a factor ι.

Parameter values are reported in Table S3 and Table S4 for baseline and enhanced TTI, respectively.
Vaccination strategies
We provide here in the following the parameters values for the vaccination strategies detailed in the Methods section of the main paper.
Details on the epidemic simulations
A schematic representation of the main program and of the simulation code and of the algorithm used for a single stochastic realisation are shown in Figure S1 and S2, respectively. Simulations are discrete-time and stochastic. At each time step, corresponding to one day, three processes occur (Figure S2):
vacciantionStep
vaccines are administered according to the strategy or the strategies’ combination.
testingStep
cases are detected and isolated; contacts (within and outside household) are identified and isolated; isolated individuals get out from isolation.
transmissionStep
infectious status of nodes is updated. This includes transmission, recovery and transition through the different stages of the infection (e.g. from exposed to pre-symptomatic, from pre-symptomatic to symptomatic)
A single-run simulation is executed with no modelled intervention, until the desired immunity level is reached. This guarantees that immune individuals are realistically clustered on the network. We added some noise, by reshuffling the immune/susceptible status of 30% of the nodes to account for travelling, infection reintroduction from other locations and large gathering with consequent super-spreading not accounted for by the model. In Figure 2 and 3 of the main paper, all processes (transmission, TTI, vaccination) are simulated from the beginning of the simulation. In the scenario with virus re-introduction (Figure 4), TTI and mass vaccination are modelled from the beginning. TTI is enhanced from the detection of the first case. Reactive vaccination starts after the detection of the first nRVcases, with nRV = 1,5,10 explored.
We vary COVID-19 transmission potential by tuning the daily transmission rate per contact β. The reproductive number R is computed numerically as the average number of infections each infected individual generates throughout its infectious period at the beginning of the simulation. We tune β to have the desired R value (1.2 for the analysis in the main text) for the reference scenario - i.e. with only vaccination at the start. We then compare different vaccination strategies at the same value of transmissibility β.
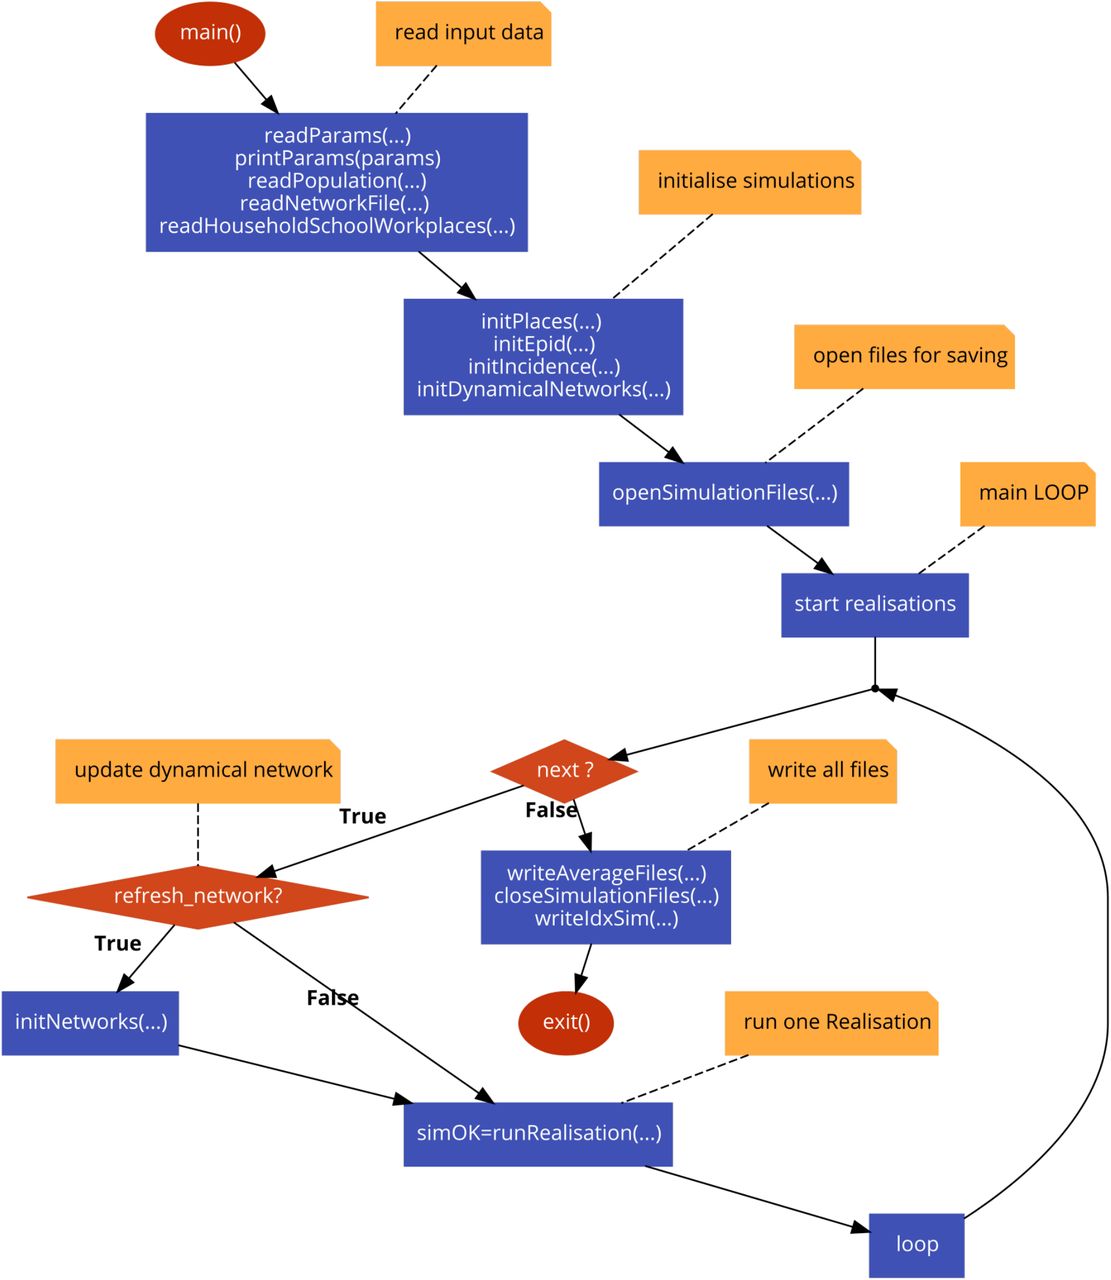
Algorithm of the main program. (drawn with code2flow.com)

Algorithm for one stochastic realisation. (drawn with code2flow.com)
Additional Results
Comparison between reactive and non-reactive vaccination strategies: sensitivity analysis
We compare here reactive vaccination with non-reactive vaccination strategies under a variety of epidemic scenarios.
The impact of reactive vaccination and its demand in terms of vaccine doses varies depending on the incidence level. Figure S3 compares reactive and workplaces/universities vaccination in scenarios with variable initial incidence. As initial incidence increases the reduction in the attack rate due to workplaces/universities vaccination diminishes, while the one due to reactive vaccination slightly increases. Therefore, the advantage of the reactive vaccination compared with the other strategy increases. This is explained by the dynamic adaptation of reactive vaccination to the epidemic situation: the higher the incidence is, the more vaccines are deployed.

Attack rate (AR) relative reduction (RR) after two months according to the initial incidence for reactive and workplaces/universities vaccination with 200 and 500 new vaccinated daily. The size of the points is proportional to the average daily vaccination rate during the period.
Figure S4 shows how the relative reduction of the attack rate after two months changes with transmission, immunity level of the population, fraction of adults initially vaccinated, reduction in contacts due to social distancing, vaccine efficacy and time needed for the vaccine to become effective. Here we consider the high incidence scenario (Figure 2A-C of the main paper) and we compare mass and reactive strategies assuming the same vaccine uptake.
Increasing the transmissibility (panel A) has no significant effect on the efficacy of vaccination for all strategies considered. Panel B and C show that decreasing the initial proportion of susceptible, due to increasing either natural immunity or initial vaccination coverage, reduces the impact of all vaccination strategies. In particular, reactive vaccination has a limited effect when the initial vaccination coverage is high, as the number of people remaining to vaccine is limited. In panel D we explore the impact of teleworking and reduction in community contact by comparing the baseline scenario with a scenario with no restrictions. Impact of non-reactive vaccination strategies remains almost unaltered. However, reactive vaccination becomes more effective when no restriction is in place. This is likely due to the enhanced role of workplaces as a setting of transmission when no teleworking is in place, thus bringing to an increased benefit of reactive vaccination targeting this setting. In panel E, we explore a different hypothesis regarding the effect of vaccination assuming more time for the vaccine protection to mount after inoculation. Specifically, we use the parametrisation of 11, with rS1 = 0.54, rS, = 0.08 and ν1 = ν2 = (14 days)−1. As expected, this change reduces the impact of the vaccination campaign. Still, reactive vaccination outperforms mass vaccination at an equal number of first-dose vaccination. This result remains valid also when assuming a 30% reduction in the vaccine effectiveness in susceptibility with respect to baseline values (panel F).
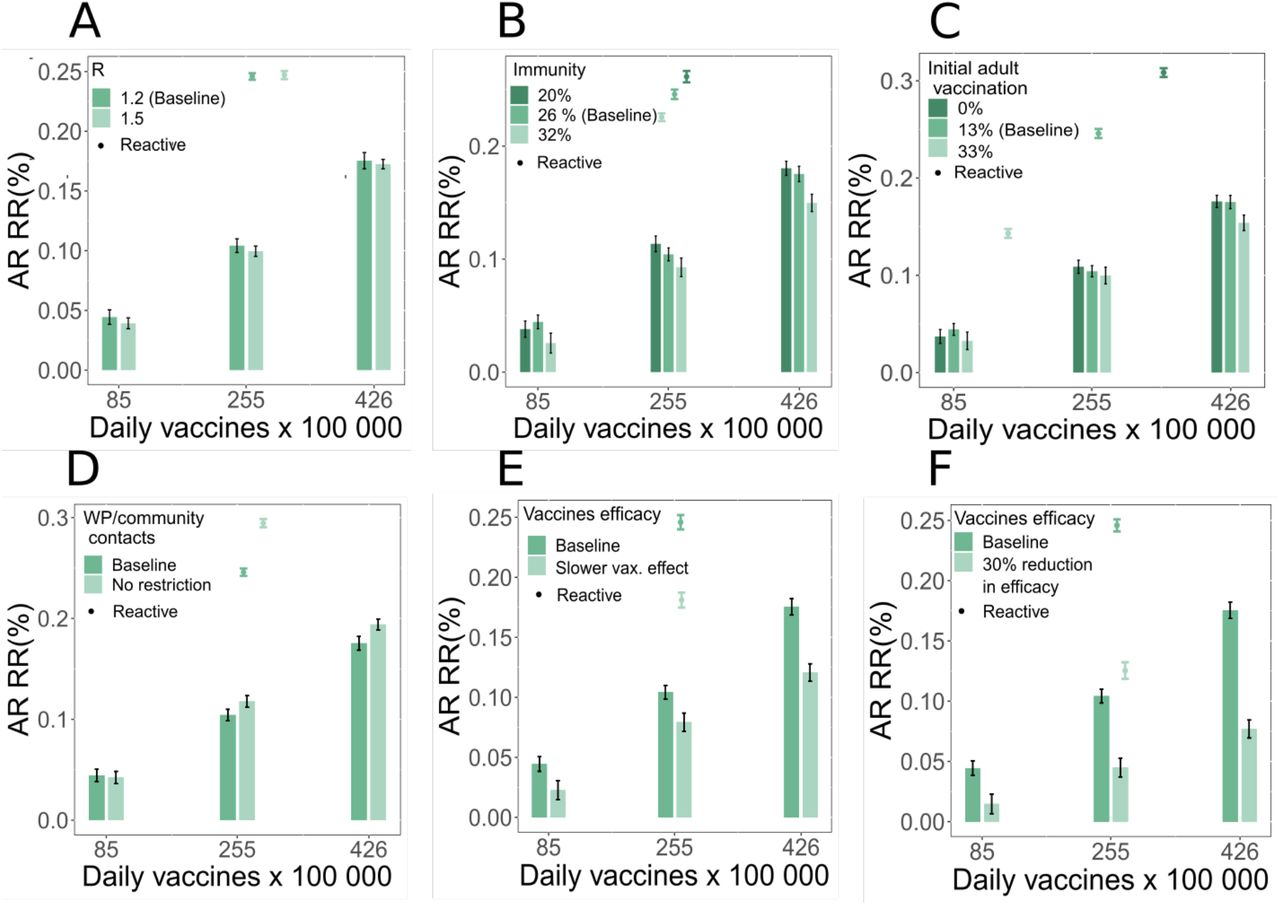
Attack rate (AR) relative reduction (RR) after two months. RR is computed with respect to the reference scenario where only initial vaccination is in place. We consider the high incidence scenario, with initial incidence of clinical cases 160 per 100,000 inhabitants, and we compare the reactive vaccination (points) with the mass vaccination, with 85, 255 and 426 vaccines per 100 000 inhabitants per day (bars). Explored parameters are: the reproduction number (A); initial immunity level (B); initial vaccination coverage among 18-60 y.o. People (C); presence/absence of teleworking and contact restriction in the community (D); time needed for the vaccine to become effective (E), vaccine efficacy in susceptibility (F). Except when otherwise indicated, parameters are the same as in Figure 2A of the main text.
Comparison between reactive and non-reactive vaccination strategies: additional epidemic outcomes
Based on the estimated incidence of clinical cases per day provided by the transmission model, we infer outcomes related to hospital, namely hospital and intensive care unit (ICU) entries, beds in ICU ward, and deaths. We use age-dependent hospital admissions (ICU and non-ICU) risks estimated by 12,13 and ICU admission risks for hospitalised patients based on SI-VIC extract 14. Hospital admissions risks were adjusted to apply only to clinical cases 15 and to account for vaccine efficacy for hospitalisation for no vaccination, after one week from vaccine inoculation, and after two weeks from vaccine inoculation 11. Patients who were hospitalised entered the hospital on average 7 days (sd = 3.9 days – Gamma distribution) after the beginning of the infectious phase 16. Those who were admitted in ICU enter this unit with a mean delay of 1.69 days (assuming an exponential distribution) 14. To estimate the number of occupied beds, we use age-specific mean durations of stay and their corresponding standard deviations in ICU calculated on all the hospitalised cases in the first 9 months of the French epidemic (March-November 2020)14. We assume that the standard deviations of ICU lengths of stay were equal to the corresponding mean and do not consider post-ICU care in the estimation of occupied beds. We estimate the number of deaths using hospital and ICU death risks of hospitalised infected persons 14. Deaths are delayed in time using the mean delays and standard deviations from hospital or ICU admission to death 14. All lengths of stay are supposed to follow a Gamma distribution. Parameters and their values are summarised in Tables S6 and S7.
We also estimate the number of life years and quality-adjusted life years (QALY) lost for each death using life-tables provided by ‘French National Institute of Statistics and Economic Studies’ (INSEE) for 2012-2016 17 and utility measures of each age-group in France 18.
Figure S5 shows the relative reductions in the number of hospitalisations, deaths, ICU entries, life-year lost, quality-adjusted life-year lost and ICU bed occupancy at the peak, comparing each vaccination scenario with the reference scenario - i.e. vaccination only at the start. We consider here the high incidence scenario and vaccination strategies are compared at the same vaccine uptake, analogously to Figure 2A of the main paper. The six indicators show a behaviour similar to incidence. Overall reduction values are smaller. This is expected, since a large proportion of elderly are already vaccinated at the start, and the compared vaccination strategies target a population that is less at risk of severe infection. Still all indicators show the same qualitative behaviour, with reactive vaccination outperforming the non-reactive vaccination strategies at equal number of first-dose vaccination.

A, B, C, D, E Relative reduction (RR) in the cumulative incidence of hospitalisations, intensive care unit (ICU) entries, deaths, life years (LY) lost and quality-adjusted life years (QALY) lost over the first two months for all strategies as a function of the vaccination rhythm. F Relative reduction (RR) in occupied ICU beds at the peak over the first two months for all strategies as a function of the average daily number of new vaccinated for the high incidence scenario. In all cases we assumed the following parameters: R=1.2; Initial immunity 26%; vaccinated at the beginning are 81% and 13% of 60+ and <60, respectively; teleworking 20% and reduction in contacts in the community 30%; initial incidence 160 per 100,000 inhabitants.
Combined reactive and mass vaccination for managing sustained COVID-19 spread: additional results
In Figure S6 we show the incidence curve corresponding to the scenarios analysed in Figure 3A of the main paper. Mass and combined vaccination with the three different vaccination paces are compared.

Incidence of clinical cases for mass and combined vaccination strategies for three different vaccination paces. Scenarios are the same as the ones plotted in Figure 3A. We assumed the following parameters: initial incidence of clinical cases 160 per 100 000 inhabitants; R=1.2; Initial immunity 26%; vaccinated at the beginning are 81% and 13% of 60+ and <60, respectively; teleworking 20% and reduction in contacts in the community 30%. Values are means over 2000 stochastic simulations, error bars are not displayed for the sake of visualisation.
Combined reactive and mass vaccination for managing a COVID-19 flare-up: additional results
In Figure S7 we show the incidence curve corresponding to the scenarios analysed in Figure 4 of the main paper. Mass and combined vaccination with the different vaccination scenarios considered are compared.
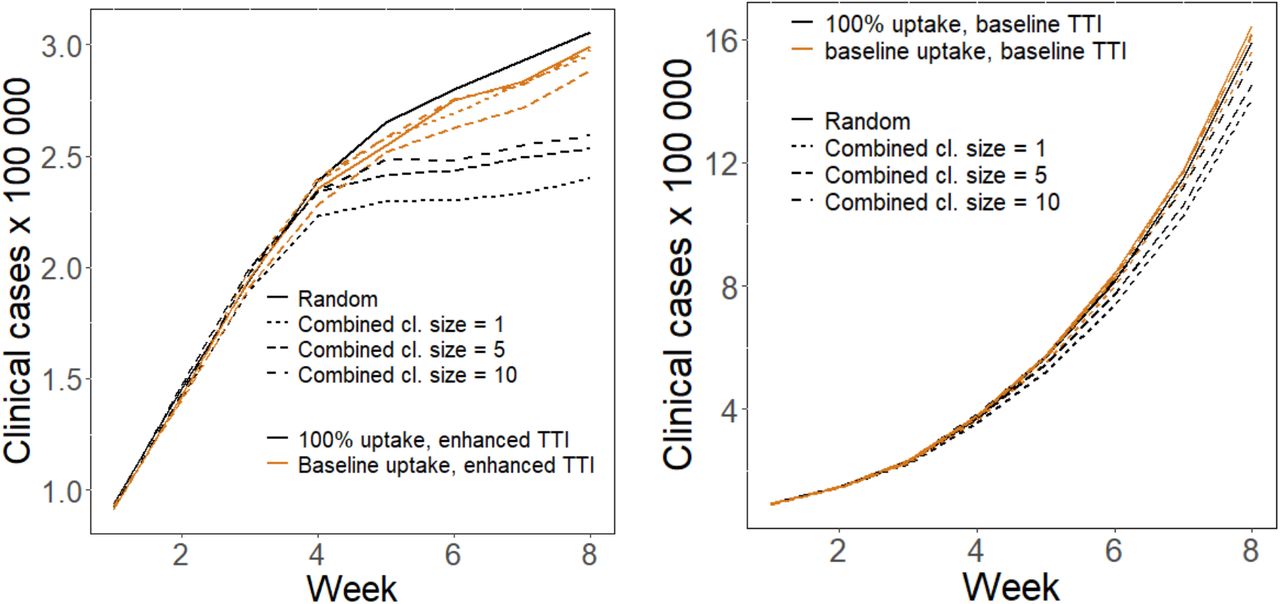
Incidence of clinical cases for mass and combined vaccination strategies for the scenarios analysed in Figure 4 of the main paper. Left: scenario with enhanced TTI. Right: scenario with baseline TTI. In all panels we assumed the following parameters: R=1.2; Initial immunity 26%; 81% and 33% of 60+ and <60 already vaccinated at the beginning, respectively; no reduction in contacts due to social distancing and teleworking. We assume a flare-up of cases with 3 cases initially introduced in the population.
Acknowledgements
We acknowledge financial support from Haute Autorité de Santé; the ANR and Fondation de France through the project NoCOV (00105995); the Municipality of Paris (https://www.paris.fr/) through the programme Emergence(s); EU H2020 grants MOOD (H2020-874850), and RECOVER (H2020-101003589); Institut des Sciences du Calcul et de la Donnée (ISCD).


