
Summary
Background Due to a limited initial supply of COVID-19 vaccines, the prioritisation of individuals for vaccination is of utmost importance for public health. Here, we provide the optimal allocation strategy for COVID-19 vaccines according to age in Japan and South Korea.
Methods Combining national case reports, age-specific contact matrices, and observed periods between each stages of infection (Susceptible-Exposed-Infectious-Quarantined), we constructed a compartmental model. We estimated the age-stratified probability of transmission given contact (qi) using Bayesian inference method and simulated different vaccination scenarios to reduce either case numbers or death toll. We also performed sensitivity analyses on the proportion of asymptomatic cases and vaccine efficacy.
Findings The model inferred age-stratified probability of transmission given contact (qi) showed similar age-dependent increase in Japan and South Korea. Assuming the reported COVID-19 vaccine efficacy, our results indicate that Japan and South Korea need to prioritise individuals aged 20–35 years and individuals aged over 60 years, respectively, to minimise case numbers. To minimise the death toll, both countries need to prioritise individuals aged over 75 years. These trends were not changed by proportions of asymptomatic cases and varying vaccine efficacy on individuals under 20 years.
Interpretation We presented the optimal vaccination strategy for Japan and South Korea. Comparing the results of these countries demonstrates that not only the effective contact rates containing qi but also the age-demographics of current epidemic in Japan (dominance in 20s) and South Korea (dominant cases over 50s) affect vaccine allocation strategy.
Introduction
The pandemic of coronavirus disease 2019 (COVID-19), an infectious disease caused by severe acute respiratory syndrome coronavirus 2 (SARS-CoV-2), is still ongoing in a rapid and a widespread manner. The high transmissibility of SARS-CoV-2 might be attributed to its route of transmission (respiratory) and its viral shedding pattern (peak viral loads at the symptom onset).1,2 These characteristics hinder efficient public health control of COVID-19.
Therefore, COVID-19 vaccines are expected to be a game changer for ending this pandemic. Several promising vaccines are under development or have received emergency use authorisation in many countries including the United Kingdom (UK) and the United States (US).3-5
Vaccine supply, however, is expected to be limited in 2021. As of March 31, 2021, Japan immunized 877,159 individuals (0·7%) and South Korea immunized 852,202 individuals (1·6%) at least the first dose, which are far less proportions than countries in Europe and America.6,7 Determination of who to prioritise for COVID-19 vaccination is an important matter that plays a major role in curbing the growing burden of the disease.
Vaccinating the younger population, who have high contact rates, could lower the total COVID-19 incidence, whereas targeting the elderly, who have high mortality rates, would lower the death toll.8,9 Given the scarcity of vaccines, the World Health Organisation (WHO) recommended to focus initially on direct reduction of mortality, and maintenance of most critical essential workers.10 Likewise, many countries including the European Union, UK, and the US announced interim recommendations in which healthcare personnel, long-term care facility residents, and elderly people with various age cut-offs were prioritised for COVID-19 vaccination.11,12 By contrast, Indonesia plans to vaccinate working young adults before the elderly.13 Indeed, the vaccination strategy could vary in countries, and the optimal allocation strategy could be informed by modelling studies accounting for country-specific characteristics.
Here, we constructed the modified Susceptible-Exposed-Infectious-Quarantine (SEIQ) model, using the observed distributions of the latent period (E → I) and the diagnostic delay (I → Q), along with the transmission onset distribution relative to the symptom onset.14 Bayesian inference with Markov Chain Monte Carlo method was used for parameter estimation of age-stratified force of infection (S → E). By virtue of this realistic compartmental model, the main objective of this study is to determine the optimal administration of COVID-19 vaccines, in both Japan and South Korea, in terms of reduction of (a) total incidence and (b) the death toll.
Methods
Epidemiologic data
The epidemiologic data consisted of COVID-19 reports provided by the Ministry of Health, Labour and Welfare of Japan and the Ministry of Health and Welfare of South Korea.6,7 Both governments report COVID-19 cases by 10-year age interval, diagnosed with SARS-CoV-2 polymerase chain reaction test. We could regard those numbers as real case numbers according to the ascertainment levels close to 100% in Japan and South Korea, given the baseline case-fatality ratio of 1·4%.15 The age-specific mortality ratios were also collected.6,7
Demography and contact matrix
Age-structured population data were obtained from the Statistics Bureau Japan and Statistics Korea.16,17 We introduced contact matrices in our compartmental model, using the contact survey data by Ibuka et al. for Japan, and projected contact matrix by Prem et al. for South Korea.8,18 New contact matrix with 5-year age intervals was established for Japan from diary data that included 4331 respondents using a bootstrap method.18,19
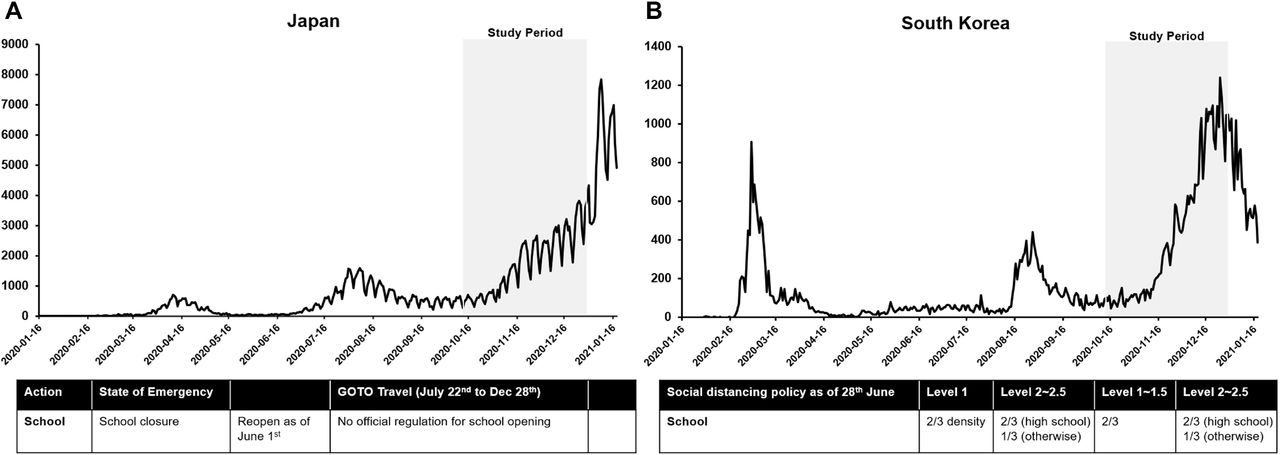
To capture the changes of contact patterns as a result of social distancing measures, we took into account school closure policies and reduced contact rates at both work and other places using Google mobility data.20-22 In Japan, most schools that had been temporarily closed reopened on June 1, 2020, whereas in South Korea, school attendance has been capped at two-thirds during national distancing level 1, one-thirds during level 2 (except for high schools which remained 2/3), and remote learning only during level 3 throughout 2020 (Figure 1).

Transmission model
What we could observe is the age-stratified (10-year interval) incidence of COVID-19. This was made compatible to the contact matrix by dividing the incidence data in 5-year instead of 10-year age groups proportionally to demographic structure. From previous epidemiologic studies, we know the (i) incubation period distribution, (ii) transmission onset distribution relative to symptom onset, and the (iii) delay from symptom onset to diagnosis.14 The (iv) latent period distribution could be derived from both incubation period and transmission onset distribution (Figure 2). In Japan and South Korea, individuals who have been diagnosed with COVID-19 are isolated immediately; thus, the confirmation date could be regarded as the date on which isolation had begun.

For those who eventually developed symptoms (Ipresym* → Isym), we could infer the individual’s symptom onset relative to the diagnosed date using (iii). Then, we could successively infer transmission onset using (ii) and exposure date using (i).
For those who never developed any symptoms (Iasym), accounting for 16% of total infection by a meta-analysis23, we assumed that their (iv) latent period distribution is the same as those who developed symptoms. Also, we regard that the infectious period distribution for Iasym is the same as the total infectiousness period of symptomatic cases as suggested.24 We suppose that the Iasym is quarantined at random during the infectious period, and the relative infectiousness of the Iasym is half of that of the others.24
Then, what is left to estimate is the age-stratified force of infection (S → E). According to Vynnycky and White,25 the force of infection λi experienced by age group i is:
 Here, βij is the rate at which susceptible in the age group i and infectious individuals in the age group j come into effective contact per unit time, and Ij is the number of infectious individuals in the age group j. We further divide βij into:
 Here, qi is the probability that a contact between a susceptible in age group i and an infectious person leads to infection, ϕij is the number of contacts an individual of age group j makes with those of age group i per unit time, and Ni is the number of individuals in age group i. Since we know the contact matrix for Japan and South Korea, we could estimate qi for both the countries. All analyses were conducted using the R statistical software version 3.6.3. Detailed Bayesian inference methods are available in the Supplementary Method. Code and data to reproduce the analyses are available as an R package at https://github.com/Hwichang/COVID-19-Vaccine-Prioritisation.
Japan and South Korea have similar epidemiological trends; (a) the import-driven first wave, (b) domestic origin second wave closely related to nightlife clusters,26,27 and (c) the third wave possibly enhanced by a seasonality factor (Figure 1). We used the third wave mainly for our simulation considering that this period could reflect the real characteristics of SARS-CoV-2 transmission in each country not only excluding the importation factor, but also including the effects of seasonality similar to other respiratory viruses. Thus, the study period was set from October 15th to December 25th, 2020, for Japan prior to the winter vacation, and from October 15th to December 22nd, 2020, for South Korea prior to the “ban of gathering of five or more people”. During the third wave, people in their 20s still constituted most of the confirmed cases in Japan following the second wave, whereas in South Korea, this shifted to those over 50 during the third wave.
Vaccination scenarios
Using the SEIQ model, we could calculate how many cases and deaths would arise without any intervention, including vaccination, after 2 weeks of the study period by means of forward projection. We set this as the baseline scenario and explored how to allocate COVID-19 vaccines according to age groups, with stepwise increase in vaccine supply relative to the population size. Being vaccinated, the susceptible population in each age group would decrease, and our ultimate goal was to find the optimal distribution of vaccines to reduce COVID-19 cases and deaths.
Sensitivity analysis
Among model parameters, proportion of asymptomatic cases and vaccine efficacy were hypothesised values. We thus tried to vary those values with sensitivity analysis. For the proportion of asymptomatic cases, the meta-analysis showed that it ranged from 4% to 41%, and we varied the parameter accordingly from 4% to 40%.23 As far as vaccine efficacy was concerned, we adopted the age-dependent COVID-19 vaccine efficacy with statistical significance.4 Since there is a paucity of information on vaccine efficacy of children, we first assumed the same efficacy as young adults, and further analysed the sensitivity with half efficacy of children. Lastly, we assumed the COVID-19 vaccine efficacy against asymptomatic infection as 70% across all analyses.28
Ethics approval
All the data used in this study were publicly available, and therefore were regarded exempt from institutional review board assessment.
Results
Model estimation
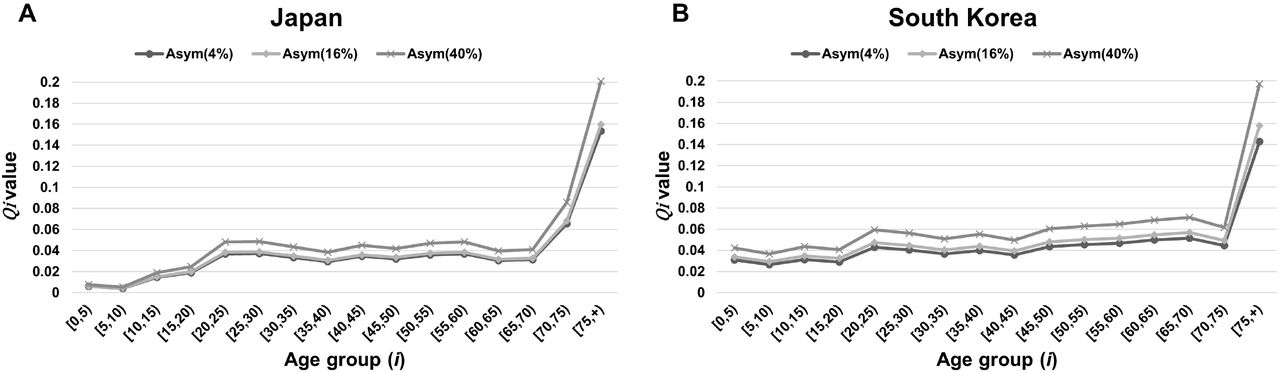
The age-stratified probability (qi) that a susceptible person of age group i acquires infection given contact with an infectious person was estimated as in Figure 3. Both Japan and South Korea showed similar trends of age-dependent increase. The lowest qi value was seen in the age group of 5 to 10 years (0·0043, 95% CI [0·0040–0·0045] in Japan and 0·0293, 95% CI [0·0270–0·0316] in South Korea), and the highest value was seen in the age group of over 75 years (0·1599, 95% CI [0·1568–0·1628] in Japan and 0·1577, 95% CI [0·1518– 0·1637] in South Korea). The model parameters are summarised in Table 1.

As a sensitivity analysis, the qi values with varying proportions of asymptomatic cases from 4% to 40% were presented together.
Model parameters.
Vaccine allocation by age groups
With a provision of 20% to 100% of COVID-19 vaccines, considering the population size of Japan, the optimal vaccine allocation to reduce total case and death numbers are shown in Figure 4A. With a provision of 20% to 100% of COVID-19 vaccines, considering the population size of South Korea, the optimal vaccine allocation to reduce total case and death numbers are shown in Figure 4B. The very first group to receive vaccination to reduce case numbers is aged 20–35 years in Japan and aged over 60 years in South Korea. In the same manner, the first group to receive vaccination to reduce the death toll is aged over 75 years in both countries.

Reduction in the number of cases and deaths
Assuming that there were no further intervention strategies including vaccination, during the third wave, there might have been 75,767 cases and 1,046 deaths in Japan and 25,521 cases and 529 deaths in South Korea in the following 2 weeks of the study period. With gradual vaccination in both countries, the lowest number of cases and deaths are shown in Table 2.
The lowest expected number of COVID-19 cases and deaths at 2 weeks after the third wave by stepwise vaccine supply.
Sensitivity analysis
Varying the proportion of asymptomatic cases from 4% to 40%, vaccine priority groups were not changed in terms of case and death reduction. Likewise, reducing the vaccine efficacy of individuals under 20 years to 50% did not change the priority, either (Supplementary Figure 1).
Discussion
Given the limited initial availability of COVID-19 vaccines, the prioritisation of individuals for vaccination is of utmost importance to public health workers and policy makers. Based on mathematical modelling, we hereby present estimates to inform the distribution of COVID-19 vaccines among different age groups, both in Japan and South Korea, with a stepwise increase in vaccine supply. Applying the reported COVID-19 vaccine efficacy,4 the initial target groups to reduce the total incidence were young adults aged 20–35 years in Japan and individuals aged over 60 years in South Korea. We interpret that this difference might be attributed to the different age-group distribution of COVID-19 cases between Japan (dominance in 20s) and South Korea (dominance over 50s) during the third wave, since the force of infection λi is not only affected by βij, but also by Ij which is the number of infectious individuals in the age group. On the other hand, the target groups to reduce total deaths were primarily focused on the elderly, aged over 75 years in both countries.
To achieve the best model of SARS-CoV-2 transmission, we constructed a compartmental model based on a solid epidemiological investigation which could increase the reliability of our study.6,7,14 The estimated age-stratified probability of transmission given contact (qi) revealed similar results with other studies showing that children have lower probability of transmission given contact.29 However, it is yet to be elucidated whether children are less susceptible to COVID-19 or they show fewer clinical symptoms than adults, or both. To specify the relative impact of those factors, a well-designed national seroprevalence study would be necessary. In Japan and South Korea, seroprevalence of SARS-CoV-2 specific antibodies were measured in local regions including the capital city from May to June 2020, and the results ranged from 0·03% to 0·17% in Japan and 0·07% in South Korea. Owing to a low seroprevalence in both countries, it was not appropriate to derive an answer to the above question. Moreover, there is a caveat to interpret the qi results, since it could be affected by contact numbers, ϕij. Japan showed much lower qi values for individuals aged below 10 years than South Korea, and we assumed that the different school closure policies could explain the discrepancy; contrary to Japan, South Korea maintained restrictions on the number of students in school and the qi might have decreased as low as Japan if it had not regulated school attendance. In addition, previous studies suggested that older age might contribute to vulnerability to COVID-19 infection, it is possible that biological aspects also affect the value of qi then further investigation would be desirable in this area.30
There are several limitations to this study. First, although the contact matrix is the most important variable in this model, we do not have empirical data for the current mixing patterns. We tried to modify the existing prepandemic contact matrix to make it as realistic as possible, but it might be insufficient to reflect reality. Besides, in the existing Japanese contact matrix, the 20–29 year age group is marginally under-represented, and for South Korean contact matrix, we had to adopt the estimated result, not the measured one, since there was no available national survey data so far.8,18 Secondly, we did not take essential worker status and co-morbidities into consideration for our model. Third, seasonality would undoubtedly affect COVID-19 transmission, but it was hard to include this factor in our model. Then, our estimation might not be sufficient for prediction in future seasons. Fourth, the geographical heterogeneity was not considered in this study. In other words, differences in frequency of contact between urban and rural areas could not be assessed here. Lastly, the exact proportion of asymptomatic cases is still unelucidated. We adopted the results from a meta-analysis and further conducted a sensitivity analysis with variable ranges of asymptomatic proportion.23
Here, we present a realistic compartmental model for COVID-19 transmission based on the reliable epidemiological investigation conducted in two East Asian countries, Japan and South Korea. Furthermore, we provide the optimal distribution strategy of COVID-19 vaccines under limited vaccine supply in both countries. In short, the balance between age-dependent effective contact rates and age-specific incidences should be considered for national vaccination strategy. We believe that this study could guide public health practitioners based on the solid mathematical model.
Data Availability
All the data and R codes used in this study are publicly available.
Author Contributions
JYC, YK and ST conceived and design the study. JYC and ST collected study data. HJ and YK analysed the data and JYC, PB, NO, and ST interpreted the results. JYC and HJ wrote a draft of the manuscript. All authors critically reviewed and approved the final manuscript.
Declaration of Interest
The authors declare that they have no known competing financial interests or personal relationships that could have appeared to influence the work reported in this paper.
Role of the funding source
This work was supported by the National Research Foundation of Korea (NRF) grant funded by the Korea government (MSIT) (No. 2020R1A2C3A01003550) and JSPS KAKENHI, Grant number 18K17369 and 20K10546.
Figure legends
Supplementary figure 1. The optimal allocation strategy of COVID-19 vaccines according to age in Japan and South Korea with varying proportions of asymptomatic cases and vaccine efficacy.
Research in context Evidence before this study
We searched PubMed and MedRxiv for research articles published in English from database inception until March 11, 2021, with the keywords “SARS-CoV-2”, “COVID-19”, “Vaccine”, “Immunization,” “Distribution”, “Allocation”, and “Mathematical model”. We found several articles analysing the optimal distribution of COVID-19 vaccines fitted to each nation’s characteristics, notably in the US, UK, Germany, India, and South Korea. However, we identified no research identifying age-specific force of infection to COVID-19 in East Asia, further suggesting the optimal vaccination policy upon the mathematical model.
Added value of this study
Our study combined solid epidemiological data from Japan and South Korea and built the reliable compartment model for SARS-CoV-2 transmission. Using the age-specific incidence of COVID-19, we could estimate the age-stratified probability of transmission given contact by Bayesian inference method, which was incorporated into the compartment model. By virtue of this model, we could evaluate the effects of vaccine distribution scenarios by age in terms of case and death reduction.
Implications of all the available evidence
Fortunately, safe and effective COVID-19 vaccines have been developed within an unprecedented period. For now, how to implement vaccination most effectively is of utmost importance. Here, we suggest the vaccine prioritisation strategy in Japan and South Korea, and we believe it could be generalised to those who have a similar socio-demographic background.
Acknowledgements
Japanese contact matrix data was kindly provided by Dr. Yoko Ibuka, Faculty of Economics, Keio University. We would like to thank Editage (www.editage.co.kr) for English language editing.


