
Abstract
We estimated (1) the time from first detectable virus to peak viral concentration (proliferation time), (2) the time from peak viral concentration to initial return to the limit of detection (clearance time), and (3) the peak viral concentration separately for 69 individuals infected with SARS-CoV-2 variants alpha (n=14), epsilon (n=10), and non-variants of interest/variants of concern (VOI/VOCs) (n=45). For individuals infected with alpha, the mean duration of the proliferation phase was 4.3 days (95% credible interval [3.0, 6.0]), the mean duration of the clearance phase was 7.4 days [6.0, 9.0], and the mean overall duration of infection (proliferation plus clearance) was 11.7 days [9.8, 13.8]. For individuals infected with epsilon, the mean duration of the proliferation phase was 5.6 days [4.0, 7.4], the mean duration of the clearance phase was 8.6 days [6.7, 10.6], and the mean overall duration of infection was 14.2 days [11.8, 16.7]. These compare to a mean proliferation phase of 4.3 days [3.4, 5.4], a mean clearance phase of 6.9 days [6.0, 7.9], and a mean duration of infection of 11.3 days [10.1, 12.5] for non-VOI/VOC infections. The peak viral concentration was 20.9 Ct [18.3, 23.5] for alpha, 20.6 Ct [17.8, 23.5] for epsilon, and 20.8 Ct [19.1, 22.4] for VOI/VOCs. This converts to 7.9 log10 RNA copies/ml [7.2, 8.7] for alpha, 8.0 log10 RNA copies/ml [7.2, 8.8] for epsilon, and 8.0 log10 RNA copies/ml [7.5, 8.4] for non-VOI/VOCs. The distributions of individual-level means are suggestive of longer clearance times for the VOCs. The overall durations of acute infection varied widely across individuals, with individual posterior mean acute infection durations ranging from 5.5 - 16.1 days for alpha, 9.4 - 20.3 days for epsilon, and 4.8 - 17.6 days for non-VOI/VOCs. These data offer evidence that infections with SARS-CoV-2 variants alpha and epsilon feature broadly similar viral trajectories as infections with non-VOI/VOCs.
Main text
The reasons for the enhanced transmissibility of SARS-CoV-2 variants of concern (VOCs)1 are unclear. Of special interest are the VOCs B.1.1.7 (alpha) and B.1.429 (epsilon), which until April 2021 were the most prevalent VOCs in the United States.1 Variant alpha features multiple mutations in the spike protein receptor binding domain2 that may enhance ACE-2 binding,3 thus increasing the efficiency of virus transmission. Variant epsilon partially evades neutralization by sera from convalescent patients and vaccine recipients.4 In addition to, and perhaps due to, these attributes, the viral trajectories for infections with alpha or epsilon could feature a higher peak viral load or longer duration of carriage, both of which could increase transmissibility. To test whether acute infections with SARS-CoV-2 VOCs alpha or epsilon are associated with higher or more sustained nasopharyngeal viral concentrations relative to non-variants of interest and non-variants of concern (non-VOI/VOCs), we assessed longitudinal densely sampled PCR tests performed in a cohort of 69 individuals (Supplementary Table 1) infected with SARS-CoV-2 undergoing daily surveillance testing, including 14 infected with alpha and 10 infected with epsilon, with lineage assignments confirmed by whole genome sequencing.
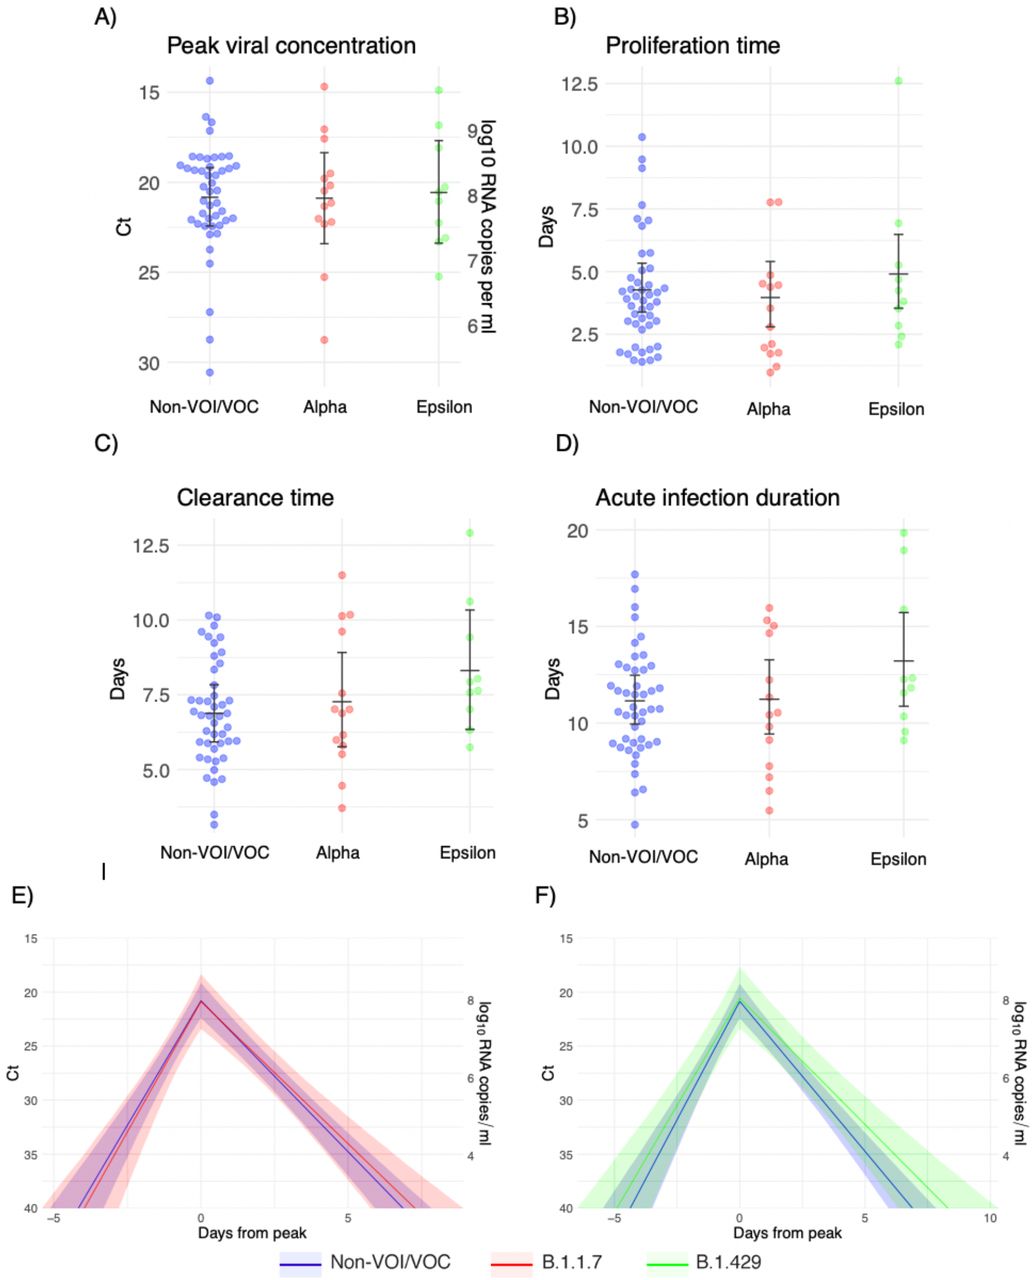
We estimated (1) the time from first detectable virus to peak viral concentration (proliferation time), (2) the time from peak viral concentration to initial return to the limit of detection (clearance time), and (3) the peak viral concentration for each individual (Supplementary Appendix).5 We estimated the means of these quantities separately for individuals infected with alpha, epsilon, and non-VOI/VOCs (Figure 1; Supplementary Table 2). For individuals infected with alpha, the mean duration of the proliferation phase was 4.3 days (95% credible interval [3.0, 6.0]), the mean duration of the clearance phase was 7.4 days [6.0, 9.0], and the mean overall duration of infection (proliferation plus clearance) was 11.7 days [9.8, 13.8]. For individuals infected with epsilon, the mean duration of the proliferation phase was 5.6 days [4.0, 7.4], the mean duration of the clearance phase was 8.6 days [6.7, 10.6], and the mean overall duration of infection was 14.2 days [11.8, 16.7]. These compare to a mean proliferation phase of 4.3 days [3.4, 5.4], a mean clearance phase of 6.9 days [6.0, 7.9], and a mean duration of infection of 11.3 days [10.1, 12.5] for non-VOI/VOC infections. The peak viral concentration was 20.9 Ct [18.3, 23.5] for alpha, 20.6 Ct [17.8, 23.5] for epsilon, and 20.8 Ct [19.1, 22.4] for VOI/VOCs. This converts to 7.9 log10 RNA copies/ml [7.2, 8.7] for alpha, 8.0 log10 RNA copies/ml [7.2, 8.8] for epsilon, and 8.0 log10 RNA copies/ml [7.5, 8.4] for non-VOI/VOCs. We found no evidence of variant-specific differences in the population means for these parameters, as assessed by overlapping 95% credible intervals, and no differences in empirical distribution, as assessed by a Kolmogorov-Smirnov test6 with significance threshold α = 0.05. However, the distributions of individual-level means are suggestive of longer clearance times for the VOCs (Figure 1C). The overall durations of acute infection varied widely across individuals, with individual posterior mean acute infection durations ranging from 5.5 – 16.1 days for alpha, 9.4 – 20.3 days for epsilon, and 4.8 – 17.6 days for non-VOI/VOCs (Supplementary Table 3). Data and code are available online.7

Individual posterior means (points) with population means and 95% credible intervals (hatched lines) for (A) the mean peak viral concentration, (B) the mean proliferation duration, (C) the mean clearance duration, and (D) the mean total duration of acute infection. The points are jittered horizontally to avoid overlap. Solid lines in panels (E)-(F) depict the mean posterior viral trajectories for alpha infections (red) and epsilon infections (green) respectively, relative to non-VOI/VOC infections (blue), as specified by the population means and credible intervals in (A)-(D). The shaded regions represent 95% credible areas for the mean population trajectories.
These data offer evidence that infections with SARS-CoV-2 variants alpha and epsilon feature broadly similar viral trajectories as infections with non-VOI/VOCs. Our ability to detect differences in the trajectories was limited by small sample sizes and a high degree of interpersonal variation. The findings should be seen as preliminary, as they are based on fourteen alpha cases and ten epsilon cases. The possibility of an extended clearance time for SARS-CoV-2 VOCs merits further investigation; if borne out by additional data, a longer isolation period than the currently recommended 10 days after symptom onset8 may be needed to effectively interrupt secondary infections by some VOCs. Collection of longitudinal PCR and test positivity data in larger and more diverse cohorts is urgently needed.
Data Availability
Data and code are available online at https://github.com/gradlab/CtTrajectories_AllVariants
Supplementary Appendix
Ethics
Residual de-identified viral transport media from anterior nares and oropharyngeal swabs collected from players, staff, vendors, and associated household members from a professional sports league were obtained from BioReference Laboratories. In accordance with the guidelines of the Yale Human Investigations Committee, this work with de-identified samples was approved for research not involving human subjects by the Yale Internal Review Board (HIC protocol # 2000028599). This project was designated exempt by the Harvard IRB (IRB20-1407).
Study population
The data reported here represent a convenience sample including team staff, players, arena staff, and other vendors (e.g., transportation, facilities maintenance, and food preparation) affiliated with a professional sports league. Clinical samples were obtained by combined swabs of the anterior nares and oropharynx administered by a trained provider. Viral concentration was measured using the cycle threshold (Ct) according to the Roche cobas target 1 assay. For an initial pool of 589 participants who first tested positive for SARS-CoV-2 infection during the study period (between November 28th, 2020 and May 4th, 2021), a diagnosis of “novel” or “persistent” infection was recorded. “Novel” denoted a likely new infection while “persistent” indicated the presence of virus in a clinically recovered individual. A total of 69 individuals (90% male) had novel infections that met our inclusion criteria: at least five positive PCR tests (Ct < 40), at least one negative PCR test (Ct = 40), at least one test with Ct < 32, and a genetic lineage of either B.1.1.7, B.1.429, or non-variant of interest/non-variant of concern (that is, we excluded lineages B.1.427, P.1, B.1.351, B.1.526, B.1.526.1, B.1.526.2, and P.2, of which there were 8 infections in total) as confirmed by whole genome sequencing. Fourteen of the individuals who met the inclusion criteria were infected with B.1.1.7 (alpha) and ten were infected with B.1.429 (epsilon).
Genome sequencing and lineage assignments
RNA was extracted and confirmed as SARS-CoV-2 positive by RT-qPCR with the Thermo Fisher TaqPath SARS-CoV-2 assay.9 Next Generation Sequencing with the Illumina COVIDSeq ARTIC primer set10 was used for viral amplification. Library preparation was performed using the amplicon-based Illumina COVIDseq Test v0311 and sequenced 2×74 on Illumina NextSeq 550 following the protocol as described in Illumina’s documentation.12 The resulting FASTQs were processed and analyzed on Illumina BaseSpace Labs using the Illumina DRAGEN COVID Lineage Application;13 versions included are 3.5.0, 3.5.1, 3.5.2, and 3.5.3. The DRAGEN COVID Lineage pipeline was run with default parameters recommended by Illumina. Samples were considered SARS-COV-2 positive if at least 5 viral amplicon targets were detected at 20x coverage. Each SARS-COV-2 positive sample underwent lineage assignment and phylogenetics analysis using the most updated version of Pangolin14 and NextClade,15 respectively.
Converting Ct values to viral genome equivalents
To convert Ct values to viral genome equivalents, we first converted the Roche cobas target 1 Ct values to equivalent Ct values on a multiplexed version of the RT-qPCR assay from the US Centers for Disease Control and Prevention.16 We did this following our previously described methods.5 Briefly, we adjusted the Ct values using the best-fit linear regression between previously collected Roche cobas target 1 Ct values and CDC multiplex Ct values using the following regression equation:
 Here, yi denotes the ith Ct value from the CDC multiplex assay, xi denotes the ith Ct value from the Roche cobas target 1 test, and εi is an error term with mean 0 and constant variance across all samples. The coefficient values are β0 = –6.25 and β1 = 1.34.
Ct values were fitted to a standard curve in order to convert Ct value data to RNA copies. Synthetic T7 RNA transcripts corresponding to a 1,363 b.p. segment of the SARS-CoV-2 nucleocapsid gene were serially diluted from 106-100 RNA copies/μl in duplicate to generate a standard curve17 (Supplementary Table 4). The average Ct value for each dilution was used to calculate the slope (−3.60971) and intercept (40.93733) of the linear regression of Ct on log-10 transformed standard RNA concentration, and Ct values from subsequent RT-qPCR runs were converted to RNA copies using the following equation:
 Here, [RNA] represents the RNA copies /ml. The log10(250) term accounts for the extraction (300 μl) and elution (75 μl) volumes associated with processing the clinical samples as well as the 1,000 μl/ml unit conversion.
Model fitting
For the statistical analysis, we removed any sequences of 3 or more consecutive negative tests to avoid overfitting to these trivial values. Following our previously described methods,5 we assumed that the viral concentration trajectories consisted of a proliferation phase, with exponential growth in viral RNA concentration, followed by a clearance phase characterized by exponential decay in viral RNA concentration.18 Since Ct values are roughly proportional to the negative logarithm of viral concentration19, this corresponds to a linear decrease in Ct followed by a linear increase. We therefore constructed a piecewise-linear regression model to estimate the peak Ct value, the time from infection onset to peak (i.e. the duration of the proliferation stage), and the time from peak to infection resolution (i.e. the duration of the clearance stage). The trajectory may be represented by the equation
 Here, E[Ct(t)] represents the expected value of the Ct at time t, “l.o.d” represents the RT-qPCR limit of detection, δ is the absolute difference in Ct between the limit of detection and the peak (lowest) Ct, and to, tp, and tr are the onset, peak, and recovery times, respectively.
Before fitting, we re-parametrized the model using the following definitions:
ΔCt(t) = l.o.d. – Ct(t) is the difference between the limit of detection and the observed Ct value at time t.
ωp = tp -to is the duration of the proliferation stage.
ωr = tr -tp is the duration of the clearance stage.
We constrained 0.25 ≤ ωp ≤ 14 days and 2 ≤ ωr ≤ 30 days to prevent inferring unrealistically small or large values for these parameters for trajectories that were missing data prior to the peak and after the peak, respectively. We also constrained 0 ≤ δ ≤ 40 as Ct values can only take values between 0 and the limit of detection (40).
We next assumed that the observed ΔCt(t) could be described the following mixture model:
 where E[ΔCt(t)] = l.o.d. - E[Ct(t)] and λ is the sensitivity of the q-PCR test, which we fixed at 0.99. The bracket term on the right-hand side of the equation denotes that the distribution was truncated to ensure Ct values between 0 and the limit of detection. This model captures the scenario where most observed Ct values are normally distributed around the expected trajectory with standard deviation σ(t), yet there is a small (1%) probability of an exponentially distributed false negative near the limit of detection. The log(10) rate of the exponential distribution was chosen so that 90% of the mass of the distribution sat below 1 Ct unit and 99% of the distribution sat below 2 Ct units, ensuring that the distribution captures values distributed at or near the limit of detection. We did not estimate values for λ or the exponential rate because they were not of interest in this study; we simply needed to include them to account for some small probability mass that persisted near the limit of detection to allow for the possibility of false negatives.
We used a hierarchical structure to describe the distributions of ωp, ωr, and δ for each individual based on their respective population means μωp, μωr, and μδ and population standard deviations σωp, σωr, and σδ such that
 We inferred population means (μ•) separately for individuals infected with alpha, epsilon, and non-VOI/VOCs. We used a Hamiltonian Monte Carlo fitting procedure implemented in Stan (version 2.24)20 and R (version 3.6.2)21 to estimate the individual-level parameters ωp, ωr, δ, and tp as well as the population-level parameters σ*, μωp, μωr, μδ, σωp, σωr, and σδ. We used the following priors:
Hyperparameters

 The values in square brackets denote truncation bounds for the distributions. We chose a vague half-Cauchy prior with scale 5 for the observation variance σ*. The priors for the population mean values (μ•) are normally distributed priors spanning the range of allowable values for that parameter; this prior is vague but expresses a mild preference for values near the center of the allowable range. The priors for the population standard deviations (σ•) are half Cauchy-distributed with scale chosen so that 90% of the distribution sits below the maximum value for that parameter; this prior is vague but expresses a mild preference for standard deviations close to 0.
We ran four MCMC chains for 1,000 iterations each with a target average proposal acceptance probability of 0.8. The first half of each chain was discarded as the warm-up. The Gelman R-hat statistic was less than 1.1 for all parameters. This indicates good overall mixing of the chains. There were no divergent iterations, indicating good exploration of the parameter space. The posterior distributions for μδ, μωp, and μωr, were estimated separately for individuals infected with alpha, epsilon, and non-VOI/VOCs. These are depicted in Figure 1 (main text). Draws from the individual posterior viral trajectory distributions are depicted in Supplementary Figures 1-2. The mean posterior viral trajectories for each individual are depicted in Supplementary Figure 3.
Assessing sensitivity to different priors
To ensure that our findings were not overly influenced by the prior distributions, we re-fit the model using two different sets of priors. The first set used the posterior population means from a previous study in a similar population as the prior values for μωp, μωr, and μδ., These priors were defined by
 The second set used unrealistically low prior means for μωp, μωr, and μδ to verify that the suggestion of longer clearance times for alpha and epsilon infections was informed by the data and not solely by a biased prior distribution. These priors were defined by
 Note that we updated the prior means but kept the prior variances at their original wide values to avoid encoding over-confidence in the priors into the model. The posterior population means for these new sets of priors are depicted in Supplementary Figures 4-5 (compare to Figure 1). Overall, the findings were consistent across choices of prior.
Number and percent (in parentheses) of individuals in the study population by age group and reported symptoms, stratified by variant.
Reported values represent the posterior mean and 95% credible intervals (brackets) for each parameter.
Reported values represent the median, inner quartile range, and full range of individual-level posterior means for each parameter.
Synthetic T7 RNA transcripts corresponding to a 1,363 base pair segment of the SARS-CoV-2 nucleocapsid gene were serially diluted from 106-100 and evaluated in duplicate with RT-qPCR. The best-fit linear regression of the average Ct on the log10-transformed standard values had slope -3.60971 and intercept 40.93733 (R2 = 0.99).

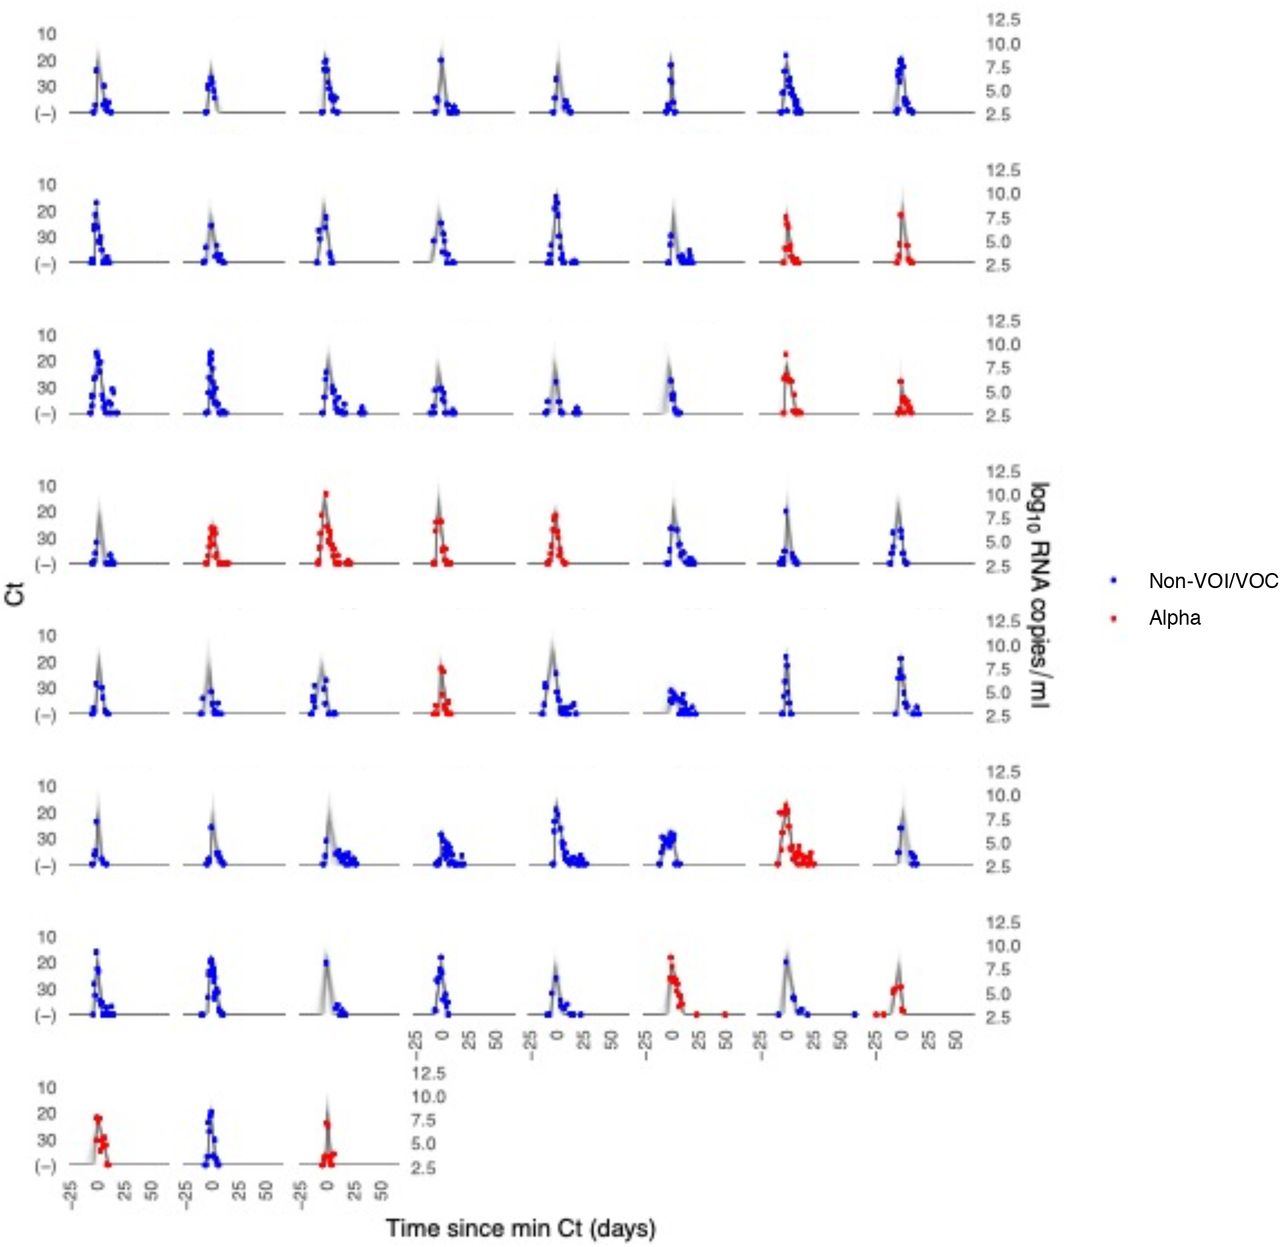
Each pane depicts the recorded Ct values (points) and derived log-10 genome equivalents per ml (log(ge/ml)) for a single person during the study period. Points along the horizontal axis represent negative tests. Time is indexed in days since the minimum recorded Ct value (maximum viral concentration). Individuals with confirmed alpha infections are depicted in red. Non-VOI/VOC infections are depicted in blue. Lines depict 100 draws from the posterior distribution for each person’s viral trajectory.

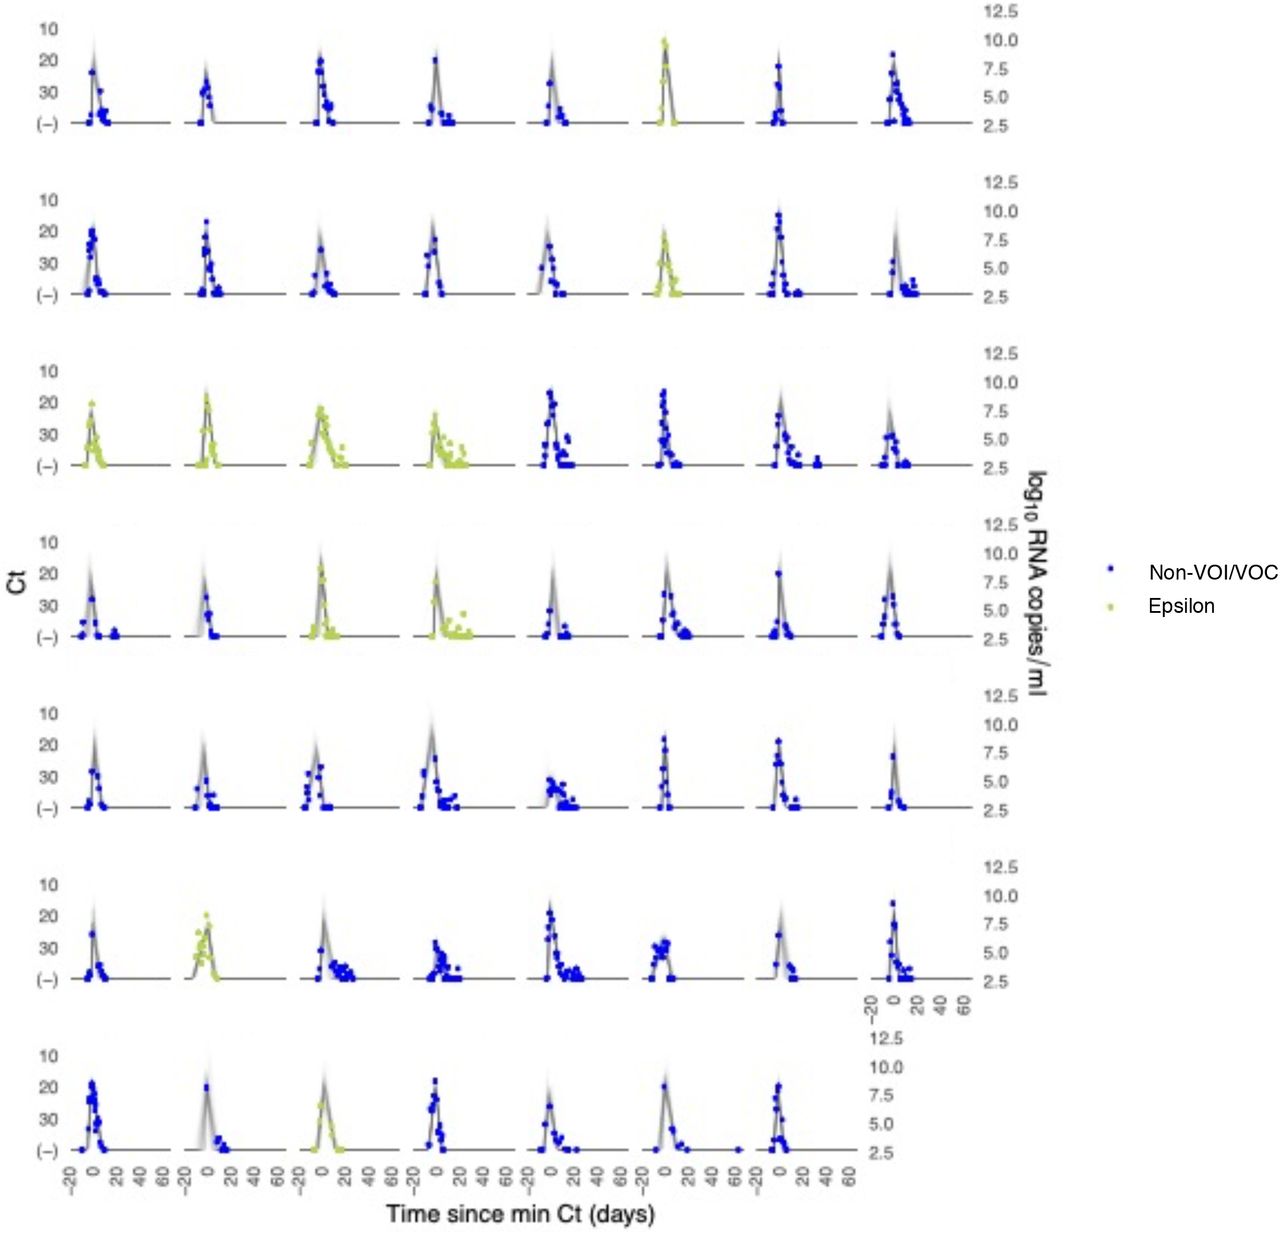
Each pane depicts the recorded Ct values (points) and derived log-10 genome equivalents per ml (log(ge/ml)) for a single person during the study period. Points along the horizontal axis represent negative tests. Time is indexed in days since the minimum recorded Ct value (maximum viral concentration). Individuals with confirmed epsilon infections are depicted in red. Non-VOI/VOC infections are depicted in blue. Lines depict 100 draws from the posterior distribution for each person’s viral trajectory.

Panel (A) depicts alpha infections (red) against non-VOI/VOC infections (blue). Panel (B) depicts epsilon infections (green) against non-VOI/VOC infec-tions (blue). Trajectories are aligned temporally to have the same peak time.

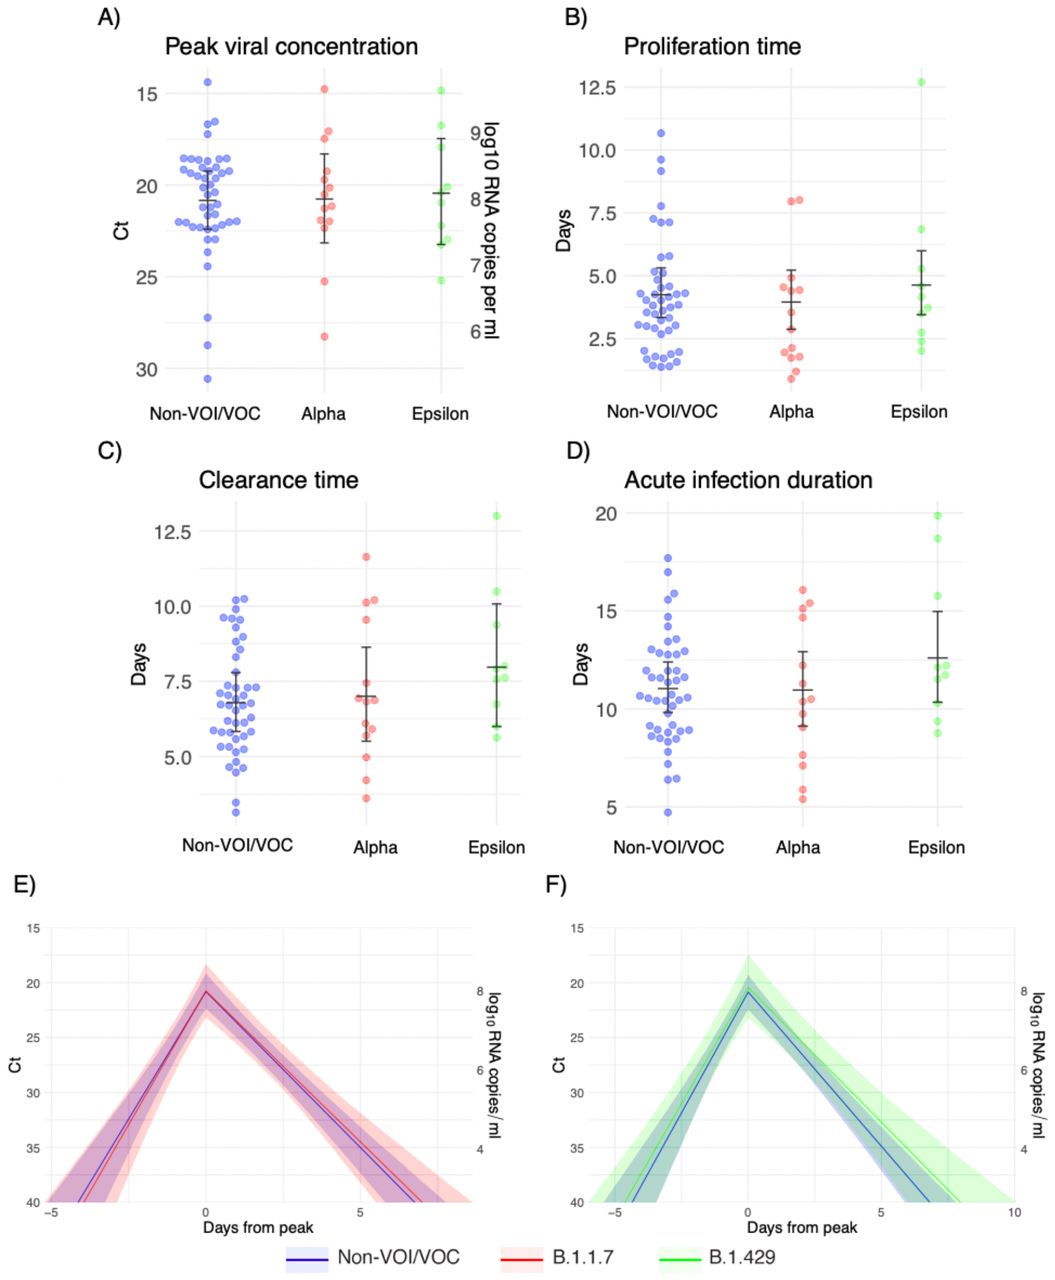
Individual posterior means (points) with population means and 95% credible intervals (hatched lines) for (A) the mean peak viral concentration, (B) the mean proliferation duration, (C) the mean clearance duration, and (D) the mean total duration of acute infection. Points are jittered horizontally to avoid overlap. Solid lines in panels (E)-(F) depict the mean posterior viral trajectories for alpha infections (red) and epsilon infections (green) respectively, relative to non-VOI/VOC infections (blue), as specified by the population means and credible intervals in (A)-(D). The shaded regions represent 95% credible areas for the mean population trajectories. Priors were informed by a previous analysis and are defined in Eq. (S10).

Individual posterior means (points) with population means and 95% credible intervals (hatched lines) for (A) the mean peak viral concentration, (B) the mean proliferation duration, (C) the mean clearance duration, and (D) the mean total duration of acute infection. Points are jittered horizontally to avoid overlap. Solid lines in panels (E)-(F) depict the mean posterior viral trajectories for alpha infections (red) and epsilon infections (green) respectively, relative to non-VOI/VOC infections (blue), as specified by the population means and credible intervals in (A)-(D). The shaded regions represent 95% credible areas for the mean population trajectories. Priors were chosen to be unrealistically low and are defined in Eq. (S11).
Footnotes
↵† denotes co-senior authorship
Larger sample size, inclusion of additional SARS-CoV-2 variant, addition of coauthors who assisted with sequencing.


