
Abstract
Background Wide variation between countries has been noted in per-capita mortality from the disease (COVID-19) caused by the SARS-CoV-2 virus. Determinants of this variation are not fully understood.
Methods Potential predictors of per-capita coronavirus-related mortality in 198 countries were examined, including age, sex ratio, obesity prevalence, temperature, urbanization, smoking, duration of infection, lockdowns, viral testing, contact tracing policies, and public mask-wearing norms and policies. Multivariable linear regression analysis was performed.
Results In univariate analyses, the prevalence of smoking, per-capita gross domestic product, urbanization, and colder average country temperature were positively associated with coronavirus-related mortality. In a multivariable analysis of 194 countries, the duration of infection in the country, and the proportion of the population 60 years of age or older were positively associated with per-capita mortality, while duration of mask-wearing by the public was negatively associated with mortality (all p<0.001). The prevalence of obesity was independently associated with mortality in models which controlled for testing levels or policy. International travel restrictions were independently associated with lower per-capita mortality, but other containment measures and viral testing and tracing policies were not. In countries with cultural norms or government policies supporting public mask-wearing, per-capita coronavirus mortality increased on average by just 8.0% each week, as compared with 54% each week in remaining countries. On multivariable analysis, lockdowns tended to be associated with less mortality (p=0.43), and increased per-capita testing with higher reported mortality (p=0.70), though neither association was statistically significant.
Conclusions Societal norms and government policies supporting the wearing of masks by the public, as well as international travel controls, are independently associated with lower per-capita mortality from COVID-19.
Introduction
The COVID-19 global pandemic caused by infection with severe acute respiratory syndrome coronavirus 2 (SARS-CoV-2) has presented a major public health challenge. For reasons that are not completely understood, the per-capita mortality from COVID-19 varies by several orders of magnitude between countries.1 Numerous sources of heterogeneity have been hypothesized. Higher mortality has been observed in older populations and in men.2,3 Patient-level behaviors, such as smoking, might also have an impact.3 Other potentially relevant factors include economic activity, and environmental variation, such as temperature.4 More urban settings and increased population density would be expected to enhance viral transmission.5
In addition, public health responses to the COVID-19 pandemic may influence per-capita mortality. Various strategies have been implemented, ranging from robust testing programs to lockdown or stay-at-home orders, to mandates regarding social distancing and face mask usage. Practices with theoretical benefit, such as social distancing, stay-at-home orders, and implementation of mandates regarding use of masks in public spaces, must be assessed quickly, as implementation has the potential to reduce morbidity and mortality.
Mask usage by the public is postulated to decrease infection by blocking the spread of respiratory droplets,1 and was successfully implemented during other coronavirus outbreaks (i.e. SARS and MERS).6 In the context of the ongoing pandemic, we assessed the impact of masks on per-capita COVID-19-related mortality, controlling for the aforementioned factors. We hypothesized that in countries where mask use was either an accepted cultural norm or favored by government policies on a national level, the per-capita mortality might be reduced, as compared with countries which did not advocate masks.
Methods
Data acquisition
Country-wide coronavirus mortality data was retrieved from the publicly available Worldometers Database on May 9, 2020.7 Countries were included if either: 1) coronavirus testing data were available by May 9, 2020,7 or if: 2) testing and lockdown policies had been graded by the University of Oxford Coronavirus Government Response Tracker.54,55
Oxford University defined and scored several composite government response indices. The stringency index was defined in terms of containment policy and public information.55 The government response index incorporated containment, economic measures, public information, and testing and tracing policies.55 The containment and health index was defined in terms of containment measures, public information, and testing and tracing policies.55
Archived viral testing data for April 2020 were also downloaded.8 The date of the country’s first reported infection and first death were obtained from the European Centre for Disease Prevention and Control (which did tabulate worldwide data).9
Mean temperature in each country during the pandemic was estimated using the average monthly temperature in the country’s largest city from public sources.10,11
Online news reports and government statements, including those cited by a previous review101 and a public database,56 were searched to identify countries in which the public wore masks early in the outbreak based on tradition, as well as countries in which the national government mandated or recommended mask-wearing by the public before April 16, 2020.
For each country, the population,12 fraction of the population age 60 years and over, and age 14 and under, male: female ratio per country,13 surface area,12,13 gross domestic product per capita,14 percent urbanization,12,15 adult smoking prevalence16-19 and prevalence of adult obesity57-76 were tabulated. Whether a nation was an isolated political entity on an island was also recorded.
Statistical analysis
The prevalence of an infectious process undergoing exponential growth (or decay) appears linear over time when graphed on a logarithmic scale.1 Therefore, we postulated that the logarithm of the country-wide infection prevalence would be linearly related with the duration of the infection in each country. In addition, our analysis postulated that deaths from coronavirus would follow infections with some delay.
On average, the time from infection with the coronavirus to onset of symptoms is 5.1 days,20 and the time from symptom onset to death is on average 17.8 days.21 Therefore, the time from infection to death is expected to be 23 days.122 These incubation and mortality times were prespecified.1,22 Therefore, the date of each country’s initial infection was estimated as the earlier of: 5 days before the first reported infection, or 23 days before the first death.8,9,23 Deaths by May 9, 2020 would typically reflect infections beginning 23 days previously (by April 16). Therefore, we recorded the time from the first infection in a country until April 16. We also recorded the period of the outbreak: 1) from the mandating of activity restrictions until April 16, and 2) from when public mask-wearing was recommended until April 16. In addition, we calculated the mean time-weighted score for each lockdown and testing policy as graded by the University of Oxford for the duration of the country’s outbreak, from beginning through April 16.54 For instance, if the school closure score was 1 for half the outbreak and 2 for the other half, then the mean score was 1.5.
Per-capita mortality can be analyzed as a binary outcome (low or high), or as a continuous variable. Each approach has strengths and weaknesses.
Analysis of a binary outcome is not unduly influenced by outliers. Countries with extremely low or high mortality are included in the appropriate group, but the exact mortality value does not change the results. Moreover, analysis of a binary outcome facilities clear communication, because one can describe the characteristics of low and high mortality countries.
On the other hand, per-capita mortality is in fact a continuous variable, and the separation of countries just below or just above a threshold value is somewhat arbitrary, or susceptible to chance variation. Analysis of mortality as a continuous variable uses all the information available, and can appropriately model the exponential growth of an infection. We view the binary and continuous analyses as complementary. When one sees that a univariate association is found with both types of analysis, one gains confidence that the association is not an artifact of the analytic method selected. Therefore, we used both methods for initial univariate selection of variables.
In univariate analysis, characteristics of countries with above-median per-capita mortality were compared with the remaining (lower mortality) countries by the two-sample t-test using groups. The odds ratio for being in the high-mortality group was calculated by logistic regression. In addition, logarithm (base 10) of per-capita coronavirus-related mortality was predicted by linear regression.
Significant predictors of per-capita coronavirus mortality in the univariate analysis were analyzed by stepwise backwards multivariable linear regression analysis. The dependent variable was the logarithm (base 10) of per-capita coronavirus-related mortality. Because of the importance relative to public health, the weeks the country spent in lockdown and using masks, and per-capita testing levels, were retained in the model. In addition, because of their biological plausibility and presumed importance, urbanization, prevalence of obesity, and average ambient temperature were retained in most of the multivariable models presented below. Statistical analysis was performed with xlstat 2020.1 (Addinsoft, New York). An alpha (p value) of 0.05 was deemed to be statistically significant. The study was approved by the Virginia Commonwealth University Office of Research Subjects Protection.
Results
We studied coronavirus mortality in 198 countries, of which 183 had testing data,7 161 had government policies scored by Oxford University,54 and 146 fell into both categories.
The 99 lower-mortality countries had 1.0 deaths per million population, in contrast with an average of 94.2 deaths per million population in the 99 higher-mortality countries (p<0.001, Table 1). The median value was 3.7 deaths per million population. The same independent variables were found to be statistically significant on univariate analysis regardless of whether per-capita mortality was considered a binary or continuous variable, as outlined below (Table 1, Appendix Table A1).
Characteristics of countries with low and high per-capita coronavirus mortality by May 9, 2020 in 198 countries.
We assumed that island nations might find it less challenging to isolate and protect their populations. However, 20 of 99 low-mortality countries were isolated on islands, compared with 27 of 99 high-mortality countries (p=0.32). Country surface area and population were not associated with coronavirus mortality (Table 1).
Population characteristics
Countries with older populations suffered higher coronavirus mortality. Countries with low mortality had on average 8.9% of their population over age 60, as compared with 18.9% in the high-mortality countries (Table 1). The proportion of the population which was male was not associated with country-wide mortality (p=0.98, Table 1). Smoking prevalence was on average 13.8% in low mortality countries and 18.5% in high-mortality countries (p<0.001, Table 1). The prevalence of obesity was on average 14.7% in low-mortality countries and 24.0% in high-mortality countries (p<0.001, Table 1).
Temperature
Colder countries were associated with higher coronavirus mortality in univariate analysis. The mean temperature was 22.3 C (SD 7.6 C) in the low-mortality countries, and 14.0 C (SD 9.1 C) in the high-mortality countries (p<0.001, Table 1).
Economics
Urbanization was associated with coronavirus mortality in univariate analysis. In low-mortality countries, on average 53% of the population was urban, as compared with 71% of the population in the high-mortality countries (p<0.001, Table 1). Richer countries suffered a higher coronavirus related mortality. The mean GDP per capita was $9,350 in the low-mortality countries, and was $27,380 in the high-mortality countries (Table 1, p<0.001).
Masks
We identified 18 countries with recommendations or cultural norms favoring mask-wearing by the public within 21 days of the onset of the country’s outbreak:1,24 including: Thailand,25 Japan,24,26 South Korea,24,27 Taiwan,28 Macau,77 Hong Kong,24,29,30 Vietnam,31 Malaysia,32 Cambodia,33,34 the Philippines,35 Slovakia, Venezuela, Uzbekistan, Mozambique, Sierra Leone, and Malawi (Table 2).78-81 In fact, in Mongolia36 and Laos,37 the public began wearing masks before any cases were confirmed in their countries (Table 2). The average mortality by May 9 for the 18 early mask-wearing countries was 1.61 per million (SD 2.2). Fourteen of the 18 were lower-mortality countries (p=0.02).
Countries in which masks were widely used by the public or recommended by the government within 3 weeks of the local onset of the outbreak.
As the country where the pandemic started, China is a noteworthy case of a nation which traditionally has favored mask-wearing by the public for respiratory illnesses, but which did not deploy masks immediately. The first cases in China had begun by December 1, 2019.78 By the time human-to-human transmission was confirmed on Jan. 20, 2020, many in Beijing were already wearing masks.79 The government required masks in public in Wuhan on Jan. 22.80 Masks were ordered throughout China when around others in public on Jan. 31.81 China suffered a very significant outbreak in Wuhan, but appears not to have experienced the same level of infection in other regions. Their reported country-wide per-capita mortality by May 9, 2020 was 3.2 per million population.
In Nepal, facemasks are commonly seen in urban centers due to air pollution.104 The first case of COVID-19 in the country was reported on January 13, in a student returning from Wuhan for winter break.105 However, no subsequent cases were reported in Nepal until the second week of March.105 By January 29, all students at some schools were wearing masks.106 By February 3, pharmacies were selling out of masks due to increased demand.107 With the outbreak, tailors began sewing cloth masks.104 By February 8, 2020, “a majority” of the public was wearing masks.108 The recommendation to wear masks in public became more formalized on March 25.109 The Ministry of Health distributed masks to children and elderly in shelters by March 25.110 A survey in Nepal at the end of March found that 83% of respondents agreed that asymptomatic people should wear masks to prevent COVID-19 infection.105 As of May 9, Nepal reported no coronavirus-related mortality. We used the March 25 recommendation as the date in the mask analysis, but earlier mask use might have forestalled the epidemic in Nepal.
The World Health Organization initially advised against widespread mask wearing by the public, as did the United States CDC.124 The WHO reversed course and recommended masks in public on June 5, 2020.111 Nonetheless, some Western governments mandated or recommended mask-wearing in public in March 2020. Masks were required in public in Venezuela beginning March 13.38,39 In Slovakia, masks were mandated in shops and transit on March 15,40 and more broadly in public on March 25.41 Masks were dispensed by pharmacists for free in Sudan by March 16.82-83 Masks were required in public in Czechia on March 19,42 and in Uzbekistan on March 25.43,84 By March 23, masks were recommended in Kuwait for gatherings.101 By March 29, masks were required in public in Bosnia,43,84 mandated in indoor public spaces in Slovenia,44 and recommended in gyms, parks, and public transit in Iran.101 In Austria, a mandate to wear masks in shops was announced on March 30, with the expectation that masks would be available by April 1.45 In addition, the requirement to wear masks on public transit was announced there on April 6.46 Masks were recommended for the public in Bulgaria on March 30.47
Government mandates or recommendations for mask wearing by the public were issued by April 16 in multiple countries, including: Israel and Sierra Leone on April 1; in Cuba,85 the Philippines, and Mauritius on April 2; the United States, Turkey, Singapore,86-88 and Cyprus on April 3; India,89 Kenya,90 Malawi,91 Colombia, and the UAE on April 4; Indonesia,92 Lebanon, Antigua and Barbuda,93 and Trinidad and Tobago on April 5; Ukraine, Canada, Tunisia,94 and Morocco on April 6; Honduras, Peru, and Panama on April 7; Ecuador, El Salvador, Lithuania, Chile, Benin,95 and Mozambique96 on April 8; Guatemala and Bahrain97 on April 9; Gabon98 and South Africa on April 10; Spain, Ethiopia,99 and Sri Lanka on April 11; Ethiopia on April 12; Cameroon on April 13; 100 Equatorial Guinea, Sint Maarten, Mongolia, Nigeria,102,103 and Finland on April 14; Grenada on April 15; the Dominican Republic, Poland, Libya, Zambia, and Estonia on April 16.
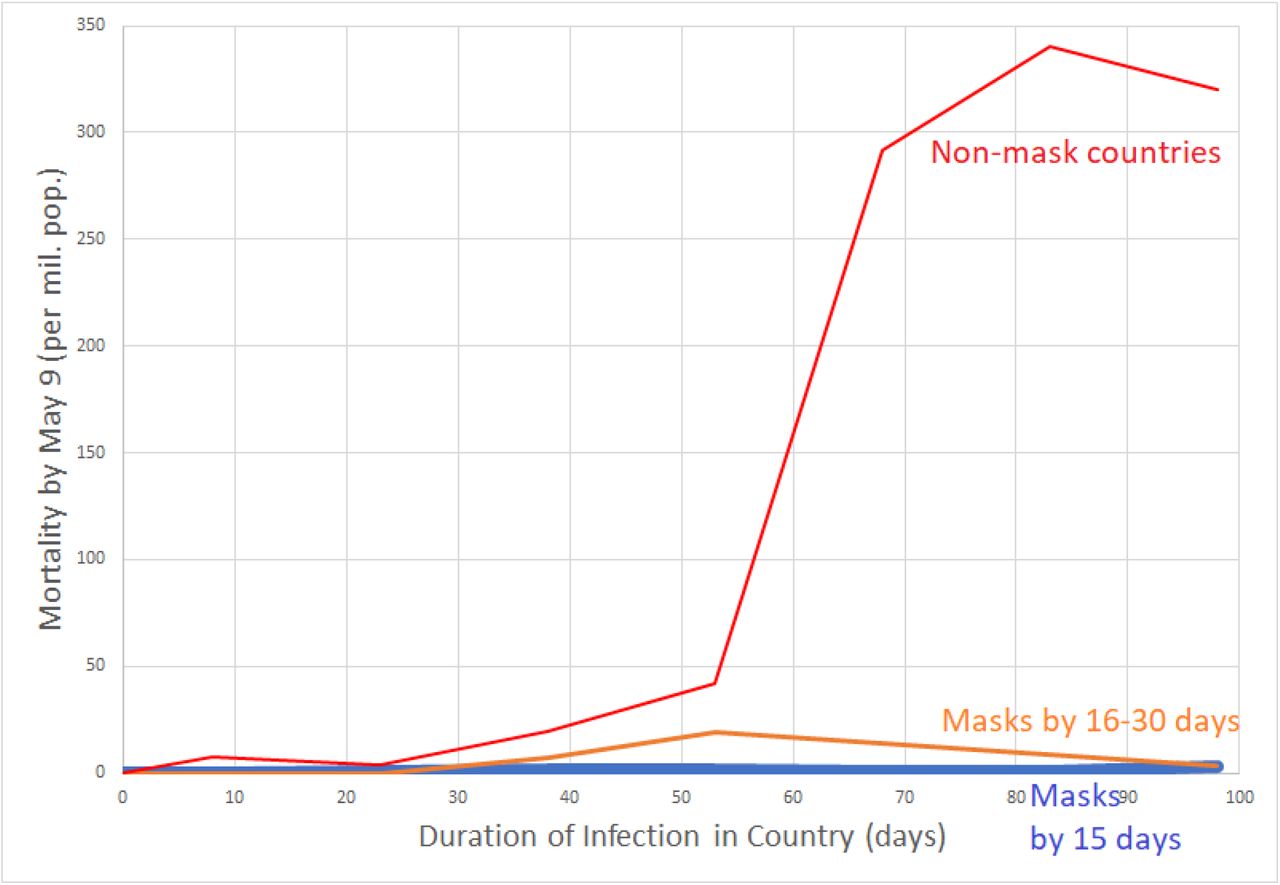
Before the formal statistical analysis, we graphically illustrate the effect of mask wear (Figures 1, 2). The first figure demonstrates the effect of early mask usage (Figure 1). In the countries not using masks by April 16, the per-capita mortality by May 9 rises dramatically if the infection has persisted in the country over 60 days (Figure 1, red line). On the other hand, countries in which a mask was used from 16 to 30 days after infection onset had per-capita mortality several orders of magnitude less by May 9 (Figure 1, orange line). When countries recommended masks within 15 days of the onset of the outbreak, the mortality was so low that the curve is difficult to distinguish from the x-axis (Figure 1, blue line).

Per-capita mortality by May 9 versus duration of infection in no-mask and early-mask countries. Data grouped by whether country did not recommend masks by April 16,2020 (red line), recommended masks 16 to 30 days after onset of the country’s outbreak (orange line), or recommended masks (or traditionally used masks) within 15 days of the outbreak onset (blue line close to the x-axis). Country mortality was averaged for the following country groups of infection duration: 0-15 days, 16-30 days, 31-45 days, 46-60 days, 61-75 days, 76-90 days, 91-105 days. For instance, per-capita mortality for all non-mask countries with infection duration between 61 and 75 days was averaged, and graphed at the x-value 68 days. Data for graph derived from 198 countries.

Per-capita mortality by May 9 as a function of the period of the country’s outbreak without mask recommendations or norms. Data grouped by whether country recommended (or traditionally used) masks by April 16 (blue line), or not (red line). Data for graph derived from 198 countries.
For instance, for the early mask-wearing countries in which the infection had arrived by January (Thailand, Japan, South Korea, Taiwan, Macau, Hong Kong, Vietnam, Cambodia, Malaysia, the Philippines), the virus was present in the country by 80 or more days by April 16 (Table 2). If masks had no effect, we might have expected these countries to have a mortality well over 300 deaths per million (Figures 1, 2). Instead, the mortality for these 10 regions was 2.1 per million (SD 2.5, Table 2)—more than a 100-fold reduction.
On the other hand, the mortality curves for mask and non-mask countries look reasonably similar if they are compared based on the period of their outbreaks without masks (Figure 2). The red line in the figure displays the mean per-capita mortality as a function of the duration of infection in the countries which did not recommend masks by April 16 (Figure 2). Countries are averaged in two-week (14-day) groups. For instance, the per-capita mortality data from all countries with an outbreak which had lasted between 1 and 14 days by April 16 are averaged and displayed together. Not surprisingly, the longer the outbreak lasts in the country, the higher the mortality. Beyond 8 weeks (56 days), the per-capita mortality sharply increases. Data from countries which recommended masks before Apr. 16 are displayed with the thick blue line (Figure 2). Here, the x-axis is not the total time of the infection, but rather the period of the infection before masks were recommended. Of note, the curves demonstrate the same general behavior. The mortality in the mask countries by 8 weeks is lower by a factor of two, but not by a factor of 100. Thus, when compared on their mask-free periods, mask and non-mask countries appear reasonably similar.
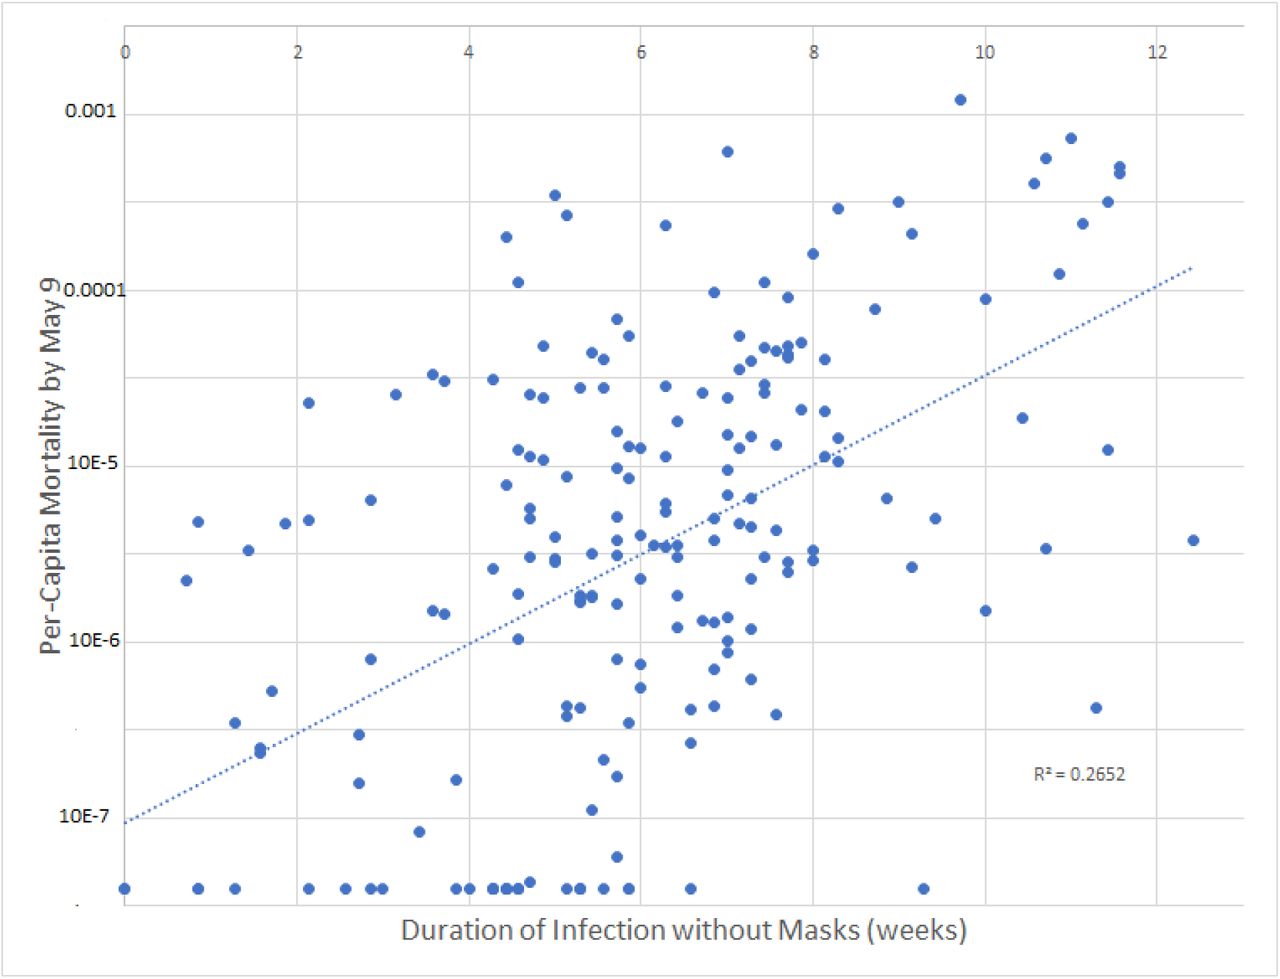
In order to provide some graphical idea of the scatter of the data when exponential growth is assumed, we graphed per-capita mortality by May 9 on a logarithmic scale as a function of the duration of the country’s outbreak not using masks in all 198 countries (Figure 3). This simple model explained 26.5% of the variation in per-capita mortality.
Scatter-plot of per-capita mortality by May 9, 2020 as a function of the period of the country’s outbreak without mask recommendations or norms. The dotted line represents the best fit using least-squares linear regression. Data for graph derived from 198 countries.
Initial multivariable analyses
An initial multivariable analysis was conducted including all 198 countries. By multivariable linear regression, significant predictors of the logarithm of each country’s per-capita coronavirus mortality included: duration of infection in the country, duration of wearing masks (p<0.001), percentage of the population over age 60, and urbanization (all p≤0.009, Appendix Table A2). The model explained 46.4% of the variation in per-capita mortality (Table A2).
We also prepared a multivariable model to predict the logarithm of per-capita coronavirus mortality in the 194 countries with obesity data. In this model, lockdown, obesity, temperature, and urbanization were retained due to their plausibility as important factors (Table 3).
Predictors of (log) Country-wide Per-capita Coronavirus Mortality by May 9 by Multivariable Linear Regression in 194 Countries.
By multivariable linear regression, significant predictors of the logarithm of each country’s per-capita coronavirus mortality included: duration of infection in the country, duration of wearing masks, and percentage of the population over age 60 (all p<0.001, Table 3). The association of obesity with increased mortality approached statistical significance (p=0.053, Table 3). When controlling for the duration of infection in the country, there appeared to be a negative association between time in lockdown and per-capita mortality, but this association was not statistically significant (p=0.43) (Table 3). The model explained 51.5% of the variation in per-capita mortality.
In countries not recommending masks, the per-capita mortality tended to increase each week by a factor of 1.543, or 54.3%. In contrast, in countries recommending masks, the per-capita mortality tended to increase each week by a factor of 1.5433 * 0.6997 = 1.080, or just 8.0%. Under lockdown (without masks), the per-capita mortality increased each week by (1.5433)(0.9402) = 1.451, or 45.1%, i.e. slightly less than the baseline condition (Table 3).
A country with 10% more of its population living in an urban environment than another country tended to suffer a mortality 13.8% higher (100.0560 = 1.138, Table 3). A country in which the percentage of the population age 60 or over is 10% higher than in another country tended to suffer mortality 203% higher (100.48 = 3.03, Table 3). A country with a prevalence of obesity 10% higher tended to suffer mortality 48% higher (100.17 = 1.48, Table 3).
Numbers of Viral Tests
Among the 183 countries with viral (PCR) testing data by May 9, per-capita testing performed at all 3 time points was positively associated with per-capita mortality in univariate analysis (all p<0.001, Table 1). By May 9, 2020, low-mortality countries had performed 1 test for every 575 members of the population, while high-mortality countries had performed 1 test for every 81 members of the population (p<0.001, Table 1).
To the multivariable model (Table 3), we added testing by May 9, using data from 179 countries with both testing and obesity data. Duration of infection in the country, the duration that masks were recommended, and age at least 60 years continued to be significant predictors of per-capita mortality (all p≤0.001, Appendix Table A3). The model explained 51.5% of the variation in per-capita mortality. Each week the infection persisted in a country without masks was associated with a 56.2% increase in per-capita mortality (Table A3). In contrast, in countries where masks were recommended, the per-capita mortality tended to increase each week by 11.7% (because (1.5618)(0.7150) = 1.117, Table A3). In this model, the prevalence of obesity was significantly associated with country-wide per-capita mortality (p=0.02). If the prevalence of obesity increased by 10% (e.g. from 10% to 20% of a population), the per-capita mortality tended to increase by 66% (Appendix Table A3)
In this model, a 10-fold increase (i.e. one logarithm) in per-capita testing tended to be associated with a 10.7% increase in reported per-capita mortality, though the trend was not close to reaching statistical significance (p=0.70, Appendix Table A3). Duration of the infection in the country, time during the outbreak in which masks were recommended, and the fraction of the population over age 60 were all still significant predictors of mortality (all p≤0.001, Appendix Table A3).
If early testing lowers mortality, one might expect negative regression coefficients. Testing on both April 16 and May 9 were added to the multivariable model of Table 3, using data from the 158 countries with both obesity and testing data by these dates. Per-capita testing (log) by April 16 was not negatively associated with per-capita mortality (log) by May 9 (coefficient 0.387, 95% CI −0.204 to 0.978, p=0.20).
Likewise, testing on both April 4 (the earliest archived data) and May 9 were added to the multivariable model of Table 3, using data from the 131 countries with both obesity and testing data by these dates. Per-capita testing (log) by April 4 was not significantly associated with per-capita mortality (log) by May 9 (coefficient −0.014, 95% CI −0.335 to 0.307, p=0.93). Given the coefficient, a 10-fold (one log) increase in early testing would be associated with a (non-significant) decrease in per-capita mortality of 3.2%.
Only 5 countries had performed over 1 test for every 10 people in the country by May 9, 2020 (in order of most testing to least): the Faeroe Islands, Iceland, the Falkland Islands, the UAE, and Bahrain. The Faeroe and Falkland Islands reported no coronavirus-related deaths. The remaining 3 countries had per-capita mortality above the median value. The highest per-capita mortality among this group was 29.0 per million population (or 1 in 34,480 people), seen in Iceland.
Containment and Testing Policies
For 161 countries, containment, testing, and health policies were scored by Oxford University.54 The following countries with mask policies by April 16 were included in this analysis, but not in the previous multivariable model, for lack of data on numbers of tests performed: China, Macau, Cameroon, Sierra Leone, and Sudan. In univariate analysis, scores for school closing, cancelling public events, restrictions on gatherings, and international travel controls were significantly associated with lower per-capita mortality (all p<=0.03, Table 4). Policies regarding workplace closing, closing public transport, stay at home requirements, internal movement restrictions, public information campaigns, testing, and contact tracing were not significant predictors of mortality (all p>0.05, Table 4). Likewise, overall indices of stringency, government response, and containment and health were not associated with mortality (all p>0.05, Table 4).
Government policies in 161 countries with low and high per-capita coronavirus mortality by May 9, 2020.
A multivariable model in 161 countries found that duration of the infection, duration masks were recommended, prevalence of age at least 60 years, obesity, and international travel restrictions were independently predictive of per-capita mortality (Table 5). The model explained 67.0% of the variation in per-capita mortality. At baseline, each week of the infection in a country was associated with an increase in per-capita mortality of 29.5% (Table 5). In contrast, when masks were worn, the per-capita mortality decreased by 1.5% each week (given that 1.2949(0.7610) = 0.985, Table 5).
Predictors of (log) Country-wide Per-capita Coronavirus Mortality by May 9 by Multivariable Linear Regression in 161 Countries.
International travel restrictions were scored by Oxford as: (0) no measures, (1) screening, (2) quarantine arrivals from high-risk regions; and ban on arrivals from some (3) or all (4) regions. The regression analysis suggested that as compared with no border controls, a complete ban on entries from abroad was associated with a change in mortality of 104*(−0.210) = 0.14, meaning an 86% reduction in per-capita mortality (Table 5). The international travel restrictions were scored as 4 in Greenland, 3.8 in Bermuda, 3.6 in Israel, 3.5 in Czechia and New Zealand, and 3.1 in Taiwan, and at the other extreme, were scored as 1.1 in Sweden, and as 0 in Iran, Luxembourg, and the UK.
Per-capita mortality was not significantly associated with policies regarding either testing policy (p=0.52), or contact tracing (p=0.11, Table 5). Testing policy was scored as: no policy (0), symptomatic with exposure, travel history, hospitalization, or key occupation (1), all symptomatic (2), or open to anyone (3). Testing policy tended to be positively associated with mortality. Contact tracing was scored as: none (0), some cases (1), or all cases (2), and tended to be inversely related with per-capita mortality (though not significantly). These countervailing associations meant that as compared with a country with no testing or tracing policy, a country which opened testing to the entire public with comprehensive contact tracing might be associated with a reported change in mortality of 10(3*0.0701+2*(−0.152)) = 0.806, i.e. a 19.4% reduction in per-capita mortality (though statistical significance was not demonstrated). Thus, testing and tracing seem unlikely to account for the almost 100-fold variation in per-capita mortality between low and high mortality countries.
Discussion
These results confirm that over 4 months since the appearance of COVID-19 in late 2019, there is marked variation between countries in related mortality. Countries in the lower half of mortality have experienced an average COVID-19-related per-capita mortality of 1.1 deaths per million population, in contrast with an average of 94.2 deaths per million in the remaining countries. Depending on the model and dataset evaluated, statistically significant independent predictors of per-capita mortality included urbanization, fraction of the population age 60 years or over, prevalence of obesity, duration of the outbreak in the country, international travel restrictions, and the period of the outbreak subject to cultural norms or government policies favoring mask-wearing by the public.
These results support the universal wearing of masks by the public to suppress the spread of the coronavirus.1 Given the low levels of coronavirus mortality seen in the Asian countries which adopted widespread public mask usage early in the outbreak, it seems highly unlikely that masks are harmful.
One major limitation is that evidence concerning the actual prevalence of mask-wearing by the public are unavailable for most countries. Available scholarship does corroborate reports in the news media that mask wear was common in public in many Asian countries. For instance, in Hong Kong in February 2020, 94.8% of pedestrians were observed to wear masks, and 94.1% believed mass masking reduces the chance of community outbreak.128 In Vietnam, from March 31 to April 6, 2020, 99.5% of respondents reported using a mask when outside.129 Mask wear was widespread in some low-mortality countries even before, or in the absence of, a formal government recommendation. There is evidence of early mask-wearing by the public or schoolchildren in Nepal well before March 25, and in Sri Lanka,130 and the Gambia.131,132 Had these countries been scored as mask-wearing from the start of their outbreaks, the association of masks with lower mortality would be even stronger. Conversely, in Western countries which had no tradition of mask-wearing, and which only recommended (rather than mandated) mask-wearing by the public, such as the United States, the practice has been steadily increasing, but change has not been immediate. From April 14-20, several weeks after the government recommended mask wear, 36% of U.S. adults always wore a mask outside the home, 32% did so sometimes, and 31% never did.133 Our analysis based on norms and policies can be compared with “intention-to-treat” analysis in a clinical trial.
Much of the randomized controlled data on the effect of mask-wearing on the spread of respiratory viruses relates to influenza. One recent meta-analysis of 10 trials in families, students, or religious pilgrims found that the relative risk for influenza with the use of face masks was 0.78, a 22% reduction, though the findings were not statistically significant.48 Combining all the trials, there were 29 cases in groups assigned to wear masks, compared with 51 cases in control groups.48 The direct applicability of these results to mask-wearing at the population level is uncertain. For instance, there was some heterogeneity in methods of the component trials, with one trial assigning mask wearing to the person with a respiratory illness, another to his close contacts, and the remainder to both the ill and their contacts.48 Mask-wearing was inconsistent. The groups living together could not wear a mask when bathing, sleeping, eating, or brushing teeth.49-51 In one of the studies reviewed, parents wore a mask during the day, but not at night when sleeping next to their sick child.51 In a different trial, students were asked to wear a mask in their residence hall for at least 6 hours daily (rather than all the time).49 The bottom line is that it is nearly impossible for people to constantly maintain mask wear around the people with whom they live. In contrast, wearing a mask when on public transit or shopping is quite feasible. In addition, as an infection propagates through multiple generations in the population, the benefits multiply exponentially. Even if one accepts that masks would only reduce transmissions by 22%, then after 10 cycles of the infection, mask-wearing would reduce the level of infection in the population by 91.7%, as compared with a non-mask wearing population, at least during the period of exponential growth (because 0.7810 = 0.083). It is highly unlikely that entire countries or populations will ever be randomized to either wear, or not wear, masks. Public policies can only be formulated based on the best evidence available.
Limits on international travel were significantly associated with lower per-capita mortality from coronavirus. As compared with no restrictions, complete shutdown of the border throughout the outbreak was independently associated with 86% lower per-capita mortality.
Nationwide policies to ban large gatherings and to close schools or businesses, tended to be associated with lower mortality, though not in a statistically significant fashion. However, businesses, schools, and individuals made decisions to limit contact, independent of any government policies. The adoption of numerous public health policies at the same time can make it difficult to tease out the relative importance of each.
Colder average monthly temperature was associated with higher levels of COVID-19 mortality in univariate analysis, but not when accounting for other independent variables. One reason that outdoor temperature might have limited association with the spread of the virus is that most viral transmission occurs indoors.134 We acknowledge that using the average temperature in the country’s largest city during the outbreak does not model the outbreak as precisely as modelling mortality and temperature separately in each of the thousands of cities around the world. However, to a first approximation, our method did serve to control for whether the country’s climate was tropical, temperate, or polar, and whether the outbreak began in late Winter (Northern hemisphere) or late Summer (Southern hemisphere). Environmental factors which could influence either human behavior or the stability and spread of virus particles are worthy of further study.
Presumably, high levels of testing might identify essentially all coronavirus-related deaths, and still higher levels of testing, combined with contact tracing, might lower mortality. However, statistical support for the benefit of testing and tracing on mortality could not be demonstrated. Policies on testing and tracing were not significantly associated with mortality. In addition, per-capita testing both early (April 4, 16) and later (May 9) were positively associated with reported coronavirus-related mortality. It seems likely that countries which test at a low level are missing many cases. We previously identified just 3 countries (Iceland, the Faeroe Islands, and the UAE) which had performed over 75,000 tests per million population by April 16, and all 3 had mortality below 1 in 46,000 at that point.53 By May 9, we could add to this “high-testing” group, the Falkland Islands and Bahrain, as all 5 countries had tested over one tenth of their population. All 5 countries had a mortality of 29 per million (1 in 34,480 people) or less. The degree to which these results would apply to larger, less isolated, or less wealthy countries is unknown. Statistical support for benefit of high levels of testing might be demonstrated if additional and more diverse countries are able to test at this level.
One limitation of our study is that the ultimate source of mortality data is often from governments which may not have the resources to provide a full accounting of their public health crises, or an interest in doing so. It should be noted that the benefit of wearing masks persisted in a model which excluded data from China (because no testing data were available, Appendix Table A3). We also acknowledge that countrywide analyses are subject to the ecologic fallacy.
The source for mortality and testing data we selected is publicly available,7 has been repeatedly archived,8 contains links to the source government reports for each country, and agrees with other coronavirus aggregator sites.135,136 One might question whether any of these data sites or governments provide a complete and accurate picture of coronavirus mortality. But we must remember that this information does not exist in a vacuum. Independent sources confirm when mortality has been high. Social media alerted the world to the outbreaks in Wuhan, Iran, Italy, and New York. News reports have used aerial photography to confirm the digging of graves in Iran, New York, and Brazil. Long lines were seen to retrieve remains at crematoria in Wuhan. Mortuary facilities were inadequate to meet the demand in New York, and Guayaquil.137 Conversely, signs of health system overload have been noted to be absent in the countries reporting low mortality. The health systems in Hong Kong, Taiwan, Japan, and South Korea are believed to be transparent. Reporters in Vietnam have even called hospitals and funeral homes to confirm the absence of unusual levels of activity.138 Therefore, while no data source is perfect, we believe that the data used in the paper are consistent with observations from nongovernmental sources, and are comparable in reliability to those in other scholarly works.
It is not the case that countries which reported no deaths due to coronavirus simply were not exposed to the virus. All 198 countries analyzed did report COVID-19 cases. Several countries which traditionally use masks and sustained low mortality (or none) are close to and have strong travel links to China. Some of these countries reported cases early in the global pandemic (Table 2). Community transmission has been described in Vietnam.129
In summary, older age of the population, urbanization, obesity, and longer duration of the outbreak in a country were independently associated with higher country-wide per-capita coronavirus mortality. International travel restrictions were associated with lower per-capita mortality. However, other containment measures, testing and tracing polices, and the amount of viral testing were not statistically significant predictors of country-wide coronavirus mortality, after controlling for other predictors. In contrast, societal norms and government policies supporting mask-wearing by the public were independently associated with lower per-capita mortality from COVID-19. The use of masks in public is an important and readily modifiable public health measure.
Data Availability
Data can be requested from the first author.
Funding
None.
Disclosures
The authors have no conflicts of interest.
Appendix. Supplemental Analyses
Predictors of (log) Country-wide Per-capita Coronavirus Mortality by May 9 by Univariate Linear Regression in 198 Countries.
Predictors of (log) Country-wide Per-capita Coronavirus Mortality by May 9 by Multivariable Linear Regression in 198 Countries.
Predictors of (log) Country-wide Per-capita Coronavirus Mortality by May 9 by Multivariable Linear Regression in 179 Countries.
References
- 1.↵
- 2.↵
- 3.↵
- 4.↵
- 5.↵
- 6.↵
- 7.↵
- 8.↵
- 9.↵
- 10.↵
- 11.↵
- 12.↵
- 13.↵
- 14.↵
- 15.↵
- 16.↵
- 17.
- 18.
- 19.↵
- 20.↵
- 21.↵
- 22.↵
- 23.↵
- 24.↵
- 25.↵
- 26.↵
- 27.↵
- 28.↵
- 29.↵
- 30.↵
- 31.↵
- 32.↵
- 33.↵
- 34.↵
- 35.↵
- 36.↵
- 37.↵
- 38.↵
- 39.↵
- 40.↵
- 41.↵
- 42.↵
- 43.↵
- 44.↵
- 45.↵
- 46.↵
- 47.↵
- 48.↵
- 49.↵
- 50.
- 51.↵
- 53.↵
- 54.↵
- 55.↵
- 56.↵
- 57.↵
- 58.
- 59.
- 60.
- 61.
- 62.
- 63.
- 64.
- 65.
- 66.
- 67.
- 68.
- 69.
- 70.
- 71.
- 72.
- 73.
- 74.
- 75.
- 76.↵
- 77.↵
- 78.↵
- 79.↵
- 80.↵
- 81.↵
- 82.↵
- 83.↵
- 84.↵
- 85.↵
- 86.↵
- 87.
- 88.↵
- 89.↵
- 90.↵
- 91.↵
- 92.↵
- 93.↵
- 94.↵
- 95.↵
- 96.↵
- 97.↵
- 98.↵
- 99.↵
- 100.↵
- 101.↵
- 102.↵
- 103.↵
- 104.↵
- 105.↵
- 106.↵
- 107.↵
- 108.↵
- 109.↵
- 110.↵
- 111.↵
- 112.
- 113.
- 114.
- 115.
- 116.
- 117.
- 118.
- 119.
- 120.
- 121.
- 122.↵
- 123.
- 124.↵
- 125.
- 126.
- 127.
- 128.↵
- 129.↵
- 130.↵
- 131.↵
- 132.↵
- 133.↵
- 134.↵
- 135.↵
- ↵


