
Abstract
Inter-individual differences can inform treatment procedures and - if accounted for - can significantly improve patient outcomes. However, when studying brain anatomy, these inter- individual variations are largely unaccounted for, despite reports of differences in gross anatomical features, cross-sectional and connectional anatomy. Brain connections are essential to mediate brain functional organisation and, when severed, cause functional impairments or complete loss of function. Hence the study of cerebral white matter may be an ideal compromise to capture inter-individual variability in structure and function. Here we reviewed the wealth of studies that associate functions and clinical symptoms with individual tracts using diffusion tractography. Our systematic review indicates that tractography has proven to be a sensitive method in neurology, psychiatry and healthy populations to identify variability and its functional correlates. However, the literature may be biased, as we identified that the most commonly reported tracts are not necessarily those with the highest sensitivity to cognitive functions and pathologies. Finally, we demonstrate that tracts, as we define them, are not usually correlated with only one, but rather multiple cognitive domains or pathologies. While our systematic review identified some methodological caveats, it also suggests that tract-function correlations might be a promising biomarker for precision medicine as it characterises variations in brain anatomy, differences in functional organisation and predict resilience or recovery in patients.
Introduction
If one stopped in a busy street and observed the passers-by, you would be hard-pressed not to observe that people are different. These differences in appearance, opinions, creativity and morals have created the richness of society. Individuals of different races, ethnicities, religious beliefs, socioeconomic status, language and geographical origins have formed an inclusive and diverse community. In the medical world, inter-individual differences have long been a topic of study, and manifest as phenotypic appearances (e.g. eye colour) driven by genetic phenotypes. For example, depending on our phenotype encoded by certain genes, we have different blood types or metabolic rates for drug absorption (e.g. McDonnal & Hang, 2013). Interindividual differences help to inform treatment procedures and accounting for them has already greatly improved patient outcomes and saved lives. Within any given population, there are potentially multiple sources of phenotypic variation. However, when turning to differences in brain anatomy, these inter-individual variations are relatively understudied (Glasser et al., 2016). Although it is well known that there are inter-individual differences in brain anatomy (e.g. Hirsch, 1963; Ono et al., 1990), the possibility of studying such variability across large populations and associating it with functional correlates has only become possible relatively recently, with the advent of non-invasive neuroimaging methods (Kanai & Rees, 2011). The current neuroimaging literature is primarily based on the assumption that all brains are the same. Most results are depicted as group averages on template brains where inter-individual variability is merely seen as a deviation from the mean or considered to be a pathological change. Certainly, employing an atlas-based approach is a valid method from a neuroimaging perspective, yet it has limitations in taking into account potentially relevant anatomical variability.
Studying inter-individual differences in the living human brain on a large scale has produced intriguing results so far. Neuroimaging sequences are highly sensitive for measuring the structure and function of the brain, both of which vary between individuals (Grasby et al., 2020; Tavor et al., 2016). On a structural level, measures of cortical surface area and thickness vary considerably within the population (Kong et al. 2018). Brain morphology is also not consistent across individuals: for example, half of the population have an additional gyrus above the cingulate, the paracingulate gyrus, in at least one hemisphere (Fornito et al., 2008). Even regions with clearly defined functions such as primary motor, auditory and visual cortices, are subject to anatomical variations (Uylings et al., 2005; Caulo et al., 2005; Leonard et al., 1998; Eichert et al., under review). Likewise, the most prominent language- relevant area in the inferior frontal gyrus is an area of high inter-individual variability in terms of its cytoarchitectonic boundaries (Amunts et a., 1999). This body of literature indicates a large amount of structural variability exists in primary cortical areas and associative cortices, but it is as yet unclear how these structural alterations relate to observable behaviour and cognitive measures.
A better understanding of variability is crucial to better recognise the underlying neuronal scaffold. While the cerebral white matter may not be a functional agent per se (see Innocenti et al. 2017; Rockland 2020 for discussion), it constrains the brain’s functional organisation (Bouhali et al., 2014; Thiebaut de Schotten et al., 2017) and leads to functional impairment or complete loss of function when severed (Geschwind et al. 1965ab). Hence the study of the cerebral white matter, or connectional anatomy, may be an ideal surrogate measure to capture inter-individual variability in structure and function. In the last 15 years, diffusion tractography has become an established non-invasive quantitative method to study connectional anatomy in the living human brain (for reviews see Assaf et al., 2017; Jbabdi & Johanson-Berg, 2011). Tractography has widely been employed as a neuroimaging biomarker to link white matter phenotypes to cognition and clinical presentations and these inter- individual differences are beginning to explain the observed variance in cognitive and behavioural measures. Phenotypes in this instance are considered to be interindividual variability in the appearance and structure of white matter networks. Phenotypes are defined as the product of an environment-genotype interaction. White matter tracts, and in particular language and limbic networks, have been shown to be sensitive to such interactions (Su et al., 2020; Budisaljevic et al., 2016; Budisaljevic et al., 2015). Consequently, white matter is subject to natural variations over the lifespan and changes as a result of training (Scholtz et al. 2009; Lebel et al., 2019; Thiebaut de Schotten et al., 2014; Vanderauwera et al., 2018). Tractography has been shown to be highly sensitive for capturing these variations, which can be associated with interindividual differences in neuropsychological measures in the healthy population (e.g. Catani et al., 2007, Thiebaut de Schotten et al. 2011; Howells et al. 2018) and clinical cohorts (e.g. Forkel et al., 2014; Forkel et al. 2020; Thompson 2017; Pacella et al. 2020). Tractography can, therefore, be employed as a method to study variability in the human brain and map the functional white matter correlates.
Finding consistent trends in the knowledge acquired from tractography studies is crucial to map white matter phenotypes and their impact on cognition, hence a systematic review is timely. We particularly focused on studies that describe significant correlations between structural and continuous cognitive measures in adults. For structure, we focused on volumetric or microstructural (e.g. fractional anisotropy, mean diffusivity etc.) measures of white matter pathways extracted from diffusion tractography. For behavioural measures, we focused on scores on neuropsychological tests or clinical scales in both healthy and pathological populations. In this review, we summarise dimensional differences in structural connectivity in relation to cognition as a step towards the systematic inclusion of inter- individual variability in neuroscience studies.
Methods
We undertook a systematic review of published journal articles that correlated measures derived from white matter tractography with cognition or clinical symptoms, following PRISMA guidelines (Liberati et al., 2009). The resources obtained from this study and created for this data are made available as supplementary material: https://github.com/StephForkel/PhenotypesReview.git
Data Sources
A title/abstract search in MEDLINE and Scopus (which includes most of the EMBASE database, https://www.elsevier.com/solutions/embase-biomedical-research) was conducted. The search term ‘tractography’ returned a total of 5,303 in PubMed and 7,204 results in Scopus. We hence restricted our search (conducted on February 25th, 2020) to the following strings: (predictor OR “correlat*” OR regression OR “assoc*”) AND (tractography). Additional filters were applied to include only human adult studies published in English as final stage peer-reviewed articles in scientific journals. The search returned 1333 results on Pubmed and 2380 results on Scopus yielding a combined total of 3,713 records. There were no internal duplicates within each database, but 1224 external duplicates were excluded between the databases. After removing duplicates from these lists a total of 2489 results were screened.
Data screening and eligibility
Figure 1 summarises the following workflow. During the screening, we applied further exclusion criteria leading to the exclusion of paediatric studies, non-human studies, pure methodological papers without behavioural correlates, correlations between tractography and physiological rather than behavioural measures, non-brain studies (e.g. cranial nerves, spine, muscle), graph theory and tract-based spatial statistics (TBSS) studies, and case studies or mini-series (less than 10 participants/patients) and papers that reported no significant correlation. All studies reporting variability of white matter pathways using tractography that described a significant association between these findings and continuous cognitive measures, or clinical symptom severity and/or continuous recovery were included. After screening of the abstracts, we retained a list of 466 references. The full text of these 466 papers was screened and if these mentioned any of the previous exclusion criteria they were further removed from the analysis. This led to a total of 326 studies included in the final analysis.

PRISMA flow chart.
Study quality
In the current study, we included all papers that reported tract-behaviour correlations regardless of the diffusion acquisition, pre-processing or processing algorithms used. To quantify the steps taken by each paper to avoid bias and to justify and validate the protocols, the QUADAS quality assessment tool (Whiting et al., 2003) was adapted for the current review. The following criteria were used to rate publications: 1) Sufficient detail provided to reproduce the protocol. 2) clearly defined white matter pathways. 3) A description of participant groups and cognitive measures or clinical characteristics were reported.
Data extraction
The following information was collected from the records: year of publication, group (e.g. healthy participants vs. degeneration vs. psychiatric vs. neurological vs. neurodevelopmental), sample sizes, left/right/unknown hemisphere, white matter pathways, clinical symptoms, behaviour and/or cognitive domain, differential neuropsychological measures (e.g. Trail Making test), and finally the interaction between white matter pathways and neuropsychological assessments.
Data synthesis and analyses
In the present synthesis of this dataset, we summarised degeneration, neurosurgical and common neurological symptoms (e.g. stroke) as a neurological group. Similarly, the psychiatric group included neurodevelopmental and psychiatric studies.
We also synthesized clinical symptoms, behaviour and/or cognitive domains using the following terms: We limited the cognitive domains taxonomy to the terms that are currently widely accepted, including attention, executive functions, language, memory, and reward. Similarly, terms defining behavioural domains included addiction, auditory, visual and motor behaviour, sleep, mood, social measures (e.g. theory of mind). In order to assess the sensitivity of tracts to clinical measures we also included a “symptoms” dimension corresponding to neurological and psychiatric severity measures.
The classification of the correlations according to domains was replicated three times by SJF, PF and HH and consensus solutions were adopted in cases of disagreements. From these terms, we could extract variables of interest such as the number of correlations per tract (i.e. sensitivity or how likely a tract can correlate), but also the number of studies reporting significant correlations for that tract (i.e. popularity or how often studies report a significant correlation for that tract). Subsequently, we also investigated the number of correlations reported according to the domains of interest mentioned above (i.e. specificity to cognitive domains: attention, executive functions, language, memory, and reward; behavioural domains: addiction, auditory, visual and motor behaviour, sleep, mood, social; and symptoms severity).
Results
The number of correlations and studies per tract
A total of 25 individual tracts were reported to correlate with performance on neuropsychological tests or clinical symptoms (Figure 2). Amongst these, certain pathways were more commonly correlated with cognitive-behavioural measures than others (Figure 2A). We report here the number of studies that report a given correlation (Figure 2A), but also the number of correlations per tract, which show a different pattern (Figure 2B). This is important as in certain studies, more than one tract correlation was reported. Importantly, the most reported tracts (i.e. sensitivity) were not always those that were most systematically studied (i.e. popularity) indicated by the different number of studies per tract reported (Figure 2B).

Frequencies of reported correlations (A) and the number of studies (B) per tract in each field of study (i.e. healthy participants, neurology, psychiatry). A high number of correlations indicates a high tract sensitivity and a high number of studies represents high tract popularity. Note: Where tracts have multiple branches, they are only shown under the umbrella name (e.g. three segments of the arcuate fasciculus are shown as arcuate).
Our review shows that the majority of correlations and studies have been conducted in patients with neurological or psychiatric pathologies rather than controls (Figure 2). Additionally, different tracts have been reported to correlate with measures classically obtained within each of these groups. For example, most correlations reported in healthy participants were with the inferior longitudinal fasciculus, arcuate fasciculus, and striatal fibres (Figure 3A). In the neurological groups, most results were described for the corticospinal tract, the corpus callosum, and the cingulum (Figure 3B). The cingulum, arcuate fasciculus, and uncinate fasciculus were the most commonly reported tracts to correlate with psychiatric symptoms (Figure 3C). The most correlated (i.e. sensitivity), however, does not mean the most commonly studied pathways (i.e. popularity). In healthy participants, the most 7/24 popular tracts were the arcuate fasciculus, inferior longitudinal fasciculus, and uncinate fasciculus (Figure 3D). For the neurological group, the most studied tracts were the same as the most correlated tracts (Figure 3E). In the psychiatric group, the order of the most studied tracts differed from the most correlated tracts and showed the highest load for the cingulum, arcuate fasciculus and uncinate (Figure 3F).

“Tract bias” in the literature. Frequencies of tract sensitivity (A-C) and tract popularity (D-F) in healthy participants, neurology and psychiatry.
The number of correlations per domains of interest
The analysis of the studied domains and the correlated pathways identified there was no one-to-one correspondence between white matter tracts and their domains (Figure 4). The pathways with the clearest selectivity to one domain were the corticospinal tract for the motor domain and the cingulum for measures of executive functions (Figure 4). Figures showing the number of correlations per domain for all tracts are available in the supplementary material (https://github.com/StephForkel/PhenotypesReview.git), here, we are only reporting the cognitive loads of the most commonly correlated pathways. The level of selectivity to one domain is also often related to the diversity of projection of the tract. For instance, the corpus callosum, which projects on most of the surface of the brain (Karolis et al., 2019) was reported to be associated with all domains. Smaller tracts such as the entire arcuate fasciculus were also reported to be involved in all domains but with a stronger load on language measures and aphasic symptoms. To test the hypothesis that specificity of the domains of correlation might be driven by the level of precision of the dissection of the tracts, we further analysed correlation results reported for the three individual segments of the arcuate fasciculus. This analysis revealed that the higher domain specificity of the overall arcuate with language was mainly driven by the long segment, while the other segments had a stronger load on memory and attention (Figure 4).
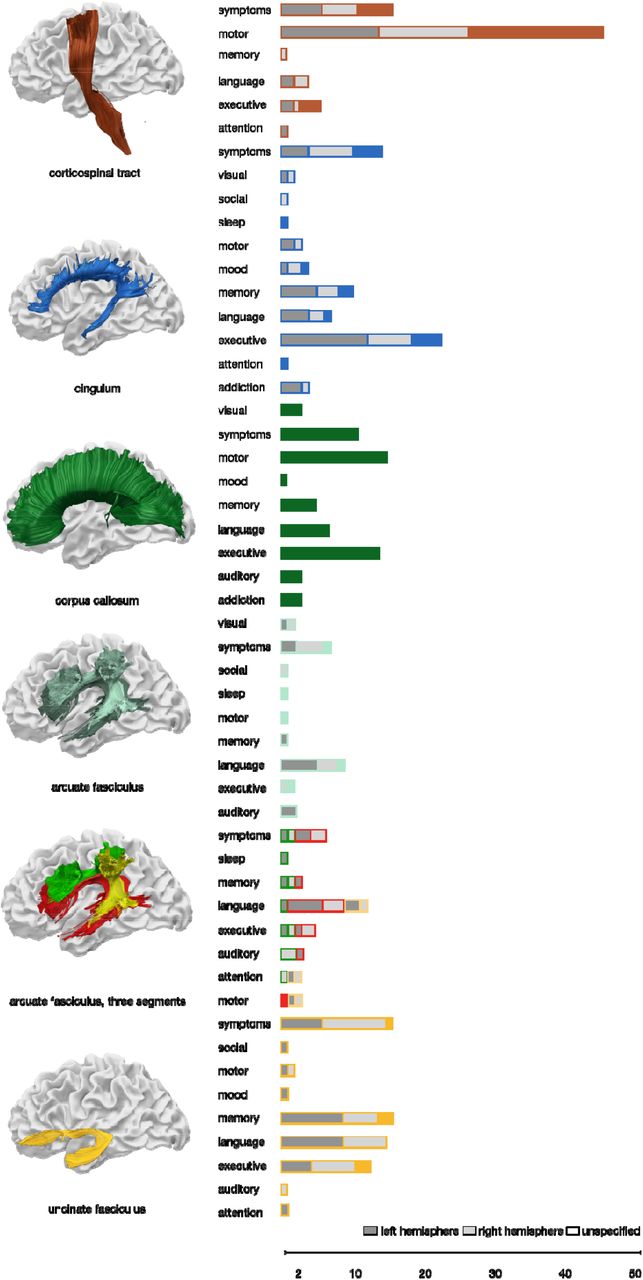
The number of correlations between cognitive, behavioural or clinical assessments and white matter tracts reveals that the concept of ‘one tract-one function’ does not hold true. The figure shows the most studied tracts as identified by the current study. The other tract-domain correlations are available as supplementary figures (see supplementary figure S1).
Hemispheric specialisation
The analysis highlighted that the current body of literature is inconsistently specifying the studied hemisphere explicitly. Amongst the 326 resources, a total of 674 significant tract-function correlations were reported. Within this data pool, an equal amount of studies specified if their correlations referred to the left hemisphere (37.38%) or the right hemisphere (35.01%), while the remaining results 27.60% (n=186) were unspecified. Within the latter group, 64 results were reporting correlation with commissural tracts where the hemisphere may not be as relevant. The remaining results, however, which represent 122 of 674 correlations (18.10%) were describing association tracts (n = 45; 6.68%) or projection fibres (n = 77; 11.42%) where it would indeed make a difference if the correlations are reported within one or the other hemisphere. Our analysis on the remaining results identified that some functions might be dominant in one hemisphere typically concerning the language domain for the left hemisphere and the arcuate fasciculus but also executive functions and the right cingulum and the right uncinate fasciculus (Figure 4).
Discussion
The last fifteen years of investigation on correlations between white matter tracts and functions have yielded 326 studies in human adults. These correlations indicate the existence of inter-individual differences in healthy participants and across brain pathologies. Our systematic review of these findings highlights three main observations. Tractography has been used to study inter-individual variability in many populations and has proven to be a sensitive method in neurology, psychiatry and healthy populations to identify variability and its functional correlates. Secondly, we observed that there is a “tract bias” in the literature, meaning that the pathways that yield the greatest numbers of correlations with behaviour are not necessarily those with the highest sensitivity for specific cognitive functions and pathologies. Finally, our review demonstrates that tracts, as we define them, are not usually correlated with only one, but rather multiple cognitive domains or pathologies.
Our investigation objectively collated tract-function correlations across neurological, psychiatric and healthy populations. However, more results were reported in pathological cohorts than in healthy participants (Figure 3). The dominance of pathological cohorts in the field of correlational tractography may originate from the broader dispersity of the data points associated with pathology. Indeed, the presence of pathology causes higher variability in both structure and function, which is more likely to be detected with a linear correlation and could have produced a publication bias. Another consideration may be that differences between healthy participants are considered to be noise by most research teams. While noise may contribute to the difference observed in controls it is now clearly established that diffusion- weighted imaging tractography can capture inter-individual differences that reflect some of the variations in the functioning of the brain (e.g. Powell et al., 2006; Vernooij et al., 2007 for language lateralisation). An alternative hypothesis could be that current neuroimaging methods or cognitive and behavioural tests are not sensitive enough to systematically disentangle noise from true variability in healthy participants. The latter may be improved by using finer-grained cognitive measures, higher resolution data, and better anatomical tract definitions.
Some pathways were clearly more sensitive than others. Our review identified a total of 25 tracts that were significantly correlated with cognitive measures or symptom severity in clinical cohorts and healthy participants. While the precise number of white matter tracts in the human brain remains unknown and changes depending on the methods used, current atlases indicate a total of around 26 tracts that can be reliably identified with most tractography methods (Mori, 2005; Lawes et al., 2008; Catani & Thiebaut de Schotten, 2008; Mori et al., 2009; Thiebaut de Schotten et al., 2011; Rojkova et al., 2016) with some recent atlases further identifying additional intralobar connections (Catani et al., 2012; Guevara et al., 2012; Catani et al., 2017; Guevara et al., 2020). Some pathways identified by our systematic review have not even been incorporated into atlases, which includes the accumbofrontal tract and the vertical occipital fasciculus (Martínez-Molina et al. 2019; Rigoard et al., 2011, Vergani et al., 2016; Yeatman et al., 2013; Vergani et al., 2014). This discrepancy between our findings and current atlases highlights a potential tract bias in the literature towards studying specific pathways that either have very well-established functions (e.g. corticospinal tract, arcuate fasciculus) or easy to dissect in clinical cohorts (e.g. cingulum). This, however, does not necessitate that the other tracts are not functionally relevant or might show correlations with other non-routinely tested cognitive and behavioural measures. Some of these understudied pathways may be more challenging to reconstruct due to limited anatomical guidelines or available algorithms (e.g. U-shaped fibres, Attar et al., 2020) or they may be harder to reconstruct (Mandelstam, 2012; Maffei et al., 2019a; 2019b). For the most sensitive tracts, several functions were reported. Even the corticospinal tract, which was primarily studied within the motor domain (62.21% of correlations, Figure 4), presented with a non-uniform functional profile. For instance, some studies reported associations of the corticospinal tract with executive functions (8.11%) and language/speech processes (5.4%). For other tracts, the correlations were even more diverse. For example, the cingulum correlated with psychiatric symptom severity (20.29%), memory (14.49%) and language measures (10.14%). Such results could support the idea of a hierarchical brain organisation with some tracts involved in mediating many functions, whereas others are more specific, although this requires dedicated study (Pandya and Yeterian 1990). While the number of associations is likely to be biased by a number of factors including prior hypotheses that a given tract is involved in a specific function, a complementary study has recently mapped 590 cognitive functions, as defined by a meta-analysis of BOLD activation derived from fMRI paradigms, onto an extensive white matter atlas (Thiebaut de Schotten et al., 2020). This functional white matter atlas reveals similar findings as observed in our data and highlights that one pathway can be relevant for multiple functions. Another possible interpretation of this finding would be that the definition of white matter tracts as we know it is too coarse to be specific to only one given function. As shown in our result, the three segments of the arcuate fasciculus (Catani et al., 2005) were more domain-specific than the entire arcuate fasciculus. This calls for a finer-grained white matter division or more data- driven approaches to identify the portion of white matter related to specific functions (see for example Foulon et al., 2018).
In addition, there is a differential pattern emerging between healthy participants and pathological groups. One such example is the uncinate fasciculus that has been primarily associated with memory in healthy ageing (Sasson et al., 2013), with psychopathy in psychiatric studies (e.g. Craig et al, 2009), and language in neurological studies (e.g. D’Anna et al., 2016). Similarly, the arcuate fasciculus has been implicated in learning new words in healthy participants (Lopez-Barroso et al., 2013), auditory hallucinations in schizophrenia (Catani et al., 2011), and aphasia severity after stroke (Forkel et al., 2014). The functions associated with a pathway might therefore not purely be a product of the cortical regions the white matter connects to but rather rely on the interplay of one region with another. When pathology is introduced into this delicate network, for example by a lesion, the differential symptom pattern may reflect effects on different brain regions that are weighted differently. Furthermore, the pathophysiological mechanisms are different across pathologies and have different long-range effects on connected regions (for a review see Catani and ffytche, 2005).
There are tractography limitations that may have influenced the studies in the current work. First, it is important to remember what tractography can and cannot do when interpreting results. While tractography has proven useful for research and clinical applications, the interpretation of voxel-based indices presents challenges (Dell’Acqua & Tournier, 2019). For example, diffusion indices are averaged across and within voxels, which may mask meaningful changes. For research acquisitions, the voxel size is typically 2*2*2mm, while the voxel sizes are often larger for clinical data leading to even lower spatial resolution. An 8mm3 voxel is likely to contain an inhomogeneous sample of tissue classes, intra- and extracellular space, and axons of different density and diameter, which poses particular challenges for the study of projection and commissural fibres. The diffusion signal is also inhomogeneous across the brain, and areas such as the orbitofrontal cortex and anterior temporal cortex are often distorted. Methodological advances, however, partially correct for these distortions and disentangle some of these components and crossing fibres to extract tract-specific measurements (see Dell’Acqua & Tournier, 2019). While recent research studies have methodological means to mitigate such distortions (e.g. TOPUP, Andersson et al., 2003), most current clinical studies still suffer from these limitations thus potentially explaining the lack of tract-domain specificity.
Another source of inconsistencies originates from incoherent reporting of the anatomy. For example, 18% of records did not specify which hemisphere was studied or collapsed their white matter measures across both hemispheres and correlated this average with behaviour. Collapsing measurements from anatomical feature across both hemispheres might prove problematic for white matter pathways that are subject to larger inter-individual variability and might get over- and underrepresented in each hemisphere (e.g. Catani et al., 2007; Thiebaut de Schotten et al., 2011; Rojkova et al. 2016, Croxson et al., 2018; Howells et al. 2020). Further, while the concept of a strict hemispheric dichotomy might be seen as overly simplistic (e.g. Vingerhoets, 2019), splitting the measurements by hemisphere may reveal useful insights and higher specificity into the contribution of either side to a measured cognitive behaviour. Another limitation comes from the inconsistencies in the classification of white matter pathways. For instance, the superior longitudinal fasciculus (SLF) was often considered without specifying which branch was studied. When the branches were specified, there was a variety of terminologies, including the three branches SLFI-III (Thiebaut de Schotten et al., 2011), or a lobar separation of an SLFtp (temporal projections) and SLFpt (parietal projections) (e.g. Nakajima et al. 2019). Similarly, the arcuate was either considered in its entirety or was split into several branches, classified as the long, anterior, and posterior segments or the horizontal and vertical branches (e.g. Catani et al., 2005; Kaplan et al., 2010). Originating from early anatomical papers, we are still faced with a body of literature that uses the terms SLF and arcuate interchangeably. While there is some overlap between both networks, for example between the SLF-III and the anterior segment of the arcuate fasciculus, other branches and segments are distinct. From an anatomical and etymological perspective, the superior longitudinal fasciculus should be considered to be solely those fibres connecting frontal and parietal regions (i.e. “superior and longitudinal”; Thiebaut de Schotten et al., 2011) whereas the arcuate fasciculus should be considered to be the fronto-temporal connection (i.e. ‘arcuatus’ translates to ‘arching’ around the Sylvian fissure; Catani et al., 2005). Another example is the differential and synonymous use of the terminologies external capsule (Rilling et al., 2012), external/extreme fibre complex (Mars et al., 2016), inferior fronto-occipital fasciculus (Forkel et al., 2014), and inferior occipitofrontal fasciculus (Kier et al., 2004). The difference in terminology is largely owed to the description of these pathways using different methods (Forkel et al., 2014) and a consensus is needed (Maier-Hein et al., 2017; Mandonnet et al., 2018).
Additionally, to harvest these interindividual variability results, this review focused on continuous measures to associate white matter phenotypes with cognition and clinical symptoms. As such, we did not separate biological subtypes (e.g. Ferreiera et al. 2020; Forkel et al., 2020) and did not take different diffusion matrices (e.g. fractional anisotropy and mean diffusivity) or tractography algorithms (e.g. deterministic and probabilistic) into account. Some of these parameters might be more sensitive and specific than others but some were underrepresented in our systematic review preventing any valid comparison. Finally, while correlational research indicates that there may be a relationship between two variables (e.g. structure and function), it cannot prove that one variable causes a change in another variable. This means that it is impossible to determine from this type of data whether anatomical variability is driving behaviour or if the anatomy is a result of an expressed behaviour (i.e. the directionality problem). It is also not possible to know whether a third factor is mediating the changes in both variables and that in fact the two variables are not related (i.e. the ‘third variable problem’). While this question is beyond the scope of the current study, ideally, future research could explore another statistical framework to assess causal relationships between the variables (Pacella et al., 2019).
All in all, acknowledging and objectively quantifying the degree of variability between each of us, particularly when it comes to brain anatomy, will potentially have a far-reaching impact on clinical practice. While some methodological refinement is needed in the field of white matter tractography (Wasserthal et al., 2018; Maier-Hein et al., 2017), preliminary evidence indicates that variations in white matter anatomy can show disease progression or explain differential patterns of symptoms (Forkel et al., 2020). Differences in brain connections can also shed light on why current invasive and non-invasive treatments and therapies are helping some but not all patients (Lunven et al., 2019; Parlatini et al., under review; Sanefuji et al., 2017). These findings are encouraging, as we move towards personalised medicine. Tract-function correlations, with the improvements suggested in this systematic review, could be the right candidate to predict resilience and recovery in patients.
Funding
European Union’s Horizon 2020 research and innovation programme grant agreement No. 818521
Competing interests
The authors declare no conflict of interest.
Supplementary material
Acknowledgements
This project has received funding from the European Research Council (ERC) under the European Union’s Horizon 2020 research and innovation programme (grant agreement No. 818521). The authors would like to thank the Groupe d’imagerie neurofonctionnelle (GIN) whiteboard team for helpful discussions.


