Article Text

Abstract
Background: Lung mast cells are stereotypically divided into connective tissue (MCTC) and mucosal (MCT) mast cells. This study tests the hypothesis that each of these subtypes can be divided further into site-specific populations created by the microenvironment within each anatomical lung compartment.
Methods: Surgical resections and bronchial and transbronchial biopsies from non-smoking individuals were obtained to study mast cells under non-inflamed conditions. Morphometric and molecular characteristics of mast cell populations were investigated in multiple lung structures by immunohistochemistry and electron microscopy.
Results: MCT and MCTC coexisted in all compartments, with MCT being the prevailing type in bronchi, bronchioles and the alveolar parenchyma and MCTC being more abundant in pulmonary vessels and the pleura. Each of the MCTC and MCT phenotypes could be further differentiated into site-specific populations. MCTC were significantly larger in pulmonary vessels than in small airway walls, while the reverse was observed for MCT. Within each MCTC and MCT population there were also distinct site-specific expression patterns of the IgE receptor, interleukin-9 receptor, renin, histidine decarboxylase, vascular endothelial growth factor, fibroblast growth factor, 5-lipoxygenase and leukotriene C4 synthase (eg, bronchial MCT consistently expressed more histidine decarboxylase than alveolar MCT). Renin content was high in vascular MCTC but markedly lower in MCTC in other compartments. For both MCTC and MCT, the IgE receptor was highly expressed in conducting airways but virtually absent in alveolar parenchyma.
Conclusions: These findings demonstrate novel site-specific subpopulations of lung MCTC and MCT at baseline conditions. This observation may have important implications in the future exploration of mast cells in a number of pulmonary diseases.
Statistics from Altmetric.com
Mast cells are multipotent cells that originate in the bone marrow and home into tissues of many organs including the lung.1–3 They are intimately linked with allergy and have established roles in allergic rhinitis and asthma where they have been extensively studied in upper and central airways, respectively.3–5 Less is known about mast cells in more peripheral airways.
Both small airways and the alveolar parenchyma contain significant numbers of mast cells. In recent years they have been ascribed expanding roles in innate immunity, pathogen recognition, remodelling and vascular regulation,1 6–8 suggesting their involvement in a number of non-allergic respiratory diseases such as chronic obstructive pulmonary disease (COPD), interstitial pulmonary fibrosis and pulmonary infections. In vivo data on human lung mast cells—particularly in peripheral regions—have, however, remained scarce. Most previous functional in vivo data come from rodents, including genetically modified mice. However, apart from translational difficulties between animal models and human disease,9 mice lack mast cells in small airways and the alveolar region. Human lung mast cell populations cannot be adequately mimicked in murine models and must therefore be studied directly in man. However, the progress has been hampered by the heterogeneity of mast cells in humans.3 10
Mast cell heterogeneity, which has mainly been studied in rodents, involves differences in morphology, mediator content and histochemical characteristics as well as response to external stimuli.11 12 Determination of the granule content of tryptase and chymase was used to identify the so-called mucosal mast cells (MCT) and connective tissue mast cells (MCTC), a division that emerged as robust and became the common classification of mast cell subtypes in man.13 This classification has also remained the archetypical division in the many papers on mast cell populations in respiratory diseases.14–16 Importantly, although MCT is the dominant type in most parts of the lung, the relative proportion and distribution of MCT and MCTC changes with disease,13 with potential clinical consequences.14 17
There are indications that the division into MCT and MCTC does not adequately explain the complexity of lung mast cell heterogeneity. It is well known that the phenotype of any mast cell is highly dependent on the local microenvironment.3 Likewise, it is known that, in healthy baseline conditions, both MCT and MCTC populations are present in all anatomical compartments of the lung. Based on these notions, we hypothesised that, in the anatomical compartments of the lung, there is a site-specific heterogeneity that is present under non-inflamed healthy conditions and goes beyond the MCT and MCTC classification. This study explores this possibility by detailed assessments of morphometric and molecular characteristics of lung tissue mast cell populations under baseline conditions.
METHODS
Human lung tissues
Tissue was obtained from lung lobectomy samples resected from patients undergoing surgery for suspected lung cancer at the University Hospital in Lund, Sweden, in otherwise healthy non-smoking individuals. Lung tissue samples were collected during a period of 5 years from April 2001 to April 2006. Only patients with solid well-delineated tumours were included, and tissue samples were obtained at a distance from the tumour. This procedure has commonly been used to collect human control tissue.18 19 From each patient, multiple large tissue blocks representing the major anatomical regions of the lung were selected for histological analysis (table 1). Central airways (bronchi), small airways (bronchioles; defined by an absence of cartilage and <2 mm in diameter), pulmonary vessels and alveolar parenchyma were included in the analysis.
As additional control tissue, we also collected bronchial and transbronchial biopsy specimens from young healthy non-atopic individuals (table 2, see also online supplement) during a study period from May 2007 to February 2008 at the Department of Respiratory Medicine, Lund University Hospital.
Bronchoscopy was performed after local anaesthesia with a flexible bronchoscope (Olympus IT160, Tokyo, Japan) and transbronchial biopsy specimens were taken with biopsy forceps (Olympus FB211D) under fluoroscopic guidance in the peripheral right lower lobe at a distance of ⩾2 cm from the chest wall. Before bronchoscopy the subjects received oral midazolam (1 mg/10 kg) and intravenous glykopyrron (0.4 mg). Local anaesthesia was given as lidocaine spray, locally and through a spray catheter. Just before the procedure, alphentanyl 0.1–0.2 mg/10 kg was given intravenously and extra midazolam was given intravenously when needed. Central airway biopsy specimens (n = 5) were taken from the segmental or subsegmental carina in the right lower and upper lobes, followed by transbronchial biopsy specimens (n = 5) in the right lower lobe. Oxygen was given as needed during and after the procedure. Fluoroscopy of the right lung was performed immediately and 2 h after the procedure to rule out significant bleeding or pneumothorax. Betametasone 3–4 mg was given to prevent fever reactions and the subject was discharged after 2 h of observation.
Tissue processing and double immunohistochemical staining of MCT and MCTC
Immediately after excision, samples for immunohistochemistry were placed in 4% buffered formaldehyde. After dehydration and paraffin embedding, a large number of 3 μm sequential sections were generated from each tissue block.
A double staining protocol was used for simultaneous visualisation of MCT and MCTC cells (see online supplement for details). Briefly, after rehydration and antigen retrieval, chymase-containing mast cells were detected by a primary anti-chymase antibody and a horseradish peroxidase-conjugated secondary antibody which was visualised using 3,3-diaminobenzidine as chromogen. Next, the remaining MCT subclass was visualised with an alkaline phosphatase-conjugated anti-tryptase antibody and the chromogen New-Fuchsin.
Density, distribution and size analysis of MCT and MCTC populations
Mast cell density
In sections doubled stained for MCT and MCTC, the density of each population was quantified manually and related to the tissue area which was determined in detail by a digital image algorithm that excluded any luminal spaces, notably also in the alveolar parenchyma (Image-Pro Plus, MediaCybernetics, Silver Spring, Maryland, USA and NIS-elements, Nikon, Melville, New York, USA).
Size and shape analysis
In each major compartment of the lung the mean cross-section of the MCT and MCTC was calculated. Cell size was measured with manual cursor tracing at high resolution digital images using software Image J (Version 1.34s; National Institutes of Health, USA). MCT and MCTC were visualised in the same section by double staining (see above). The size measurements used in the main study were performed on cross-sectioned airways and pulmonary vessels. To exclude any misleading results from an uneven or biased sectional plane, we also analysed cell sizes in a large number of longitudinal sections of the airways and vessels.
To further improve our quantification of mast cell sizes, we employed a stereological approach using volume fraction measurements from a fixed cell number quantification.20 In short, using a point grid overlaid onto randomly orientated tissue sections, point counting was performed until a fixed number of mast cells (240/patient) had been hit by one or more points. With similar cell numbers analysed, differences in volume fraction will equate to differences in mean cell size. The volume fraction for each mast cell subtype and compartment was calculated using the equation:

where P is points counted, SA denotes the small airways compartment and PV is pulmonary vessels. The cell shape was calculated using the formula:
circularity = 4π (area/perimeter2)
Immunohistochemical identification of mast cell-related molecules
Triple staining with immunofluorescence was used to simultaneously visualise both MCTC and MCT populations together with the following mast cell-related molecules: IgE receptor (IgϵR1α), histidine decarboxylase (HDC), interleukin-9 receptor (IL9R), vascular endothelial growth factor (VEGF), 5 lipoxygenase (5-LO), leukotriene C4 synthase (LTC4-S), renin and fibroblast growth factor (FGF-2) (see online supplement and table 1 for protocol details). The markers were selected to represent multiple aspects of mast cell biology ranging from mast cell-promoting/survival factors (c-kit/CD117, IL9R), key activators (IgER1A), key enzymes used to produce mast cell-derived eicosanoids (LTC4-S and 5-LO) and histamine (HDC), as well as growth factors previously described in mast cells (eg, VEGF and FGF-2). After appropriate antigen retrieval, sections were stained for the molecule of interest using specific and validated primary antibodies (table 1) and visualised by an appropriate biotinylated secondary antibody and Alexa-Flour 555-conjugated streptavidin (Molecular Probes, Oregon, USA). Next, MCTC and MCT cells were stained with anti-tryptase and anti-chymase antibodies labelled with AlexaF-488 and AlexaF-350 fluorochromes, respectively (Zenon IgG labelling kit, Molecular Probes).
Transmission electron microscopy
From each lung compartment, separate glutaraldehyde/formaldehyde-fixed samples were processed and analysed by routine transmission electron microscopy using a standard protocol21 and a Philips CM-10 TEM microscope (Philips, Eindhoven, The Netherlands). Mast cell subtypes and ultrastructural signs of degranulation were analysed according to previously described ultrastructural criteria.21
Quantifications and statistical analysis
For direct comparison of the lung compartments within each single section, the main quantifications were (if not stated otherwise) performed on large sections from the surgical material. For quantification of mast cell-related molecules and morphometric parameters, numerous mast cells were analysed in three separate tissue blocks from each patient selected to contain the major anatomical compartments. When possible, we also corroborated our findings in bronchial and transbronchial biopsy specimens from young healthy individuals.
Data were analysed statistically using the Mann–Whitney rank sum test for comparison between two groups when an overall significant difference was detected, and one-way ANOVA corrected for Bonferroni’s multiple comparison test for comparison between three groups or more using GraphPad Prism V.4.03 (GraphPad Software). Differences between groups were considered significant at p values of ⩽0.05.
RESULTS
MCT and MCTC are abundant at all airway levels with a gradual increase towards peripheral regions
Mast cells were abundant at all airway levels (figs 1A and 2A–E), with a gradual and statistically increased density towards the alveolar parenchyma (fig 1A). Mast cells were also abundant in the adventitial layer in pulmonary vessels and in the perivascular layer outside the adventitia (figs 1A and 2E), whereas the number in the pleural wall was modest (26.7 (5) cells/mm2). Similar mast cell densities were present in bronchial and transbronchial biopsies from young healthy controls.

Mast cell (MC) density in healthy human lung. The density was significantly increased from the central to the distal airways. (A) Total mast cell density and the number of mucosal mast cells (MCT) and connective tissue mast cells (MCTC) per mm2 lung tissue in central airways, small airways, alveolar parenchyma and the adventitia and perivascular tissue of pulmonary vessels. (B) Proportion of each subtype (%) for each compartment. Data expressed as mean (SEM). *p<0.05 vs total mast cells in central airways. †p<0.05, ††p<0.01 vs MCTC in pulmonary vessels. Statistical analyses were performed using the Mann-Whitney rank sum test.

Representative micrographs of immunohistochemical staining (New Fuchsin-Red) of tryptase-positive mast cells in different anatomical compartments of the lung. (A) Bronchi. (B) Small airways. (C) Alveolar parenchyma. (D) High magnification of a mast cell in the alveolar septa. (E) Pulmonary vessels. (F) Ultrastructural transmission electron microscopy image of an in close proximity to a type II pneumocyte (PII) situated in the alveolar septa. Inset in (F) shows the characteristic scroll lattice of a resting MCT granule. The background tissue is outlined by differential interference contrast (DIC) microscopy. In separate sections double staining was used to distinguish mucosal mast cells (MCT) (red) from connective tissue mast cells (MCTC) (brown), inset in A. Bar = 50 μm for A, B, C and E. Bar = 10 μm for D. Bar = 1 μm for F and 250 nm for magnification of mast cell granular scroll.
Proportion and distribution of MCT and MCTC
Lung tissues double stained for MCTC and MCT showed that, in all major anatomical compartments except the adventitia of the pulmonary vessels, MCT was the predominant subtype (fig 1A, B). The proportion of MCT was highest in conducting airways, slightly increased in the alveolar parenchyma and significantly decreased in pulmonary vessels (fig 1B). MCTC were the most numerous subtype in the pleural wall, with 20.5 (7) cells/mm2 compared with 6.2 (2) cells/mm2 for MCT (p<0.001). Details of MCTC/MCT distribution within sub-compartments in conducting airways and vessels are presented in the online supplement.
MCT and MCTC may be divided into further site-specific subgroups
Differentially sized MCT and MCTC populations in distinct anatomical compartments
By measuring cell cross-section areas, it was found that the size within each of the MCT and MCTC population differed dramatically between anatomical regions (fig 3A). Large MCT cells were found in bronchi and small airways and significantly smaller MCT were present in pulmonary vessels (p<0.001). For MCTC the reverse pattern was found, with large MCTC in pulmonary vessel walls and a significantly smaller (p<0.001) MCTC population in bronchial and small airway walls (fig 3A). To exclude the possibility that the size differences were not caused by uneven tissue orientation in distinct MC populations, these differences were also present in longitudinal sections of airways and vessels (see online supplement). Distinct size changes were further corroborated by stereology, where distinct volume fractions were found after analysis of equal mast cell numbers. In small airways the volume fraction of MCT and MCTC was 0.027 (0.004) and 0.009 (0.0007), respectively (p = 0.0003). For pulmonary vessels, the opposite was true; MCT had a smaller volume fraction per mast cell number than MCTC (0.009 (0.0008) vs 0.019 (0.002), p = 0.002).
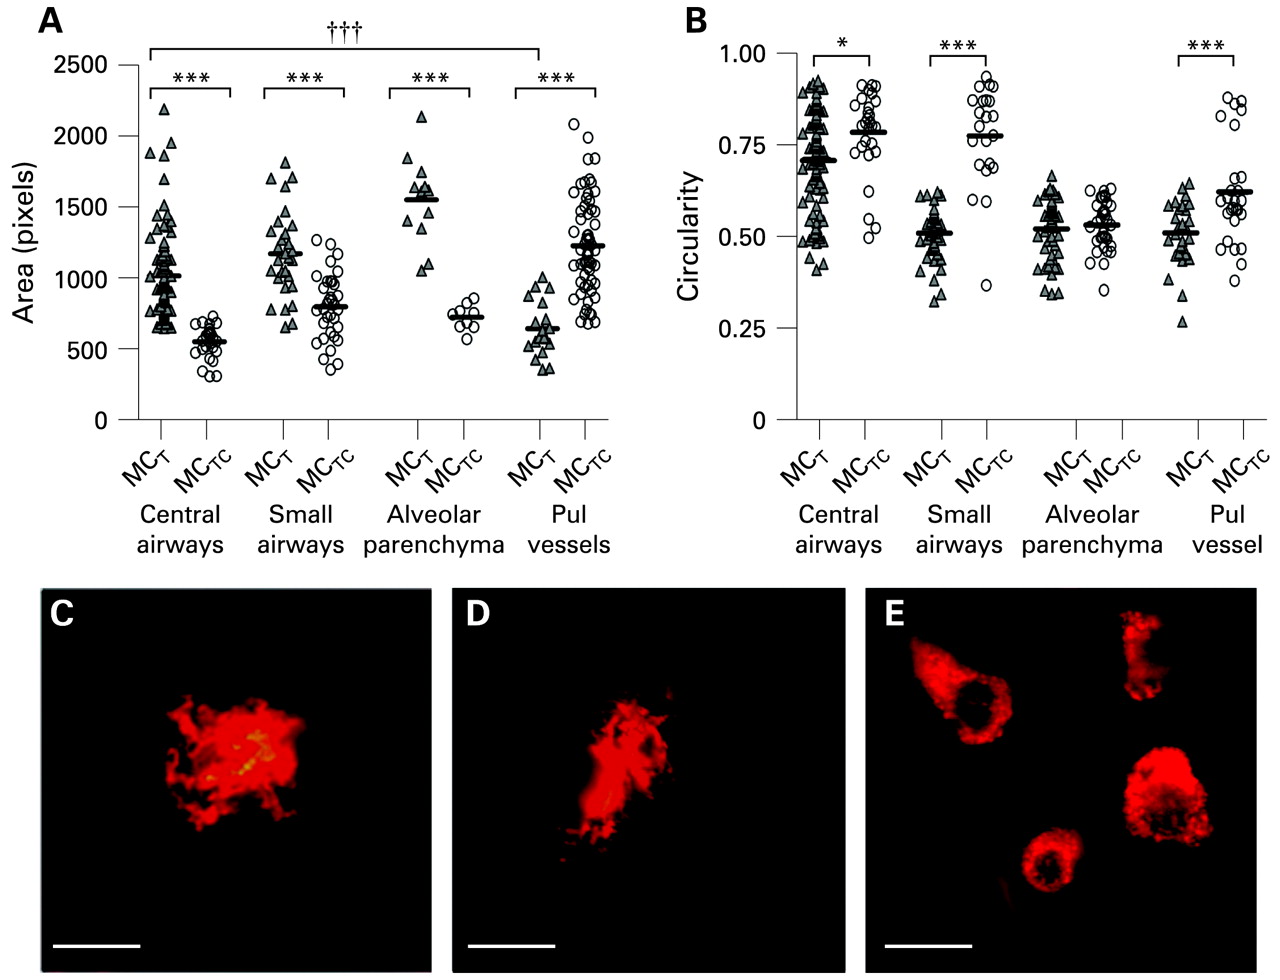
Mast cell size and shape analysis in different lung compartments. (A) Size changes for mucosal mast cells (MCT) and connective tissue mast cells (MCTC) in central airways, small airways, alveolar parenchyma and pulmonary vessels. (B) Differences in shape (circularity) between and within MCT and MCTC in central airways, small airways and pulmonary vessels. No significant shape difference was found in alveolar parenchyma. The results are shown as scatterplot graphs where black bars indicate the mean values. (C–E) Representative micrographs showing examples of the variation in mast cell shapes, with two examples of highly irregular “dendritic” mast cells (C, D) and more circular types (E), stained for c-kit. (Bar = 10 μm). Statistical analyses in (A) and (B) were performed using the Mann-Whitney rank sum test when comparing two groups and one-way ANOVA corrected for Bonferroni’s multiple comparison test for comparison between three or more groups. Significant differences between MCT and MCTC in different compartments: *p<0.05, ***p<0.001. †††p<0.001 considered significant when comparing MCT size between anatomical locations.
In alveolar regions, mast cells displayed a similar distribution as in conducting airways (ie, large MCT and smaller MCTC, fig 3A). The distinctly sized mast cell population was confirmed in all compartments after labelling with the mast cell surface marker c-kit (CD117).
Shape index
Calculating the circularity of MCTC and neighbouring MCT cells showed that MCTC cells were significantly more circular in all compartments (apart from the alveolar parenchyma) than neighbouring MCT cells in the bronchial wall (p = 0.008), small airways (p<0.001) and pulmonary vessels (p = 0.004), fig 3B–E). Occasional MCT cells in bronchi and small airways had a dendritic morphology (fig 3C, D).
Confirmation of non-degranulating phenotypes by electron microscopy
Ultrastructural examination of MCTC and MCT subtypes, which were identified by their distinct granule morphology,21 revealed that, in all the compartments examined, mast cells were of a non-degranulating phenotype (ie, displaying filled granules lacking classical ultrastructural sign of, for example, anaphylactic or piecemeal degranulation).
Distinct expression of mast cell-related molecules in site-specific MCT and MCTC populations
Distinct differences within each MCT and MCTC population could be further corroborated by differential molecular expression of mast cell-related molecules (table 1, data summarised in fig 4A, B). Thus, apart from the expected differences between MCTC and MCT cells, our data showed numerous examples of site-specific expression patterns within each of the MCTC or MCT populations (figs 4–6).
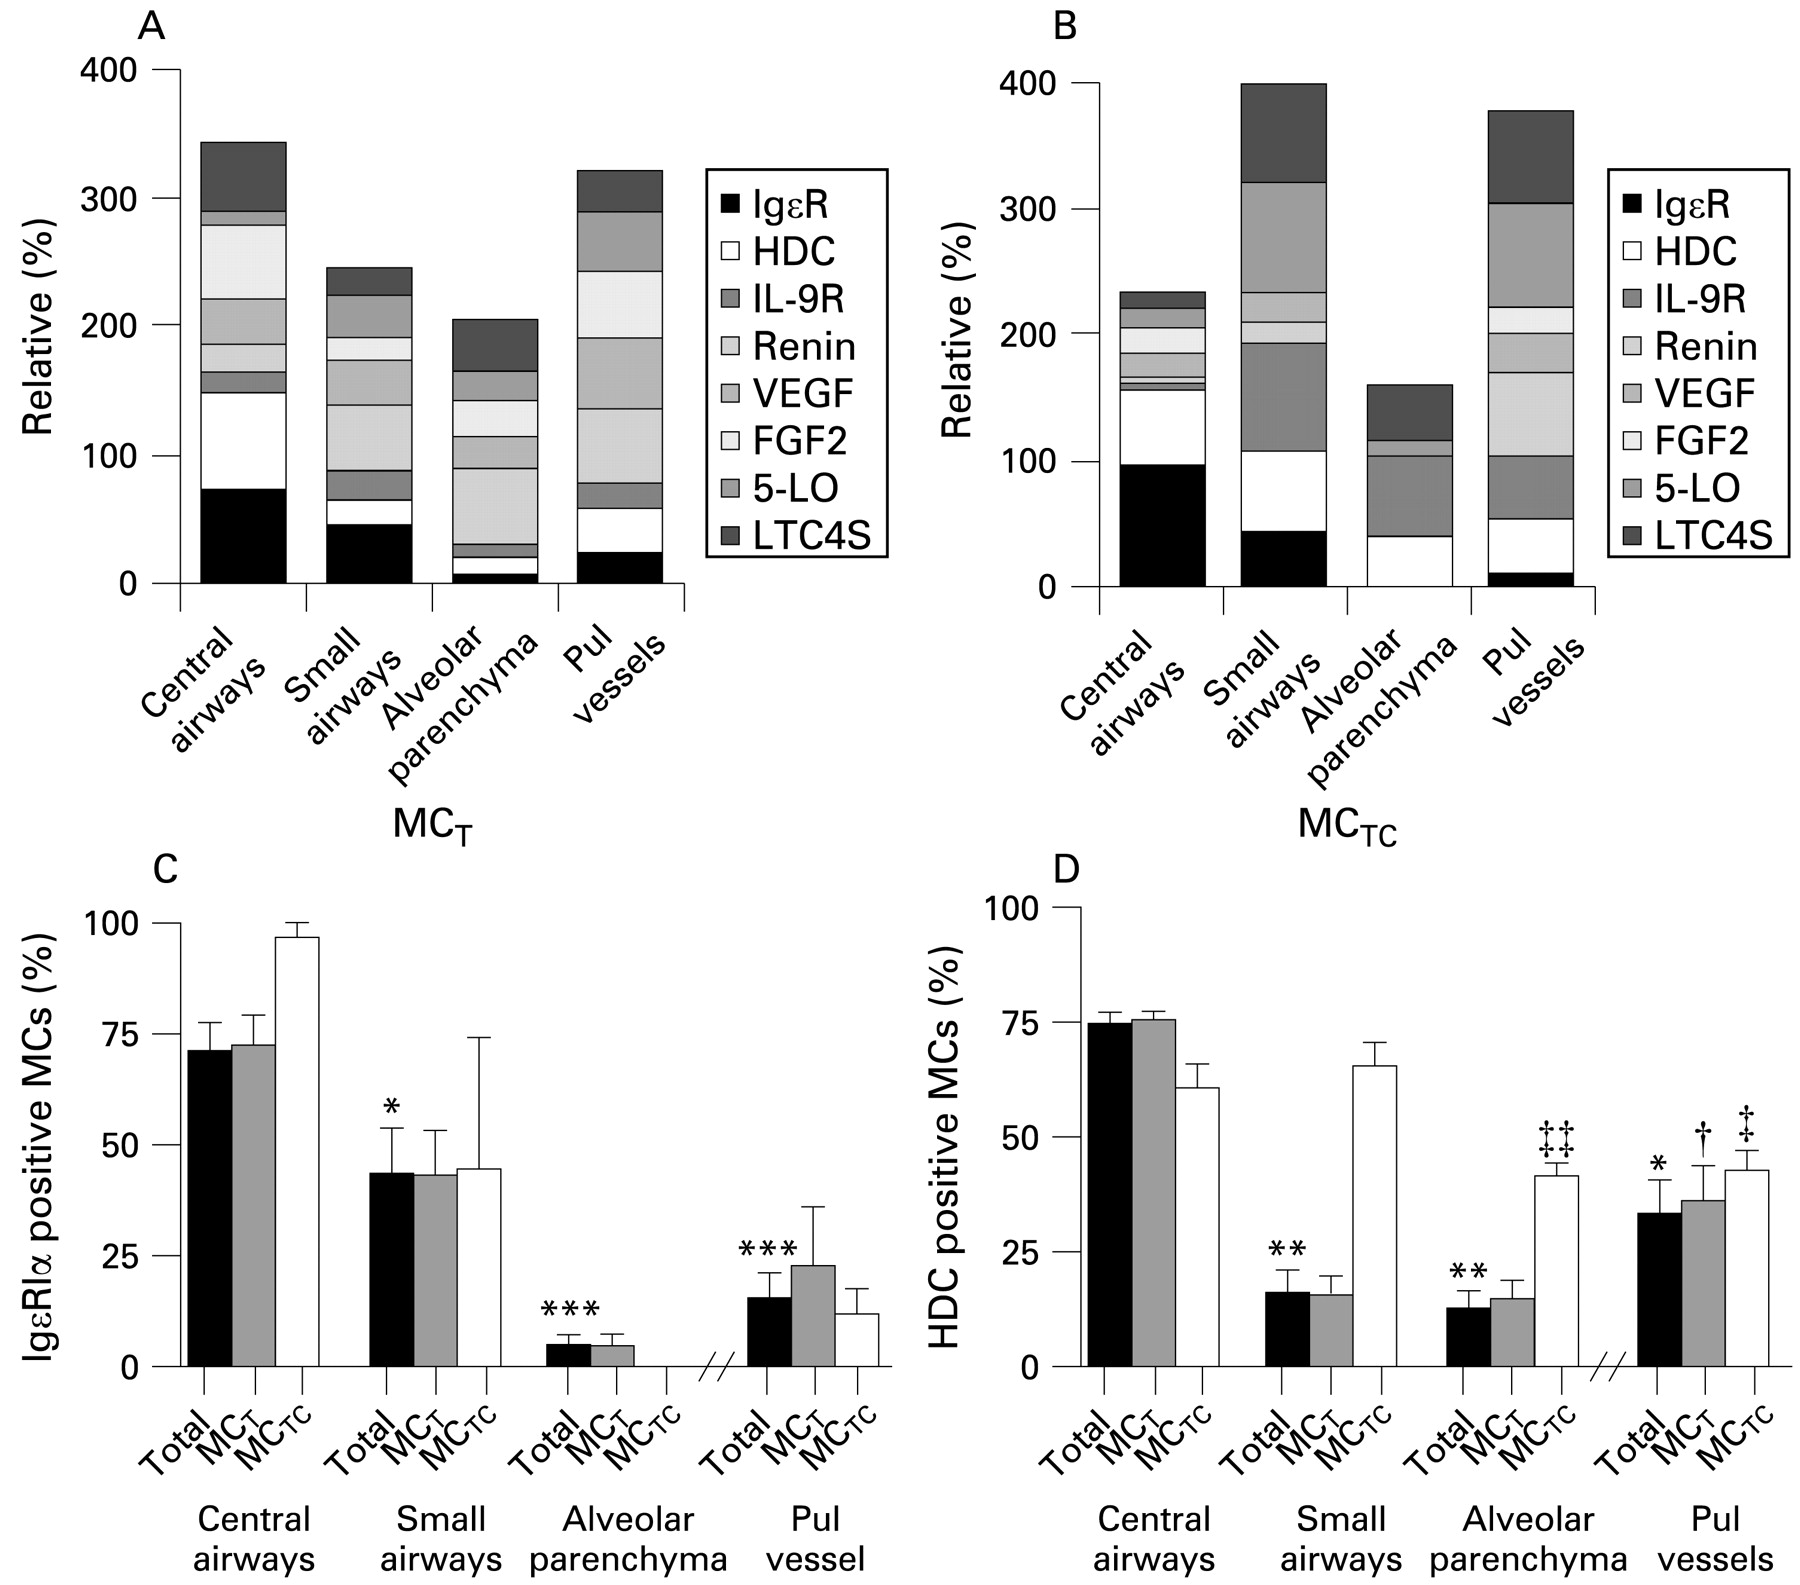
Summary of molecular staining patterns shown as relative expression (%) of mast cell-related molecules within (A) mucosal mast cells (MCT) and (B) connective tissue mast cells (MCTC) in different lung compartments. Proportion of total mast cells and MCT and MCTC subtypes staining positively for (C) IgE and (D) histidine decarboxylase (HDC). Data expressed as mean (SEM). *p<0.05, **p<0.01, ***p<0.001 compared with total mast cells in central airways. †p<0.05 compared with MCT in small airways. ‡p<0.05, ‡‡p<0.01 compared with MCTC in small airways. Statistical analyses were performed using the Mann–Whitney rank sum test.

Molecular expression pattern (%) of (A) interleukin-9 receptor (IL9R), (B) renin, (C) vascular endothelial growth factor (VEGF), (D) fibroblast growth factor-2 (FGF-2), (E) leukotriene C4 synthase (LTC4-S) and (F) 5-lipoxygenase (5-LO) in different compartments. Results are shown as the percentage of total mast cells (MCs) and MCT and MCTC subtypes positive for the respective mediators. Data expressed as mean (SEM). *p<0.05, **p<0.01, ***p<0.001 compared with total mast cells in central airways. ††p<0.01 compared with MCTC in small airways. ‡p<0.05, ‡‡p<0.01 compared with MCTC in central airways. Statistical analyses were performed using the Mann–Whitney rank sum test.

Immunofluorescence micrographs showing examples of tryptase-positive mast cells co-positive for other selected mast cell related-molecules. (A) Interleukin-9 receptor (IL9R) in small airways, (B) IgE receptor 1α (IgϵR1α) in bronchi, (C) 5-lipoxygenase (5-LO) in small airways, (D) renin in alveolar septa, (E) vascular endothelial growth factor (VEGF) in pulmonary vessels, (F) leukotriene C4 synthase (LTC4-S) in small airways. Mast cell tryptase is visualised with Alexa F 488 (green) and respective mast cell-related molecules with Alexa F 555 (red). The asterisks denote examples of co-positive cells which are also highlighted as insets. IgϵR1α was visualised with DAB (brown) and the background tissue is outlined by differential interference contrast (DIC) microscopy. In plates A, C, D, E and F, as background staining the autofluoroscence of extracellular matrix fibres is visualised though blue ultraviolet light. Bar = 25 μm.
MCTC
On the whole, alveolar MCTC had a low expression of the present set of mast cell-related molecules compared with, for example, vessel and airway MCTC. The populations of MCTC in bronchi, small airways and alveolar walls differed significantly in their expression of IgϵR1α (fig 4C). There was a significant and gradual decrease from an extensive IgϵR1α expression in bronchi (71.2 (6)%), moderate in small airways (43.4 (10)%) to a virtually absence of expression in alveolar MCTC cells (fig 4B, C). A similar pattern was seen in bronchial and transbronchial biopsies from the young control population. The expression of HDC followed the same pattern as IgϵR1α. HDC expression significantly decreased from bronchi and small airways (60.6 (5)% and 65.5 (5)%, respectively) to the alveolar region (41.2 (3)%, p = 0.002, fig 4D). Renin, just recently discovered as an airway mast cell mediator,8 had significantly (p = 0.002) elevated expression in the large MCTC of pulmonary vessels (65.6 (7)%) compared with the small-size MCTC populations found in other compartments of the lung (figs 4B and 5B). Notably, expression of the leukotriene-producing enzymes 5-LO and LTC4-S were mainly expressed in the MCTC populations of pulmonary vessels and small airways (figs 4B and 5E, F). For example, the expression of 5-LO in MCTC in small airways (86.8 (7)%) and pulmonary vessels (82.1 (14)%) was increased compared with the central airways (15.6 (15.6)%, p = 0.017 and p = 0.03, respectively) or the alveolar parenchyma (12.8 (12.8)%, p = 0.008 and p = 0.021, respectively). A similar heterogeneity was also observed for IL9R among the lung MCTC populations (figs 4B and 5A). Notably, as for renin, VEGF and FGF2 were absent from alveolar MCTC (fig 5C, D).
MCT
MCT also differed significantly in their expression pattern between the different parts of the lung. The proportion of MCT expressing IgϵR1α was, like MCTC, highest in the bronchi (72.5 (7)%), significantly decreased in the small airways (43.0 (10)%, p = 0.05) and virtually absent in the alveolar region (4.7 (2)%, p = 0.002, fig 4A, C). The proportion of MCT expressing HDC also followed the pattern seen for MCTC with a decrease from the bronchi to the alveolar region (75.4 (2)% to 14.4 (4)%, p = 0.004, fig 4D). Although renin was expressed in the central airways (21.4 (1)%), the proportions of renin-positive MCT were increased in more distal airways (small airways: 51.5 (10)%, p = 0.05; alveolar region: 58.5 (9)%, p = 0.006, fig 5B). A similar pattern was observed for 5-LO, with a low bronchial expression (10.1 (3)%) compared with, for example, the small airways and pulmonary vessels (32.6 (70% and 46.7 (15)%, respectively; p = 0.0173, fig 5F). In contrast, LTC4-S was richly expressed in the central airways (53.4 (4)%, fig 5E). Both FGF-2 and VEGF were abundantly expressed in the central airways and pulmonary vessels with only a moderate decrease in the small airways and alveolar tissue (fig 5C, D).
DISCUSSION
The phenomenon of mast cell heterogeneity has been known for decades and studied in several species.3 10 22 However, apart from the MCT and MCTC classification, this phenomenon has remained poorly investigated, especially under human in vivo conditions. The present work describes a new level of heterogeneity by showing that, even under baseline conditions, each anatomical compartment of the lung contains distinct MCT and MCTC populations. For example, the frequently studied and highly IgϵR1α-expressing MCT population in the bronchi and small airways differs markedly—both in size and molecular content—from the less studied MCT populations in alveoli or pulmonary vessels. Equally striking differences occurred between site-specific MCTC populations. These findings show that mast cells are exceedingly plastic cells with a baseline phenotype determined by the local tissue milieu.
The present type of novel heterogeneity has several practical implications. In agreement with previous studies,14 16 17 this report suggests that quantification of lung mast cells in disease without proper information of anatomical location or subtype may be misleading; a certain subtype in one location may display increased numbers and/or activation whereas the situation may be reversed in neighbouring areas. An additional aspect underscored by this study is the complexity in assessing lung-derived mast cells ex vivo. Indeed, from our data it can be expected that purification of mast cells from lung homogenates yield a mixture of several populations with potentially different propensity to survive and get activated ex vivo. This type of heterogeneity may account for the many previously reported discrepancies in functionality among lung-derived mast cells. In this context, knowledge about the present site-specific heterogeneity may be helpful if lung mast cells were instead purified from dissected well-defined compartments of the lung together with, for example, CD88-based separation of MCT and MCTC proportions.23
In this study mast cells were plentiful at all regions of the lung and, consistent with other studies,12 24 MCT was by far the most abundant subtype. Previous studies have shown an increase in mast cell density in small airways compared with bronchi.15 16 Much less is known regarding alveolar mast cells. Interestingly, in this study the alveolar lung parenchyma was the most mast cell-rich compartment. In light of this, the present novel finding of a paucity of IgϵR1α on alveolar mast cells is intriguing and suggests a reduced capacity for classical anaphylactic degranulation among alveolar mast cells. In agreement, Balzar et al report reduced IgE-bearing mast cells in the alveolar tissue of subjects with asthma and healthy controls.25 It seems rational to have mechanisms for local downregulation of FcϵRI26 and thus prevent an anaphylactic degranulation in alveolar regions. Common effects of classical degranulation such as plasma extravasation would be a catastrophic event in the alveoli. It is therefore likely that alveolar mast cells are under strict regulation by non-IgE mast cell triggers such as C5aR and CD30L.23 27 Irrespective of the activation mechanism, alveolar mast cells are likely to have a variety of roles ranging from regulation of blood flow (supported by the high renin content in alveolar mast cells) to participation in the many new functions recently ascribed to mast cells ranging from immune modulators, effector cells in innate immunity to profibrotic cells.6 28–30
Size differences between mast cell populations in vitro have been reported previously31 32 but no link has been made to an in vivo setting. Our extensive quantification of mast cell size, with data from both cross-sectioned and longitudinally-sectioned airways and vessels, would yield a fair estimation of the size of MCT and MCTC since we did not assume the orientation, used randomly orientated tissues, counted nucleated cells only and counted all the mast cells in each structure analysed. Non-biased stereology is nevertheless the best approach for measuring cell density and size.20 33 However, many practical limitations exist in incorporating these methods into clinical studies owing, for example, to the limited quantity of tissue samples and because studies using human material cannot be completely designed to fulfil stereological criteria. The most correct way to measure individual cell size would be by the optical dissector method. However, this was not applicable with the double immunohistochemical staining of MCT and MCTC populations used in this study. Taking advantage of the fact that the tissue blocks were randomly selected and orientated, we therefore applied the stereology “volume fraction” approach that confirmed our conventional cell area measurements.20 33
The observation in this study of site-specific size differences among MCT and MCTC populations represents an intriguing and novel finding. These differences were consistent regardless of whether the size determination was based on visualisation of granule proteins or surface markers. Any shape and size changes due to degranulation were ruled out since our electron microscopic analysis showed that the mast cells were resting, irrespective of their localisation. It is currently unknown how one part of a tissue can selectively promote the growth of one mast cell subtype while suppressing the other. One possible explanation could be the presence of site-specific growth factors that act differentially on newly recruited MCT and MCTC progenitors.2 34 Although it is difficult to speculate about the biological significance of differently-sized populations, the consistency of this feature could be a useful discriminator in the further characterisation of site-specific populations. Some clues about functional roles are, however, provided by Schulman et al who reported a differential histamine release among differently-sized mast cell populations in vitro.35
From a more general perspective, our discovery of site-specific mast cell subtypes supports the idea of microlocalisation as a determinant in creating differential phenotypes of infiltrating cells.36 Indeed, both the airways and pulmonary vessels contain sub-anatomical compartments such as smooth muscle bundles and epithelial/endothelial regions that may differentially attract and/or alter mast cell behaviour.16 17 37–39 Hence, the fact that pulmonary vessels, conducting airways and alveoli contain different proportions and types of structural cells may in part explain the present novel site-specific mast cell populations.
Apart from the classical staining for tryptase and chymase, the mast cells in the present study were assessed for a variety of other mast cell-related molecules. Using this approach, we could demonstrate several statistically significant differences within each of the MCT and MCTC categories. Some of them are intriguing, such as the reduced IgϵR1α and increased renin expression in the alveolar region. Others are currently difficult to assign any specific functional consequence but they nevertheless strongly support our hypothesis of site-specific mast cell populations. Importantly, for our immunohistochemical staining we used large sections that contained all anatomical compartments. This guaranteed that our comparison of molecular expression was done between anatomical regions subjected to exactly the same immunohistochemical conditions. Furthermore, electron microscopy confirmed that the mast cells were of a non-degranulated phenotype. The differences in mediator content or receptor expression are therefore not caused by differential degranulation but rather reflect distinct molecular expression at resting baseline conditions. One interpretation of this is that the unique molecular milieu in each anatomical compartment gives rise to differential mast cell priming, reflecting the different needs and functions of mast cells in various parts of the lungs.
In summary, this study shows several novel aspects of the heterogeneity of normal lung mast cells. Many of them clearly go beyond the prevailing MCT and MCTC classification. As revealed by morphological and molecular parameters, small and large airways, pulmonary vessels and the alveolar parenchyma each seem to harbour site-specific MCT and MCTC populations. Among these, the alveolar mast cell types comprised the most abundant yet most poorly studied populations. Consideration of the present expanded heterogeneity seems warranted in future studies on the physiological and pathogenic roles of mast cells in health and respiratory disease.
Acknowledgments
The authors thank Karin Jansner and Britt-Marie Nilsson for skilful technical assistance with tissue processing, immunohistochemical staining and TEM procedures, and Professor Lo Persson for kindly providing the HDC antibody.
REFERENCES
Supplementary materials
web only appendix 64/4/297
Files in this Data Supplement:
Footnotes
See Editorial, p 278
▸ Additional details on methodology are published online only at http://thorax.bmj.com/content/vol64/issue4
Funding: This study was supported by grants from the Heart and Lung Foundation, Sweden, the Swedish Medical Research Council, Swedish Asthma and Allergy Association’s Research Foundation and the Crafoord Foundation.
Competing interests: None.
Ethics approval: All subjects gave written informed consent and the study was approved by the local ethics committee.
Linked Articles
- Airwaves
- Editorial