Article Text

Abstract
The serial interval is the time between symptom onsets in an infector–infectee pair. The generation time, also known as the generation interval, is the time between infection events in an infector–infectee pair. The serial interval and the generation time are key parameters for assessing the dynamics of a disease. A number of scientific papers reported information pertaining to the serial interval and/or generation time for COVID-19.
Objective Conduct a review of available evidence to advise on appropriate parameter values for serial interval and generation time in national COVID-19 transmission models for Ireland and on methodological issues relating to those parameters.
Methods We conducted a rapid review of the literature covering the period 1 January 2020 and 21 August 2020, following predefined eligibility criteria. Forty scientific papers met our inclusion criteria and were included in the review.
Results The mean of the serial interval ranged from 3.03 to 7.6 days, based on 38 estimates, and the median from 1.0 to 6.0 days (based on 15 estimates). Only three estimates were provided for the mean of the generation time. These ranged from 3.95 to 5.20 days. One estimate of 5.0 days was provided for the median of the generation time.
Discussion Estimates of the serial interval and the generation time are very dependent on the specific factors that apply at the time that the data are collected, including the level of social contact. Consequently, the estimates may not be entirely relevant to other environments. Therefore, local estimates should be obtained as soon as possible. Careful consideration should be given to the methodology that is used. Real-time estimations of the serial interval/generation time, allowing for variations over time, may provide more accurate estimates of reproduction numbers than using conventionally fixed serial interval/generation time distributions.
- COVID-19
- epidemiology
- public health
- virology
This is an open access article distributed in accordance with the Creative Commons Attribution Non Commercial (CC BY-NC 4.0) license, which permits others to distribute, remix, adapt, build upon this work non-commercially, and license their derivative works on different terms, provided the original work is properly cited, appropriate credit is given, any changes made indicated, and the use is non-commercial. See: http://creativecommons.org/licenses/by-nc/4.0/.
Statistics from Altmetric.com
Strengths and limitations of this study
The study provides timely information on serial interval and generation time for those involved in the development of models and in the implementation of control measures against COVID-19.
This is a rapid review of available evidence in the scientific literature between 1 January 2020 and 21 August 2020 on the serial interval and the generation time and it contains the usual limitations associated with such a review.
The statistical methods used in the different papers were not analysed in detail.
Introduction
In response to the COVID-19 outbreak, the Irish Epidemiological Modelling Advisory Group (IEMAG) for COVID-19 was established to assist the Irish National Public Health Emergency Team in their decision-making during the pandemic. A subcommittee from IEMAG was tasked with researching the various parameters, leading to the development of a series of synthesis documents relevant to the parameterisation of a COVID-19 transmission model for Ireland.
The serial interval is the time between symptom onsets in an infector–infectee pair, that is, the interval between the onset of symptoms in an infectee and its presumed infector. This can be a negative number if the onset of symptoms in the infectee occurs prior to the onset of symptoms in the infector. The generation time, also known as the generation interval, is the time between infection events in an infector–infectee pair. The serial interval and the generation time are key parameters for assessing the dynamics of an infectious disease, and the generation time, or its proxy the serial interval, is an essential quantity for estimating the reproduction number.
A number of scientific papers reported information pertaining to the serial interval and/or generation time for COVID-19. In the context of national control efforts in Ireland, our objective was to conduct a rapid review of available evidence to advise the IEMAG on appropriate parameter values for serial interval and generation time in national COVID-19 transmission models and on methodological issues relating to those parameters. This information may also be of use to developers of models and those involved in the implementation of control programmes in other countries.
Material and methods
The guidelines in the protocol ‘Rapid reviews to strengthen health policy and systems: a practical guide’ produced by the WHO were used for carrying out this review. This can be accessed at https://apps.who.int/iris/bitstream/handle/10665/258698/9789241512763-eng.pdf;jsessionid=E033D9A6E3118CE0701D03815D63F648?sequence=1. The Preferred Reporting Items for Systematic Reviews and Meta-Analyses checklist (https://www.equator-network.org/wp-content/uploads/2018/09/PRISMA-ScR-Fillable-Checklist-1.pdf) for scoping reviews was also used.
We conducted a review of the literature between 1 January 2020 and 21 August 2020 for all countries. Publications in the electronic databases Medline, Embase and PubMed, were searched with the following keywords: “Novel coronavirus” OR “SARS‐CoV‐2” OR “2019-nCoV” OR “COVID-19” AND “serial interval” OR “generation time” OR “generation interval”. Bibliographies within these publications were searched for additional papers, and a manual search was also carried out. Summaries, citations and extracted parameters from these publications were added to a specifically designed database. The review was confined to papers, including pre-proofs and accepted manuscripts, that were published in recognised journals in the English language. Data were managed during the review using Covidence (Melbourne, Australia).
Papers that did not contain original parameter estimates of serial interval or generation time parameters were discarded.
Parameter estimates for the serial interval and the generation time, including means, medians and 95% CIs, were extracted from the remaining papers. A critical appraisal was carried out on the retained papers with a view to identifying the most relevant findings, the strengths and weaknesses of each study and particularly the potential for bias.
Each paper was reviewed by two authors (JG and MC) to extract the parameters required to recreate the statistical distributions described. If a statistical distribution was not fitted, or could not be recreated, the underlying serial interval data on which the estimates reported in paper were based were extracted if available. The extracted serial interval and generation time data were summarised by box and ridge plots. All analyses were performed in the R statistical environment. (R V.3.6.1, https://www.r-project.org/). Extracted data and R code to generate the plots are available at https://github.com/miriamcasey/covid-19_presymptomatic_project.
Patient and public involvement
It was not appropriate or possible to involve patients or the public in the design, or conduct, or reporting, or dissemination plans of our research.
Results
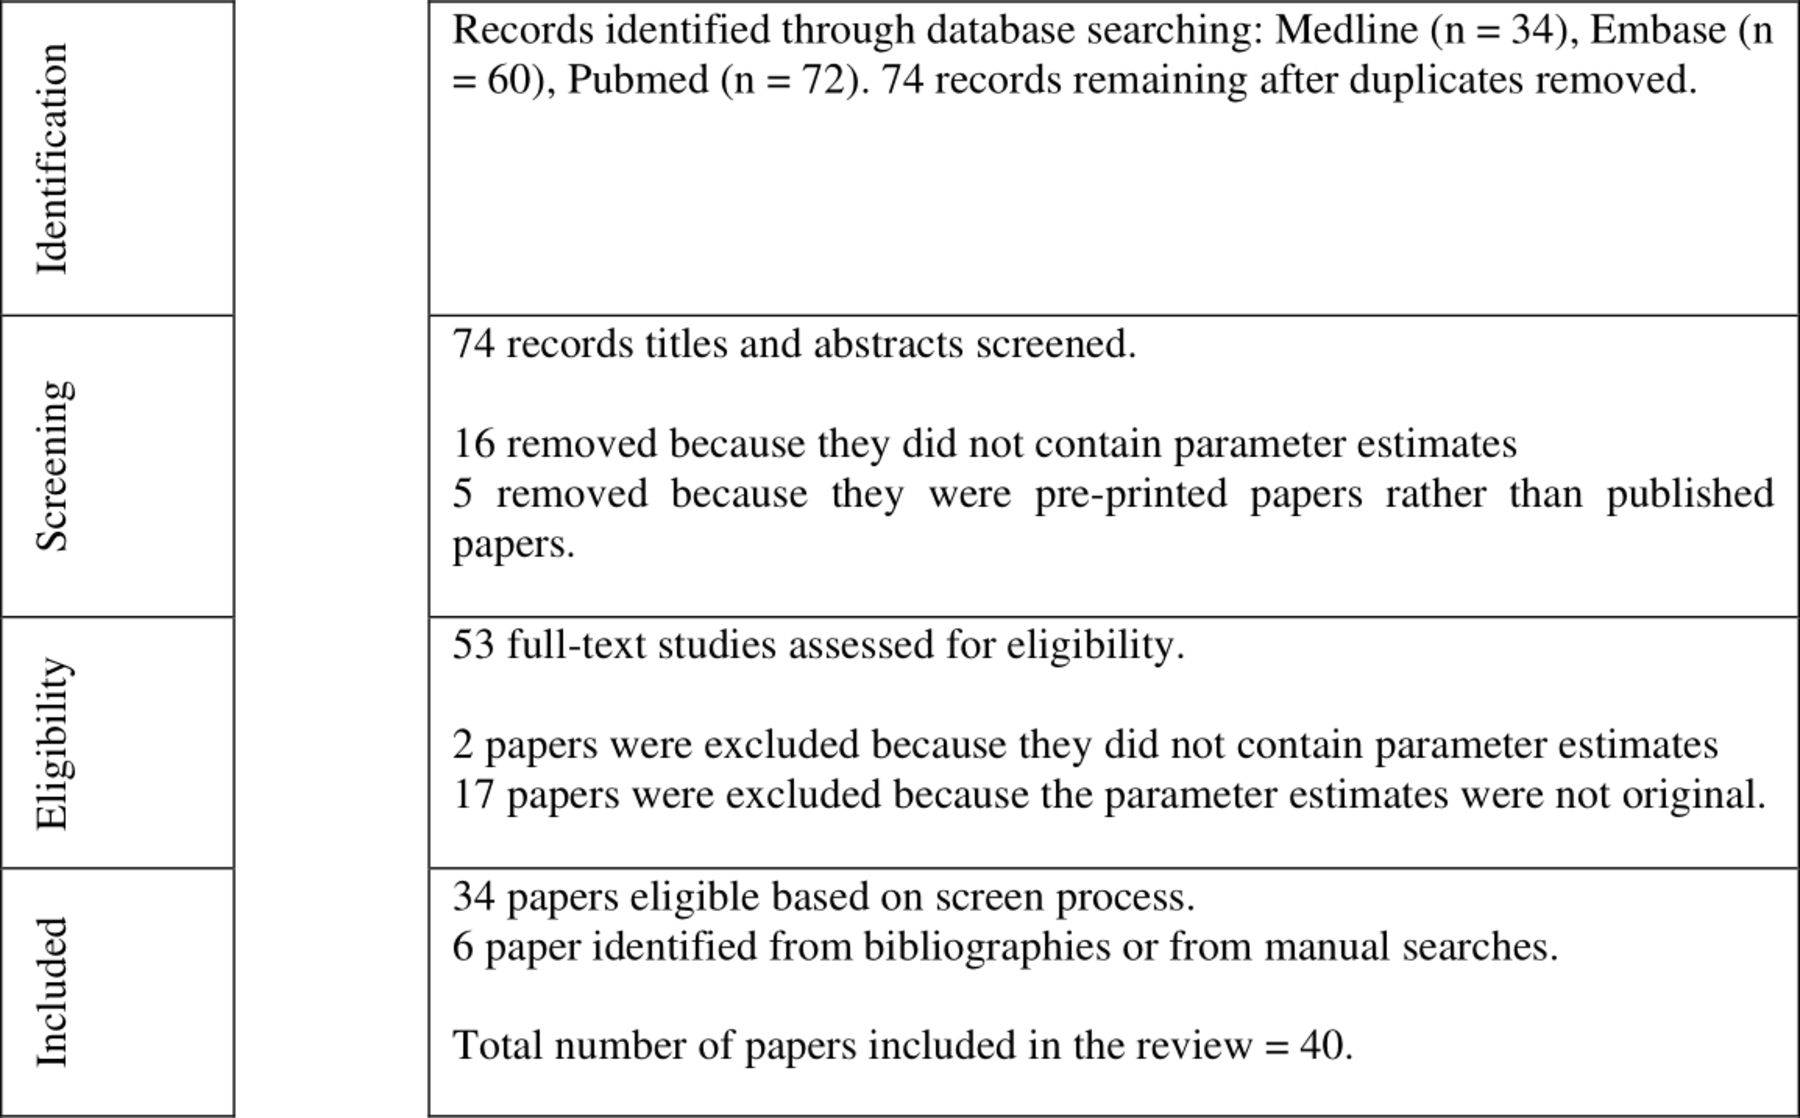
Seventy-four papers were identified by the literature search. Of these, 34 papers met the eligibility criteria, and a further 6 papers were identified by searching the bibliographies of these papers or through manual searches, resulting in 40 papers being included in the review. The detailed selection process is illustrated in figure 1.

Preferred Reporting Items for Systematic Reviews and Meta-Analyses for scoping reviews flow diagram.
Of the shortlisted studies, most relate to Asian countries, particularly China. Apart from the study by Lavezzo et al 1 which deals solely with the COVID-19 outbreak in Italy, the study by Prete et al 2 from Brazil and the study by Böhmer et al 3 from Germany, the number of datapoints from the non-Asian countries was very small.
The published studies consisted of 28 research articles,1 3–29 4 letters,2 30–32 2 reports,33 34 a brief communication,35 3 accepted manuscripts36–38 and 2 pre-proofs.39 40
All except two studies provided estimates for people of all age groups. Liao et al 34 provided estimates for adolescents and young adults. However, these estimates, particularly the estimate of the median, do not seem to be consistent with the individual serial interval values that can be extracted from figure 2 of the paper. The study by Huang et al 27 provided estimates on people aged 16–23 years. In the study by Zhao et al,32 an estimate was provided for men as well as for the population as a whole. Some studies provided more than one estimate.

A box plot summarising 34 estimates for serial interval or generation time from 28 papers. The purple triangles represent the means of the distributions. GT, generation time; SI, serial interval.
Different methods were used to describe the serial interval and the generation time data. Thirty studies1 2 4–8 10 11 13–25 30 31 33–37 39 assumed that the observed sample of serial interval and/or generation time came from an overall distribution in the population that could be modelled using one of a number of probability distributions. Normal, lognormal, gamma and Weibull distributions were used. Statistical distributions were not fitted to the data in the other 10 studies. In two studies,9 40 summary statistics are provided and CIs were generated using bootstrapping. Zhao et al 32 reported a mean value for the serial interval using a regression model. In the study by Qin et al, 12 summary statistics and CIs are provided but the method used for obtaining the CIs is unclear. In the remaining six studies,3 26–29 38 varying degrees of summary statistics such as the mean, median and quantiles are provided.
The estimates for the serial interval and/or generation time can be found in table 1. A total of 38 estimates are provided for the mean of the serial interval. These range from 3.032 to 7.69 days. A total of 15 estimates are provided for the median of the serial interval. These range from 1.027 to 6.09 days.
Estimates of serial interval and generation times for COVID-19 from 40 scientific papers, by country; all estimates relate to serial interval unless otherwise indicated
Three estimates are provided for the mean of the generation time. These range from 3.9523 to 5.2023 days. One estimate of 5.0 days22 is provided for the median of the generation time.
Online supplemental table 1 summarises the parameters and data that it was possible to extract from the 40 papers included in the review. For 34 estimates from 28 papers, we were able to recreate the distributions described for serial interval or generation time, draw samples (n=10 000) from them, and, from the samples, generate with summary statistics consistent with what was reported in the papers. These simulated distributions are shown in the box plot in figure 2.
Supplemental material
Liao et al 34 provided sufficient parameters to recreate a serial interval distribution but we could not replicate summary statistics reported by the authors. From this paper, we also extracted underlying serial interval data from the transmission pairs used, but we could not replicate their summary statistics.
One further paper16 reported fitting a gamma distribution to their serial interval data but did not provide sufficient information to simulate this distribution. We extracted underlying serial interval data from a figure in their paper for a portion of the transmission pairs used.
The remaining 10 papers3 9 12 26–29 32 38 40 reported serial intervals but did not report fitting statistical distributions to them. It was possible to extract underlying serial interval data from seven of these papers.3 9 26–28 32 40 We could replicate summary statistics for all except Ki.26
For three papers from which we were unable to extract either sufficient parameters to simulate distributions, or underlying serial interval data,12 29 38 two29 38 supplied histograms representing the serial interval data in their papers.
Online supplemental figure 1 is a ridge plot summarising 34 estimates for serial interval (SI) or generation time (GT) from 28 papers from which it was possible to simulate distributions (white fill) and a 6 further papers from which the underlying serial interval data could be extracted and summary statistics replicated (grey fill).3 9 27 28 32 40
Supplemental material
Online supplemental figure 2 is a ridge plot summarising 34 estimates for serial interval (SI) or generation time (GT) from 28 papers from which it was possible to simulate distributions (white fill) and 9 further papers3 9 16 26–28 32 34 40 from which the underlying serial could be extracted (grey fill). Summary statistics could not be replicated for 3 of these papers.16 26 34
Supplemental material
Discussion
Our scientific understanding of novel emerging pathogens is dynamic and constantly evolving as new information emerges. Early estimates of key parameters are vital in assessing the natural history of a novel emerging infectious disease such as COVID-19 and the likely impact of control measures. All the studies reviewed here were compromised by constraints that are present at the beginning of a new disease, including the lack of specific surveillance systems, information-gathering systems and precise case definitions.
Range of estimates obtained
The papers in this review provide initial parameter estimates for serial interval and/or generation time for COVID-19. Most of the estimates were for serial interval rather than generation time because infection times are difficult to measure and are generally not available. Consequently, data on generation times are rarely available. Instead, typically, the onset of symptoms is observed. The estimates for the mean of the serial interval ranged from 3.032 to 7.69 days. There are a number of reasons why the estimates are wide ranging. The interval between symptoms in an infector–infectee pair will be strongly influenced by the level of social contact. This will vary widely between different countries and indeed within countries. The impact of mitigation measures is also likely to be a key factor. The implementation of control measures will reduce the opportunity for an infected individual to transmit infection to a susceptible individual. Consequently, the serial interval is likely to decrease during the course of an epidemic. Zhao et al 32 showed that the serial interval decreased by 6.2% per day (95% CI, 0.4–11.6%) from 10 January to 2 February in Hong Kong and Shenzhen, which they attributed to the strengthening of public health control measures over time. They also showed that male infectors were associated with shorter serial intervals than female infectors.
Ali et al 33 showed that the serial interval shortened considerably from 7.8 days to 2.6 days over a period of 1 month. They attributed this to enhanced non-pharmaceutical interventions, in particular case isolation. In a study of the Vo’ municipality of Italy, Lavezzo et al 1 estimated that the serial interval reduced from 7.6 days before the implementation of comprehensive control measures to 6.2 days after the implementation of these measures. The mean serial interval over the entire study period was 7.2 days.
Stratified results produced by Bi et al 10 showed that if the infector was isolated less than 3 days after symptom onset, the average serial interval was 3.6 days, increasing to 8.1 days if the infector was isolated on the 3rd day after symptom onset or later. Du et al 31 pointed out that the time between successive cases contracts around the epidemic peak and that this may have influenced their estimates.
The value of estimating the serial interval, generation time and other key parameters at the start of an epidemic was emphasised by a number of authors. As highlighted by Bi et al,10 the study of an emerging pathogen at the time of its introduction provides a unique opportunity to characterise its transmission and natural history. Following initial introduction, it is possible to make robust assumptions about when and where cases were likely infected. This is often more difficult when the pathogen is widespread. Furthermore, during these early phases, uninfected and asymptomatic contacts are often closely tracked, providing critical information on transmission and natural history.
Ali et al 33 showed that the use of real-time estimations of the serial interval, which allows for variations over time, provides more accurate estimates of reproduction numbers than using conventionally fixed serial interval distributions.
Methods used for estimating the serial interval and the generation time
The estimation of the serial interval and the generation time parameters for COVID-19 presented a number of other challenges and the potential for obtaining biased estimates, as was acknowledged by a number of authors. We identified a number of specific issues in the papers that we reviewed, including the following:
In clustered outbreaks, which is crucial to estimating the serial interval, the order of transmission (ie, who is infector and who is infectee) can easily be mistaken. Also, given the possibility of pre-symptomatic and asymptomatic transmission, particularly as the epidemic progresses, it can be difficult to determine the source of infection with certainty. In view of this, it is important that there is a well-defined methodology for estimating the serial interval/generation time. Some of the studies did not describe how the order of transmission issue was handled. In other studies, efforts were made to deal with the difficulties related to the order of transmission and the true source of infection. Nishiura et al 24 provided separate estimates of the serial interval parameter distribution for ‘18 most certain pairs’. A similar approach was taken by Kwok et al.15 Tindale et al 25 used a mixture model approach for serial intervals to avoid assuming that the presumed infector is always the true infector. Ganyani et al 23 used a Markov chain Monte Carlo approach for the same purpose. Wang et al 11 allowed for the possibility of multiple infectors of a single infectee by using an interval-censored likelihood function.
Generally, publicly available datasets were used in the studies under review. Du et al 31 mention the fact that if the data are restricted to online reports of confirmed cases, they might be biased toward more severe cases in areas with a high-functioning healthcare and public health infrastructure. The rapid isolation of such case-patients might prevent longer serial intervals, potentially shifting the estimates downward compared with serial intervals that might be observed in an uncontrolled epidemic. In general, it is likely that less severe cases are under-represented in the datasets examined.
In some of the studies, infector–infectee pairs from a variety of countries were used to estimate the serial interval. The number of pairs from some countries were very small. For example, in the paper by He et al,35 of the 77 pairs used, 1 was from the USA, 1 was from Singapore, 2 were from Malaysia, 2 were from Vietnam, 4 were from Taiwan, 12 were from Japan and the rest were from various parts of China. These cannot be considered representative of the countries from which they were drawn. The same conclusion applies to the studies by Ferretti et al,22 Nishiura et al 24 and Wu et al.30 In other studies, pairs were drawn from particular countries or regions during particular time periods. These may have been more representative of the population from which they were drawn. However, in some cases, for example, Li et al,4 the number of pairs selected was very small compared with the total number of cases included in the study, again calling into question the representativeness of the pairs used to estimate the serial interval or generation time.
The case data, including the identity of each infector and the timing of symptom onset, were based on individual recollection of past events. Du et al 31 note that recall accuracy is impeded by time or trauma, and case-patients might be more likely to attribute infection to recent encounters (short serial intervals) over past encounters (longer serial intervals). Therefore, it is likely that recall bias is present in all studies. It is not possible to distinguish the level of bias present in the different studies.
Tindale et al 25 highlight the fact that different criteria for determining what qualifies as illness onset could result in differences in estimates of the serial interval in different reporting jurisdictions.
The number of pairs used to estimate the serial interval varied considerably. Only three and six pairs were used in the study by Pung et al 28 and Li et al,4 respectively. In contrast, a total of 677 pairs were used in the study by Ali et al 33 and 1407 pairs were studied by Xu et al.37 However, the value of increased sample size must be evaluated against the difficulty of ensuring accuracy of the infector–infectee relationship as the sample size increases. There is a lack of clarity on the precise number of infector–infectee pairs that were used to estimate the serial interval in the study by Lavezzo et al.1 However, there was a total number of 81 individuals who tested positive in the study and the infector–infectee pairs were drawn from this population.
In the study by Zhang et al 8 and in other studies, the serial interval was estimated from cases in household clusters. The authors make the point that estimations based on household clusters may be 20% shorter than the true value of the serial interval.
A number of authors, including Mettler et al,40 Kwok et al 15 and Aghaali et al 20 highlighted the possibility of right truncated selection bias, that is, the possibility of infector–infectee pairs with longer serial intervals being under-represented in the sample due to short investigation period. Measures were taken in a number of studies to minimise this possibility.
Some aspects of the methodology used by Ganyani et al 23 were subsequently questioned by Bacallado et al.41 These related to the independence of the serial interval values used in the study, the independence of the generation time and the incubation period and the particular Metropolis-Hastings sampler that was used in the study. Kremer et al 42 accepted that simplifying assumptions had been made in the Ganyani et al study but stated that the study had certain advantages. Kremer et al also accepted that the Metropolis-Hastings sampler that they used should be amended in light of the comments made by Bacallado et al but they stated that the overall conclusions in their article would not change as a result of this modification.
It should be borne in mind that some of the studies may have used the same case data in estimating the serial interval or the generation time. Consequently, the estimates may not be fully independent of each other. For example, the studies by Tindale et al 25 and Ganyani et al 23 were carried out in Singapore and Tianjin over the same time period. Similarly, the same set of data seems to have been used in the studies by Xu et al 37 and Ali et al.33 It is not clear why 1407 transmission pairs were available in the former study compared with 677 pairs in the latter study.
Mettler et al 40 proposed that the diagnostic serial interval (the time between the diagnosis dates of the infector and infectee) be used as a new indicator for the effectiveness of a country’s contact tracing as part of the epidemic surveillance.
Statistical distributions used in estimating serial interval and generation time
In most of the studies, a gamma, lognormal or Weibull distribution was fitted to the data to estimate the serial interval distribution. A problem with these distributions is that negative values of the serial interval (that is, when symptoms manifest in the infectee before the infector) cannot be included. In the study by Du et al,31 59 of the 468 reports indicate that the infectee had symptoms earlier than the infector. Du et al cautioned against using distributions that excluded the non-positive data and making assessments and projections based on the truncated data. In their view, the normal distribution provides the best fit for the full dataset (shifted or not) and they recommended this distribution for future epidemiological assessments. This approach was also used by other authors, including Ali et al 33 and Xu et al 37 Prete et al 2 used a modelling approach and also fitted a normal distribution to the data. In some papers, including those of Chun et al,39 He et al,35 and Bao et al,16 shifted lognormal or shifted gamma distributions were used to deal with negative values of the serial interval.
Relationship between the serial interval, generation time and the reproduction number
The generation time is used to estimate the reproduction number. Because of the difficulty in estimating the generation time, the serial interval is often used as a surrogate for the generation time. The serial interval and the generation time will have the same mean value if the incubation times of the infectee and infector are independent and identically distributed, however, their variances are expected to be different. Britton and Scalia-Tomba43 note that the difference in variance between the serial and generation time can lead to biased estimates of the reproduction number. More specifically, when the serial interval distribution has a larger variance than the generation time distribution, using the serial interval as a proxy for the generation time will lead to an underestimation of the basic reproduction number. Ganyani et al 23 provided estimates for both parameters based on data from Singapore and China and described a method for obtaining an unbiased estimate of the generation time.
Conclusion
The availability of parameter estimates and information on the serial interval and generation time of the COVID-19 virus are vital for measuring the dynamics of the disease and for estimating the reproduction number. These estimates are very dependent on the specific factors that apply at the time that the data are collected, including the level of social contact. Consequently, the estimates may not be entirely relevant to other environments. Therefore, local estimates should be obtained as soon as possible. Careful consideration should be given to the methodology that is used. Real-time estimations of the serial interval/generation time, allowing for variations over time, may provide more accurate estimates of reproduction numbers than using conventionally fixed serial interval/generation time distributions.
Acknowledgments
We would like to express our appreciation to Francis Butler and Patrick Wall for their contribution as part of the COVID-19 epidemiological team.
References
Supplementary materials
Supplementary Data
This web only file has been produced by the BMJ Publishing Group from an electronic file supplied by the author(s) and has not been edited for content.
Footnotes
Twitter @MiriamC51755360, @AndyByrneSci
Correction notice The article has been corrected since it was published. The author name, Simon More has been updated.
Contributors Studies were selected and screened initially by ÁC and KH using search terms outlined in the Methodology section, with parameters identified and recorded. This was reviewed and supplemented by a manual search by JG, again with parameters identified and recorded. JG conducted the eligibility screening of shortlisted studies, extracted the data and conducted the review with input from all authors. MC generated figure 2 and read the full text of the papers. SM, MC, ÁC, AB, AB, EAL and CM undertook interim reviews. All authors read and approved the final manuscript.
Funding All investigators are full-time employees (or retired former employees) of University College Dublin or the Irish Department of Agriculture, Food and the Marine.
Competing interests None declared.
Patient consent for publication Not required.
Provenance and peer review Not commissioned; externally peer reviewed.
Data availability statement All data relevant to the study are included in the article or uploaded as supplemental information. All data relevant to the study are included in the article. The data were taken from previously published studies.
Supplemental material This content has been supplied by the author(s). It has not been vetted by BMJ Publishing Group Limited (BMJ) and may not have been peer-reviewed. Any opinions or recommendations discussed are solely those of the author(s) and are not endorsed by BMJ. BMJ disclaims all liability and responsibility arising from any reliance placed on the content. Where the content includes any translated material, BMJ does not warrant the accuracy and reliability of the translations (including but not limited to local regulations, clinical guidelines, terminology, drug names and drug dosages), and is not responsible for any error and/or omissions arising from translation and adaptation or otherwise.