Article Text

Abstract
Objectives Following well-established practices in demography, this article discusses several measures based on the number of COVID-19 deaths to facilitate comparisons over time and across populations.
Settings National populations in 186 United Nations countries and territories and populations in first-level subnational administrative entities in Brazil, China, Italy, Mexico, Peru, Spain and the USA.
Participants None (death statistics only).
Primary and secondary outcome measures An unstandardised occurrence/exposure rate comparable to the Crude Death Rate; an indirectly age-and-sex standardised rate that can be derived even when the breakdown of COVID-19 deaths by age and sex required for direct standardisation is unavailable; the reduction in life expectancy at birth corresponding to the 2020 number of COVID-19 deaths.
Results To date, the highest unstandardised rate has been in New York, at its peak exceeding the state 2017 crude death rate. Populations compare differently after standardisation: while parts of Italy, Spain and the USA have the highest unstandardised rates, parts of Mexico and Peru have the highest standardised rates. For several populations with the necessary data by age and sex for direct standardisation, we show that direct and indirect standardisation yield similar results. US life expectancy is estimated to have declined this year by more than a year (−1.26 years), far more than during the worst year of the HIV epidemic, or the worst 3 years of the opioid crisis, and to reach its lowest level since 2008. Substantially larger reductions, exceeding 2 years, are estimated for Panama, Peru, and parts of Italy, Spain, the USA and especially, Mexico.
Conclusions With lesser demand on data than direct standardisation, indirect standardisation is a valid alternative to adjust international comparisons for differences in population distribution by sex and age-groups. A number of populations have experienced reductions in 2020 life expectancies that are substantial by recent historical standards.
- COVID-19
- public health
- statistics & research methods
This is an open access article distributed in accordance with the Creative Commons Attribution Non Commercial (CC BY-NC 4.0) license, which permits others to distribute, remix, adapt, build upon this work non-commercially, and license their derivative works on different terms, provided the original work is properly cited, appropriate credit is given, any changes made indicated, and the use is non-commercial. See: http://creativecommons.org/licenses/by-nc/4.0/.
Statistics from Altmetric.com
Strengths and limitations of this study
The COVID-19 mortality indicators presented in this article are directly comparable with three well-established indicators of overall mortality: the crude death rate, the age-standardised death rate and life expectancy at birth.
In particular, this article demonstrates that when COVID-19 deaths in a population are not tabulated by sex and age, indirect standardisation techniques can still be used to improve comparisons of COVID-19 mortality in this and other populations by accounting for differences in population distributions by age and sex.
While requiring additional data on mortality from other causes, translating cumulative numbers of COVID-19 deaths into their impact on life expectancy at birth allows for comparison of COVID-19 mortality with previous reversals in secular mortality declines.
The comparability of these COVID-19 mortality indicators is affected by potential differences in identifying and reporting COVID-19 as a cause of death across populations.
Further analyses are needed to assess potential changes in mortality from other causes induced by COVID-19, as those would also contribute to the impact of COVID-19 on life expectancy at birth.
Background
As of 1 June, deaths from the novel COVID-19 had been reported in 186 of the 235 countries and territories of the United Nations system (UN). As with previous pandemics,1 the disease progression can be more reliably tracked with death than with case counts. Cumulative COVID-19 death counts at a given time depend on the determination of the cause of death, delays in reporting deaths to central reporting agencies—different for deaths at home, in hospitals and other institutions—and delays in verification, consolidation and publication at reporting agencies. In the USA, for instance, the grim milestone of 100 000 cumulative COVID-19 deaths was reached at the end of May, when data from the Center for Disease Control and Prevention (CDC) suggested that the number of deaths in the country exceeded expectations based on past trends by about 130 000.2 While COVID-19 deaths might not be fully reported, the death undercount is both easier to estimate and an order-of-magnitude smaller than the proportion of unreported cases. CDC data from large-scale seroprevalence surveys suggest that as much as 10 times more SARS-CoV-2 infections occurred than the number of reported COVID-19 cases3—a situation in no way unique to the USA.4 COVID-19 mortality indicators are also more pertinent for assessing public-health measures that were intended less to reduce the eventual number of cases than to ‘flatten the curve’ and eventually limit the number of COVID-19 deaths by keeping the need for emergency hospitalisations below local hospital capacity.
For comparative purposes, cumulative death counts are affected by several demographic characteristics such as, most obviously, population size. The deaths per capita ratio, however, represent the first rather than the only adjustment that can be taken towards more meaningful COVID-19 mortality comparisons. Following well-established practices in demography,5 this article presents more refined indicators that can be derived with additional demographic data. The corresponding measures are discussed using results for the 186 UN countries and territories with at least one death by 1 June. To illustrate issues of scale, the measures are also calculated at the first subnational administrative level (eg, states or provinces) in selected countries, which were the largest countries in the successive ‘epicentres’ of the pandemic over time: first China, then Italy and Spain, followed by the USA, and now Brazil, Mexico and Peru. Altogether, at least one of the measures presented here is estimated for a total of 386 national and subnational populations.
Methods and data
We first calculate an occurrence/exposure rate that relates the cumulative number of COVID-19 deaths to the number of person-years lived in the population during the period. With the standard approximation for person-years, the period crude COVID-19 death rate (CCDR) can be measured as:

Where t 1 is an initial time, DC [t 1, t] a cumulative COVID-19 deaths count between times t 1 and t, and N(tm ) an estimate of the total population size at time tm between time t1 and time t. The difference between this period rate and the deaths per capita ratio is easy to miss when the deaths count in the numerator, identical for both, is an annual number of deaths. In that case, the number of person-years in the denominator of the occurrence/exposure rate can indeed be approximated by the population size at some point during the year. However, the two are no longer directly comparable, and the metric of the ratio difficult to interpret, when the death counts correspond to periods of different durations. On the contrary, the CCDR is expressed in deaths per person-year and remains directly comparable to the annual crude death rate (CDR) available for most populations. We first calculate the CCDR for the period starting on the day of the first death in the population, which was obtained from WHO daily situation reports,6 and ending on 1 January 2021. The cumulative number of deaths reported up to that day was obtained from Johns Hopkins University’s Center for Systems Science and Engineering7 and total population size was obtained from the UN.8 (Additional sources used for subnational units are referenced in online supplemental material 1: technical appendix.)
Supplemental material
As age and sex variations in COVID-19 mortality have been clearly established,9 the period rates should be adjusted to take into account differences in age and sex distributions. Direct age-and-sex standardisation requires data on COVID-19 deaths by age and sex, which are unavailable or unreliable for a majority of UN countries and territories and most subnational populations. An alternative approach, known as indirect standardisation, borrows an age-and-sex pattern of mortality from a well-documented population so that only the age-and-sex distribution of the populations of interest is required. Based on this approach, we calculate the comparative COVID-19 mortality ratio (CCMR):

where US Mij C is the COVID-19 death rate specific to age group i and sex j in the USA and Nij (tm ) is the size of the age group i for sex j in the population of interest. The reference age-and-sex death rates selected here to illustrate the technique were obtained from the CDC weekly updated distribution of COVID-19 deaths by age and sex in the USA,10 to date the largest number of COVID-19 deaths distributed by age and sex. Unavailable only for the 13 countries/territories whose population size is less than 90 000, population age-and-sex distributions were taken from the UN data and, for subnational populations, national statistics.
Multiplying a population CCMR by the US CCDR yields an indirectly age-and-sex standardised COVID-19 death rate (ISCDR) for that population, with the US age-and-sex population distribution as the standard:

where USDij C [t 1,t] is the number of CoViD-19 deaths in age group i and sex j in the US and US Cij (tm ) is the proportion of the US population in age group i and sex j at time tm . CCMR and ISCDR are again calculated for the period starting on the day of the first death in the population and ending on 1 January 2021.
Finally, life expectancy at birth provides a summary indicator of mortality in a population in a more intuitive metric (years) than these rates. A standard demographic technique allows for the estimation of the impact that eliminating a cause of death would have on life expectancy at birth.11 12 When a prior period life table (ie, not factoring COVID-19 mortality) is available, applying this technique backward allowing analysts to translate a cumulative COVID-19-deaths forecast for the same period into a COVID-19-induced reduction in male and female life expectancies at birth. The cumulative number of reported COVID-19 deaths in 2020 were used to derive new male and female life expectancies at birth in 277 populations with extant life tables (155 countries, plus Italian regions, Spanish autonomous communities, Mexican and US states). Calculations required a previous projection of the male and female year-2020 life tables in these populations. For countries, these were again derived from UN data, by interpolation between the 2015–2020 estimates and 2020–2025 projections. For subnational populations, life tables available from national statistical institutes were extrapolated to 2020. Additional details on their calculation are described in online supplementary materials of this article (online supplemental material 1: technical appendix; online supplemental materials 2 and 3: an example).
Supplemental material
Supplemental material
Patient and public involvement
This research was done without patient involvement. Patients were not invited to comment on the study design and were not consulted to develop patient relevant outcomes or interpret the results. Patients were not invited to contribute to the writing or editing of this document for readability or accuracy.
Results
To illustrate the properties of these indicators, we briefly describe results from 1 January 2021 updates of the CCSE and CDC data. (Full results for that day are available in online supplemental material 5: full results; updated results will continue to be uploaded to https://github.com/statsccpr/ind-cov-mort.) For the period starting on the day of the first COVID-19 death observed in a population and ending on 1 January 2021, the highest national values of the CCDR (given in deaths per thousand person-years) are found in five European nations (San Marino, 2.11; Belgium, 2.10; Slovenia, 1.63; Bosnia and Herzegovina, 1.57; North Macedonia, 1.54). Among the 20 nations with the highest values, only Peru (1.45), the USA (1.25), Mexico (1.24) and Argentina (1.16) are outside Europe. This list of nations, however, illustrates the issue of scale with small, densely populated nations exhibiting higher values than some larger nations, but possibly not higher than for similarly sized parts of these nations. If comparisons are based on subnational rather than national boundaries, CCDR values for populations of 5 million or more are higher for parts of Italy (Lombardy, 2.90), the USA (New Jersey, 2.65; New York, 2.39; Massachusetts, 2.27) and Spain (Madrid, 2.15) than for Belgium. Values for parts of Mexico (Mexico City, 2.06), Peru (Lima, 1.99) and Brazil (Rio de Janeiro, 1.85) and for five other US states (Illinois, Michigan, Pennsylvania, Arizona and Indiana) are also higher than for any nation besides Belgium (again among populations of 5 million or more).
Supplemental material
The main motivation for the CCDR is not to compare COVID-19 mortality across populations, but rather to compare COVID-19 and overall mortality. Across the populations monitored here, the highest CCDR value to date for a period starting on the day of the first COVID-19 death has been reached in New York (9.44 for the period ending on 4/25) where it exceeded the state’s most recent annual CDR (7.83 in 2017).13 The period CCDR remained above the 2017 CDR until 20 May (figure 1). Ignoring competing risks between COVID-19 and other-cause mortality, and seasonality and period trends in other-cause mortality, this indicates roughly equivalent mortality from COVID-19 and from all other causes combined between 14 March (first death) and 20 May.

Estimated value of the period crude COVID-19 death rate (CCDR), New York (in deaths per 1000 person-years, period starting on 14 March and ending on day shown on the horizontal axis). Sources: Center for Disease Control and Prevention (crude deathrate) and authors’ calculations (CCDR, see online supplemental material 1: technical appendix).
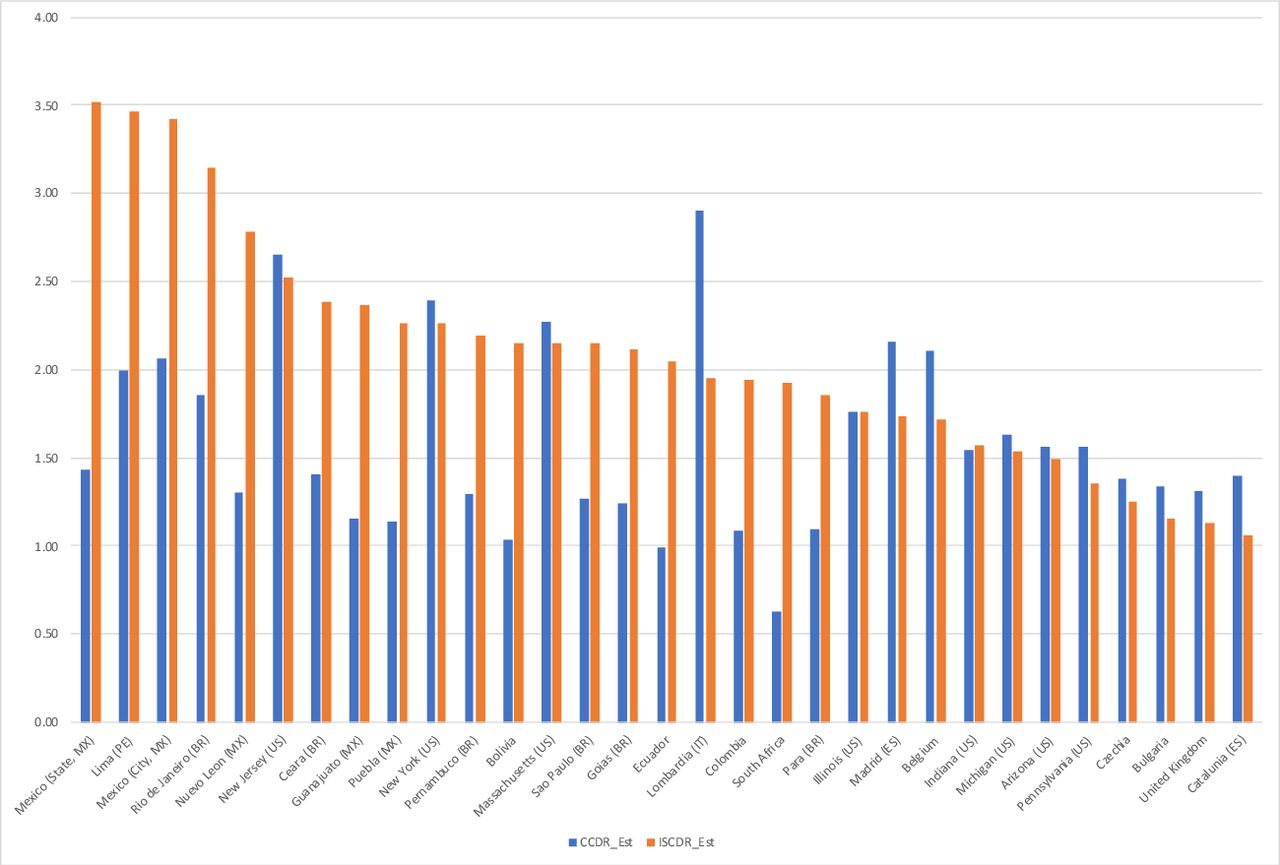
The effects of indirect age-standardisation are illustrated in figure 2, comparing current-period CCDR and ISCDR values for selected national and subnational populations (both in deaths per thousand person-years). By construction, the CCMR equals 1 and the CCDR and ISCDR are the same in the USA, but the standardised ISCDR is lower than the unstandardised CCDR in Europe, whereas the standardised rate can be two to three times the unstandardised rate in Mexico and South American countries. The 20 highest values of the ISCDR are for 11 Mexican states and 8 Peruvian Departamentos, ahead of Rio de Janeiro (Brazil). Among national and subnational units with a population size of 5 million or more shown in figure 2, the highest value in Europe (Lombardy, 1.95) is lower than subnational values for Mexico (3.51) and four other Mexican states, Lima (Peru, 3.46), Rio de Janeiro (Brazil, 3.14) and four other Brazilian states, and New Jersey (2.52) and two other US states, as well as national values for Peru (2.68), Mexico (2.51), Bolivia (2.15) and Ecuador (2.05).

Estimated value of the crude COVID-19 death rate (CCDR) and indirectly age-and-sex standardised COVID-19 death rate (ISCDR) (in deaths per 1000 person-years), by national and subnational unit (20 CCDR and 20 largest ISCDR values for units with a population size of 5 million or more). Sources: authors’ calculations (see online supplemental material 1: technical appendix).
As for the mortality impact, reductions in 2020 life expectancies at birth of 2 years or more are estimated for two nations: Panama (2.22) and Peru (2.09). Subnational values were estimated within five nations and if reductions of 2 years or more were also estimated for Madrid (Spain), two Italian regions, two Peruvian Departamentos and for four US states, values exceed 2 years for 11 Mexican states, foremost, Quintana Roo (includes Cancún, 3.93) and Baja California (includes Tijuana, 3.54, both values in years). Figure 3 shows reductions exceeding 1.3 years in 20 national and subnational units with a population size of 5 million or more.
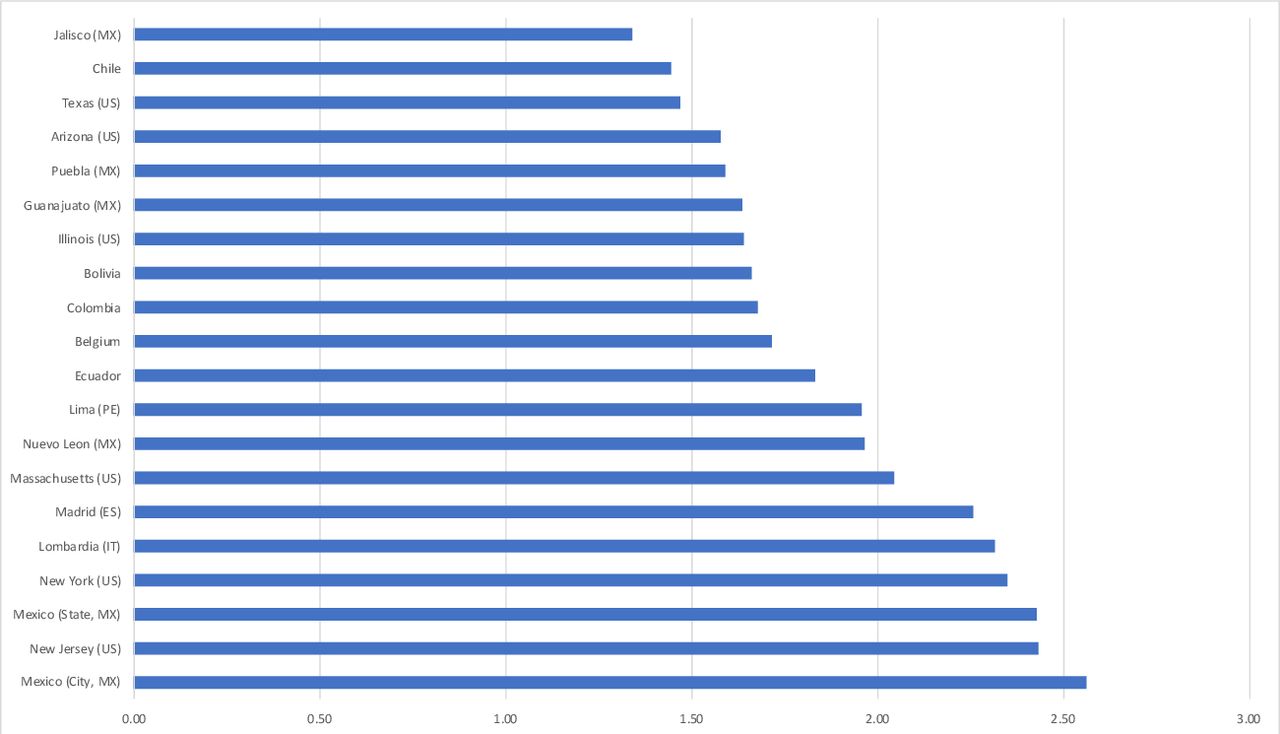
Estimated reduction in life expectancy at birth for year 2020, both sexes (in years), by national and subnational unit (20 largest reductions for units with a population size of 5 million or more). Sources: authors’ calculations (see online supplemental material 1: technical appendix).
Period life expectancy at birth is a summary indicator of mortality conditions across the lifespan that is available for all nations and each year since 1950 from the UN, and for earlier periods in a number of nations. This allows for comparing the mortality impact of COVID-19 with prior reversals in the secular increase in life expectancies. An examination of the UN times series, for instance, suggests that next to the exceptional declines induced by mass homicides in Cambodia (1975–1978) and Rwanda (1994), the largest annual declines in life expectancy at birth since 1950 took place in Eswatini (formerly Swaziland) during the worse years of the HIV pandemic (2.10 years between 1997 and 1998). Inducing declines in life expectancies for close to two decades in some countries, the HIV pandemic has had a much larger cumulative impact than COVID-19 to date, but the fact that life expectancy at birth may decline by a larger amount in 2020 in a few national and subnational populations than in the most affected countries in any year during the HIV pandemic puts in perspective values shown in figure 3. Moreover, while the estimated reduction for the USA (1.26) is lower than for the populations shown in figure 3, the US life expectancy drop in 2020 will still be the largest since World War II, far exceeding declines in the worst year of the HIV epidemic (from 75.8 years in 1992 to 75.5 years in 1993), or the worst 3 years of the opioid-overdose crisis (from 78.9 years in 2014 to 78.6 years in 2017).14 As illustrated in figure 4, COVID-19 is estimated to reduce US life expectancy at birth in 2020 to its lowest level since 2005.

Estimated life expectancy at birth, US population, both sexes, by year. Sources: Center for Disease Control and Prevention (2005–2018), United Nations and authors’ calculations (2019–2020, see online supplemental material 1: technical appendix).
Discussion
The results above illustrate the properties of different comparative indicators of COVID-19 mortality. For comparisons across populations, the ISCDR, and CCMR on which it builds, control for three important factors that contribute to the cumulative count of COVID-19 deaths in a population: the length of the period over which these deaths are cumulated, the size of the population, and its age-and-sex composition.
With respect to the first of these three factors, both the unstandardised and standardised rates are period indicators that increase and decrease as waves of the pandemic develop. Contrary to the death per capita ratio, which can only increase over time, the period rates begin to decline when the daily number of additional deaths drops below its average for the period. This property of the period rates accurately reflects for COVID-19 mortality a temporal dimension that can often be neglected for overall mortality. This also implies, however, that comparing ISCDR values across populations at very different durations of exposure to COVID-19 would not be meaningful. As shown in figure 1, this is more problematic early in the diffusion of the epidemic.
With respect to the second factor, comparing ISCDR values at the national or subnational levels illustrates that dividing by population size does not make small and large populations fully comparable. National rates are but population-weighted averages of subnational rates. With person-to-person transmission and uneven population density, these rates can be expected to vary substantially across the territory of the largest countries, making it less likely that the national average will stand out in cross-national comparisons. While the national ISCDR is lower for Italy, Spain and the USA than for Belgium, each of these three nations has at least one subnational entity of roughly similar population size with a higher ISCDR than Belgium.
Disaggregation to smaller administrative units may allow for more meaningful comparisons, but might be impeded by data availability. In this respect, indirect standardisation has the advantage of not requiring data on COVID-19 deaths by age and sex that may not be available or reliable for smaller geo-demographic domains. As a reliable breakdown of COVID-19 deaths is available from a number of European countries15 16 and US states, the ISCDR can actually be compared with a directly age-and-sex standardised COVID-19 death rate (DSCDR) with the US age-and-sex population distribution as the standard. Comparing unstandardised with directly and indirectly standardised rate for the three European nations and the three US states with the highest ISCDR values, figure 5 shows that the values of the indirectly standardised rate are typically very close to the corresponding values of the directly standardised rate.

Estimated value of the crude COVID-19 death rate (CCDR), indirectly age-and-sex standardised COVID-19death rate (ISCDR) and directly age-and-sex standardisedCOVID-19 death rate (DSCDR) (in deaths per 1000 person-years), by selected nation and US state. Sources: Ined, Center for Disease Control and Prevention, Registro Civil (Brazil)26 and authors’ calculations (see online supplemental material 4: sensitivity analysis).
Supplemental material
Over time, sex-specific and age-specific rates of COVID-19 mortality have become available for a larger and more diverse set of nations,17 providing a wider choice of possible standards. As is the case with the values of directly standardised rates, the values of indirectly standardised rates depend on the choice of a standard. While it is theoretically possible that the choice of a standard would also affect the rankings of directly or indirectly standardised rates, empirical regularities in mortality patterns across populations make this quite unlikely. The age patterns of COVID-19 death rates available so far similarly exhibit remarkable regularities, with some modest variation in the slope of these age patterns at the oldest ages, probably due to the number of fatalities in nursing homes across Europe and the USA.18 Indirect standardisation thus appears to provide a valid alternative to rank COVID-19 mortality across populations when data limitations prevent direct standardisation.
Variations in the slope of the age-specific rates of COVID-19 mortality would also affect the estimated reductions in life expectancy at birth. If these rates increase less rapidly with age at the oldest ages in a population than they do in the USA, the age pattern of COVID-19 deaths obtained here by multiplying the US age-specific rates and the population sizes of the different age groups would then be ‘older’ than the actual age pattern. In turn, this would imply that the average number of years of life lost per COVID-19 death and the total impact of COVID-19 on life expectancy at birth is actually larger than estimated here. A simulation using the reported sex-distribution and age-distribution of COVID-19 for Brazil yielded a 1.67-year estimated reduction in life expectancy, however, only a 3% difference with the reduction estimated here (1.72 years, see online supplemental material 4: sensitivity analysis).
Another source of uncertainty originates in the role of pre-existing conditions in COVID-19 mortality. While this role is well documented, data on COVID-19 fatalities by pre-existing conditions are even less commonly available than data COVID-19 fatalities by age.19 One study suggests that the average number of years of life lost per COVID-19 death might be overestimated by about 10% when pre-existing conditions are not accounted for.20 This provides an order of magnitude for the upward bias that ignoring pre-existing conditions might similarly induce in estimating reductions in life expectancies, as is the case here, based solely on the age of COVID-19 victims.
Moreover, the illustrative results presented here make no adjustment for potential biases in the number of confirmed COVID-19 deaths. Estimates of life-expectancy reductions based on these also assume no ‘indirect’ effect of the pandemic on other-cause mortality. In populations with complete and timely registration of deaths, the reporting biases and indirect effects can be jointly assessed from the increase in overall mortality over past ‘benchmark’ mortality levels. As noted in the introduction, CDC data indicate that the cumulative number of CoViD-19 deaths to date does not fully account for the overall increase in US mortality, with the most recent estimates at this writing suggesting 38.4% more excess than recorded CoViD-19 deaths (299,000 v. 216,000).21 However, the estimation of ‘excess’ deaths directly or indirectly attributable to CoViD-19 can be quite sensitive to the choice of a benchmark period to represent past mortality conditions. An analysis of mortality during the first wave of the pandemic across 21 industrialized nations (mid-February through May 2020) estimated a 95% credible interval for excess deaths over the period ranged from 178,100 to 231,000,22 corresponding to 6.6% to 38.2% more deaths than those reported from CoViD-19 over the same period (167,100).
The results presented here illustrate the properties of these period indicators which can easily be customised for different periods, different geographical scales, or to assess their robustness to these different sources of uncertainty. For tracking the pandemic, for instance, estimating CCDR and ISCDR values for more recent periods than the period starting with the first COVID-19 death and at a smaller scale than the first subnational division would be necessary. While this can be done with life-expectancy reductions as well, the value of life expectancy for a short period in a small geographical area becomes difficult to interpret and additional measures might become better suited to express the effect of COVID-19 on longevity.23–25 The ISCDR and life-expectancy reductions are the least data-demanding of the summary indicators of mortality conditions that allow for comparisons across populations, however, and as crude death rates and life expectancy estimates are widely available, the CCDR and life-expectancy reductions readily allow for temporal comparisons with other-cause mortality.
Acknowledgments
The authors benefited from facilities and resources provided by the California Center for Population Research at UCLA (CCPR), which receives core support (P2C-HD041022) from the Eunice Kennedy Shriver National Institute of Child Health and Human Development (NICHD). The authors thank Patrick Gerland for clarifications regarding UN demographic data, Hiram Beltrán-Sánchez for additional data for Mexico, and Enrique Acosta, Lars Ängquist, Sam Preston, Jason Kerwin and Piedad Urdinola for comments on an earlier draft.
Supplementary materials
Supplementary Data
This web only file has been produced by the BMJ Publishing Group from an electronic file supplied by the author(s) and has not been edited for content.
Footnotes
Contributors PH designed the study, compiled the necessary demographic data and drafted this manuscript. MT wrote the webscraping routine that provides regularly updated data on COViD-19 global estimates and projections, and US age-and-sex pattern.
Funding The authors benefited from facilities and resources provided by the California Center for Population Research at UCLA (CCPR), which receives core support (P2C-HD041022) from the Eunice Kennedy Shriver National Institute of Child Health and Human Development (NICHD).
Competing interests None declared.
Patient consent for publication Not required.
Ethics approval This study has no human subjects. Analyses are based solely on publicly available online data on anonymous, deceased individuals.
Provenance and peer review Not commissioned; externally peer reviewed.
Data availability statement Data are available in a public, open access repository. Data available at https://github.com/statsccpr/ind-cov-mort.
Supplemental material This content has been supplied by the author(s). It has not been vetted by BMJ Publishing Group Limited (BMJ) and may not have been peer-reviewed. Any opinions or recommendations discussed are solely those of the author(s) and are not endorsed by BMJ. BMJ disclaims all liability and responsibility arising from any reliance placed on the content. Where the content includes any translated material, BMJ does not warrant the accuracy and reliability of the translations (including but not limited to local regulations, clinical guidelines, terminology, drug names and drug dosages), and is not responsible for any error and/or omissions arising from translation and adaptation or otherwise.