Article Text

Abstract
Objective Two pertussis outbreaks occurred in Olmsted County, Minnesota, during 2004–2005 and 2012 (5–10 times higher than other years), with significantly higher incidence than for the State. We aimed to assess whether there were similar spatio-temporal patterns between the two outbreaks.
Setting Olmsted County, Minnesota, USA
Participants We conducted a population-based retrospective cohort study of all Olmsted County residents during the 2004–2005 and 2012 outbreaks, including laboratory-positive pertussis cases.
Primary outcome measure For each outbreak, we estimated (1) age-specific incidence rate using laboratory-positive pertussis cases (numerator) and the Rochester Epidemiology Project Census (denominator), a medical record-linkage system for virtually all Olmsted County residents, and (2) pertussis case density using kernel density estimation to identify areas with high case density. To account for population size, we calculated relative difference of observed density and expected density based on age-specific incidence.
Results We identified 157 and 195 geocoded cases in 2004–2005 and 2012, respectively. Incidence was the highest among adolescents (ages 11 to <14 years) for both outbreaks (9.6 and 7.9 per 1000). The 2004–2005 pertussis outbreak had higher incidence in winter (52% of cases) versus summer in 2012 (53%). We identified a consistent area with higher incidence at the beginning (ie, first quartile) of two outbreaks, but it was inconsistent for later quartiles. The relative difference maps for the two outbreaks suggest a greater role of neighbourhood population size in 2012 compared with 2004–2005.
Conclusions Comparing spatio-temporal patterns between two pertussis outbreaks identified a consistent geographical area with higher incidence of pertussis at the beginning of outbreaks in this community. This finding can be tested in future outbreaks, and, if confirmed, can be used for identifying epidemiological risk factors clustered in such areas for geographically targeted intervention.
- epidemiology
- public health
- geographical mapping
This is an open access article distributed in accordance with the Creative Commons Attribution Non Commercial (CC BY-NC 4.0) license, which permits others to distribute, remix, adapt, build upon this work non-commercially, and license their derivative works on different terms, provided the original work is properly cited, appropriate credit is given, any changes made indicated, and the use is non-commercial. See: http://creativecommons.org/licenses/by-nc/4.0/.
Statistics from Altmetric.com
Strengths and limitations of this study
We included all laboratory-positive cases in Olmsted County since our study setting is a self-contained healthcare system with only one facility performing pertussis tests.
Identifying a consistent area with higher incidence of pertussis at the beginning of outbreaks in this community suggests feasibility of guiding surveillance of outbreaks and response strategies for public health.
Instead of applying conventional hotspot identification techniques that rely on pre-existing administrative polygons, we applied relative difference in density to take into account population size by age as an important risk factor across areas, enabling us to identify high incidence areas taking into account impact of population size and age.
Other possible transmission pathways (eg, school bus, sports activities, mass gatherings) for pertussis outbreak beyond impact of residential areas were not examined and need to be investigated to better understand the nature of spatial impact on two outbreaks in the same community.
Introduction
Emerging and re-emerging infectious diseases such as pertussis pose significant public health threats.1 Some outbreaks of infectious diseases are reported to become endemic over time, causing sporadic cases and localised outbreaks for years to come.2 Pertussis, also known as whooping cough, is a highly contagious respiratory disease which is caused by the bacterium Bordetella pertussis.3 Pertussis outbreaks have occurred every 3 to 5 years, with outbreaks of more intensity since 2000 in the USA reaching a similar magnitude of outbreaks during the pre-pertussis vaccine era.4 Centers for Disease Control and Prevention (CDC) reported 48 277 cases of pertussis in the USA in 2012, compared with 27 550 cases in 2010 and 1010 cases in 1976. The Minnesota Department of Health reported 263 cases in Olmsted County (21% of all Minnesota cases) in 2016, 237 (5%) in 2012 and 160 (10%) in 2005, suggesting a drastic increase in pertussis cases in Olmsted County (proportion of population of Olmsted County out of Minnesota population: 2.7%).5 6
Predictors of pertussis and pertussis-like outbreaks have been reported in the literature including (1) misclassification of different species of Bordetella (eg, Bordetella parapertussis, holmesii and bronchiseptica) as pertussis; (2) genetic changes in B. pertussis potentially affecting vaccine efficacy7–10; (3) increased susceptibility due to changing immunity trends including decreased immunisation rates in certain populations and earlier than expected waning antibody titres from acellular pertussis vaccines11–14; (4) increasing population susceptibility through prevalence of related co-morbidities such as asthma12 15; (5) environmental factors (eg, seasonality or social interactions16 17) and (6) increased clinical awareness and availability of more sensitive diagnostic tests.18 19 However, little is known about geographical and temporal patterns in the onset and spread of pertussis.20 21
Two pertussis outbreaks occurred in Olmsted County, Minnesota, during 2004–2005 and 2012. Individual-level demographic features and vaccine records for the cases of the 2012 pertussis outbreak in this community have been described previously, and cases were limited to patients seen at a single centre (Mayo Clinic) in Rochester.10 The current study investigated the similarities and differences between the two pertussis outbreaks in Olmsted County, and specifically, spatio-temporal patterns in the source and spread of pertussis during the outbreaks. This knowledge may help the community prepare for future outbreaks and mitigate the future extent of outbreaks through pre-emptive interventions for geographically targeted populations.
Based on the literature,22 23 pertussis occurs predominantly in children, especially those of middle school age. Children residing in a given neighbourhood tend to share similar outdoor activities and places, and mostly attend the same school; therefore we assessed whether there would be geographical clusters of pertussis cases in a given outbreak driven by close contacts among these children. Specifically, we investigated whether certain areas might consistently have higher incidence in multiple outbreaks especially at the beginning of outbreaks.
Methods
The study was approved by the Institutional Review Boards at both Mayo Clinic and Olmsted Medical Centre.
Study design and setting
This is a population-based retrospective cohort study. Olmsted County, MN is an excellent setting to conduct such a study because medical care is virtually self-contained within the community. Medical records-based research of the population of Olmsted County is possible through Rochester Epidemiology Project (REP).24 The REP, a National Institues of Health (NIH)-funded medical record linkage system including virtually all Olmsted County residents, contains all inpatient and outpatient clinical diagnoses as well as linked and retrievable demographics and address information of Olmsted County residents and other patients compiled over time.
Study subjects
Identification of Olmsted county, MN population in each year
Because the REP database includes address information at the time of clinic visit, we were able to identify and geocode the addresses of nearly all (95%) County residents listed in each REP Census for both outbreak periods.
Case ascertainment (2004–2005 and 2012 pertussis cases in Olmsted County, MN)
A pertussis case was defined as detection of B. pertussis by means of a PCR assay from a nasopharyngeal swab or washing among Olmsted County residents between 1 January 2004 and 31 December 2005 (for the 2004–2005 outbreak) and between 1 January 2012 and 31 December 2012 (for the 2012 outbreak).25 26 We identified all reported cases through microbiology laboratory records from Mayo Clinic, the only laboratory in Olmsted County performing pertussis PCR (ie, all PCR tests for pertussis in Olmsted County were performed at Mayo Clinic during the study period) which is known to have excellent sensitivity and various specificity. While culture is considered a gold standard with high specificity and recommended for test during outbreak, culture is often not ordered in clinical practice in part due to time limit (ie, culture during the first 2 weeks of cough vs PCR during up to 4 weeks of cough).27 Probable or suspect cases who may have met CDC-defined Clinical Criteria or Epidemiologic Linkage without laboratory test were not included in this study because we did not have full access to dataset in a community agency including probable or suspected cases.28 However, when we compared our case numbers with the reported numbers to the state of Minnesota including confirmed, probable and suspect cases in Olmsted County, it appears that laboratory-positive cases represent most (about 90%) of pertussis cases during the study period.29 The following subjects were excluded: (1) subjects who did not grant authorisation for using medical records for research, (2) patients who resided outside Olmsted County, Minnesota, at the time of testing for pertussis and (3) those whose addresses failed to geocode.
Patient and public involvement
No patients or the public were involved in the study protocol design, the specific aims or the research questions, and the plans for the design or implementation of the current study. No patients or the public were involved in the interpretation of the results of the study or preparation of the manuscript. There are no plans to disseminate the results of the research to study participants.
Spatio-temporal comparison to characterise pertussis outbreaks in Olmsted County, MN
Age-specific incidence rates of pertussis
Descriptive statistics were used to summarise demographic characteristics of the pertussis cases and the REP population for each year. In each outbreak, age-specific incidence rates (number of cases per 1000) were calculated by the number of cases in each age cohort (<5 years, 5–10, 11–13, 14–17 and 18 or above) divided by the size of the REP Census age cohort as denominator.
Frequency of pertussis cases by month
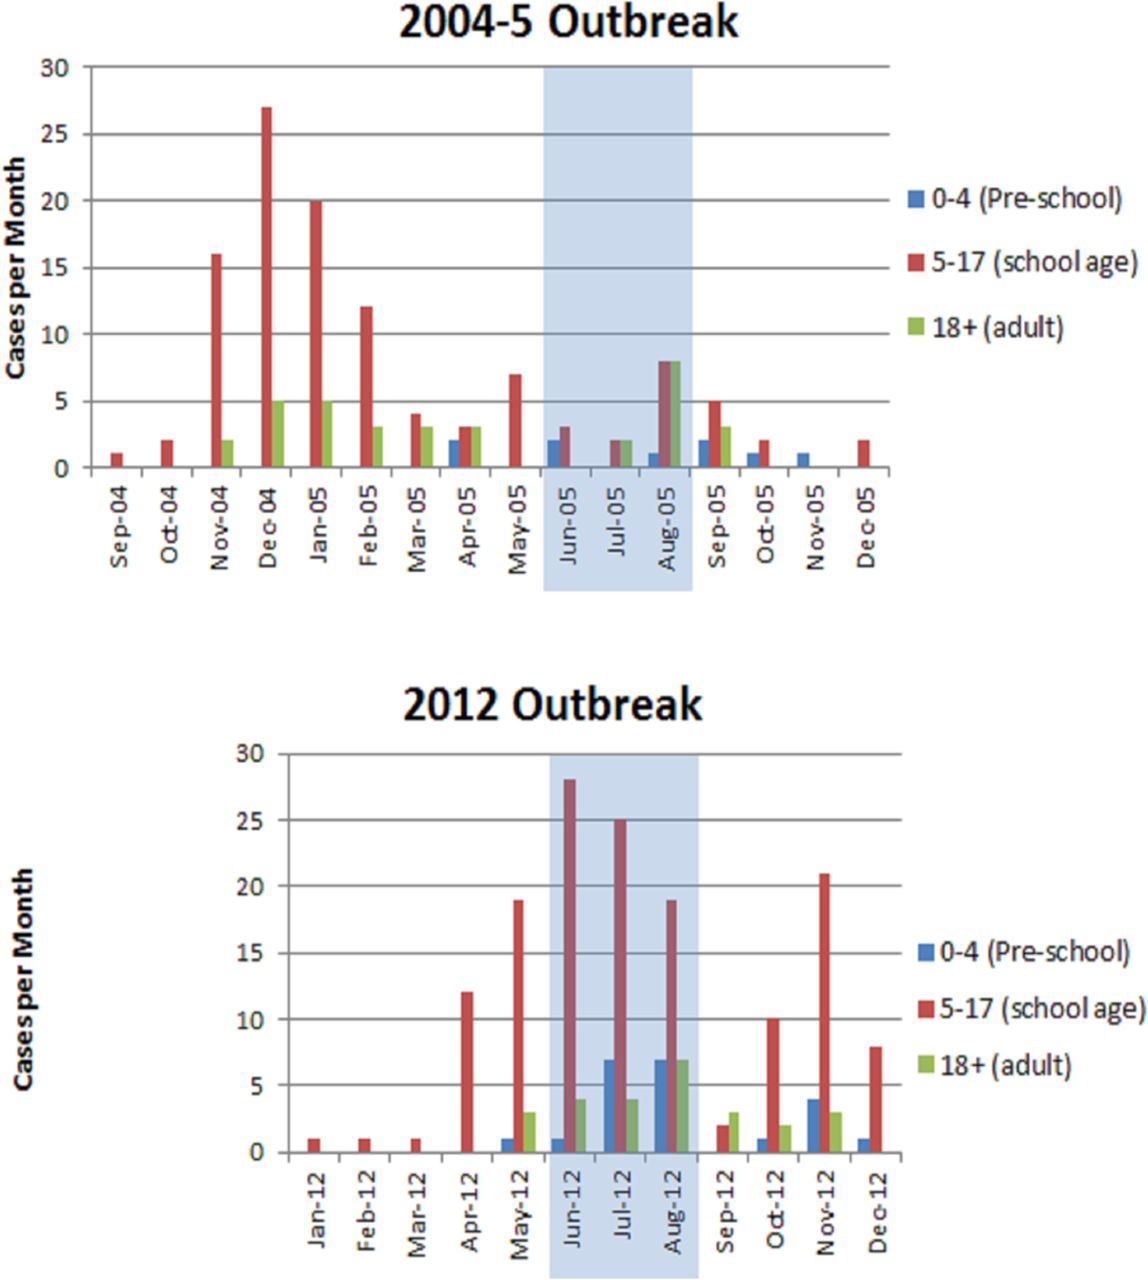
We graphed the distribution of pertussis cases by month in each outbreak to identify differences in seasonal patterns (eg, school season vs summer break) between two outbreaks. Graphs for both outbreaks distinguish three age groups: preschool (age <5), school age (5–17) and adult (age ≥18) because the incidence rates were similar within these groups and differed significantly between groups (see table 1). Similar groupings are reported in a vaccination effectiveness study.13
Basic characteristics and age-specific incidences of pertussis cases and REP population (ie, Olmsted County population) in 2004–2005 and 2012 whose addresses were successfully geocoded
Identifying areas of high observed case density
We identified areas with high concentrations of cases overall in each outbreak using the kernel density function in ArcMap V.10.4 (produced by ESRI). Conceptually, the kernel density function calculates the density of cases per unit of area, smoothed in accordance with parameters (bandwidth and cell size) specified in the geospatial analysis.30
We used a one-mile bandwidth, displayed with a cell size of 330 feet on a side (slightly smaller than an average city block), to identify high observed case density (hOCD) areas. We used a one-mile bandwidth for three reasons: (1) It is within 106 feet of the default bandwidth (5386 feet, Moran’s I z score 4.633, p value of 0.000004) for the 2012 outbreak, identified by the ‘incremental spatial autocorrelation’ tool in ArcGIS V.10.4.31 (2) Urban subdivision activity occurs in increments related to fractions of square miles and major roads tend to be one mile apart, creating neighbourhood boundaries in effect; land ownership and township roads are organised on a one-mile grid in rural areas, also. (3) Olmsted County has both low-density rural areas (11 people/square miles) and high-density urban areas (2000+/square miles). The one-mile bandwidth applies reasonably well to both areas. Narrower bandwidths would have yielded expected case values close to zero and would identify more hOCD areas of small case numbers (1 and 2 cases). Wider bandwidths would magnify the effect on hOCD areas of nearby single case spots (outside conventionally identified neighbourhoods). Areas with kernel density exceeding the 90%ile were defined as areas with hOCD. (Due to small sample size, conventional ‘hot-spot’ approaches with statistical significance measures are not applicable, so we avoid using the term.)
To investigate the spatio-temporal patterns in each outbreak, especially in the beginning of each outbreak, we added a temporal component to the analysis described above by dividing each outbreak into four roughly equal numbers of cases (‘quartiles’) during each outbreak period (eg, first quartile representing early pertussis cases) and deriving kernel densities for each set of cases.
Identifying areas with high expected case density
To determine the influence of age-specific population density,32 we identified areas with high expected case density (hECD) using the same approach as hOCD, taking into account age distribution and age-specific incidence. With the age and geocoded address of each individual in the REP Census, we applied the age-specific incidence rate to each individual’s residential location (ie, geocoded REP points, the address shared by the household, an individual dwelling unit or the parcel in the case of apartment complexes). The sum of these age-specific incidence values in a given residential location is the probability of a pertussis case occurring at that location. The expected case value equals the sum of the number of people in each age cohort times the age-specific incidence at each location. The kernel density value averages the location values over the bandwidth as described for observed values.
We then calculated the relative difference (OCD – ECD)/ECD. A relative difference of 1 indicates the area has an OCD value of twice the ECD value given the age distribution of the population. This was mapped where expected case density exceeded a value of 1 per square mile.
Results
Subject characteristics and age-specific incidence rates
Applying the exclusion criteria excluded 66 cases from the reported cases during 2004–2005 outbreak (47 with non–Olmsted County residency, 12 without research authorisation and 7 not-geocoded) versus 11 during 2012 outbreak (nine with non–Olmsted County residency and two without research authorisation). The remaining 157 cases in 2004–2005 and 195 pertussis cases in 2012 tended to be men and younger, compared with the REP Census (table 1). Pertussis cases occurred largely in children (78% in 2004–2005 and 89% in 2012) with the highest incidence rates among those aged between 11 and 13 years (9.6 per 1000 persons in 2004–2005 and 7.9 in 2012). Ages of children reported in 2012 were younger compared with 2004–2005, in part due to more cases occurring among children ages between 0 and 10 years in 2012. Difference in sex among cases was similar between the two outbreaks. Overall, the Olmsted County population characteristics between the two outbreak periods seem to be similar (tables 1, 2004 REP and 2012 REP).
Seasonal pattern of pertussis cases
Both outbreaks began during the school year, but the 2004–2005 pertussis outbreak had a higher incidence in the winter (part of school season: January, November and December: 85, 52%) with a peak in December 2004, whereas a majority of 2012 cases occurred during summer (June through August: 103, 53%) with peak in July 2017 (figure 1). In both outbreaks, initial higher peaks of incidence lasted approximately 4–5 months (ie, 2004 November to 2005 February for the 2004–2005 outbreak and 2012 April to August for the 2012 outbreak) followed by second peak with lower incidence 4–8 months after first peak.

Distribution of pertussis cases by month in Olmsted County, 2004–2005 and 2012 (first cases September 2004 and January 2012).
hOCD areas overall and by quartile: identification of geographical source and spread of each outbreak
We identified five hOCD aress in 2004–2005 and seven hOCD areas in 2012 overall which appeared to be partially, but not exactly overlapped (figure 2). However, hOCD areas at the first quartile included a consistent area of Northwest Rochester in both outbreaks (Cluster A, figure 3), despite different season of the first quartile for the two. This held true after accounting for population size and age, suggesting that this area may be an initial outbreak location in the future. However, second to fourth quartiles hOCD areas spread to inconsistent areas of the community during the course of each outbreak (Online supplementary figure 1). Season, duration, number of cases and density of hOCD areas for each quartile were inconsistent between the two outbreaks, suggesting different underlying mechanisms of transmission for the two outbreaks despite the consistent initial outbreak location, although there is still possibility of unidentified bias given relatively small number of laboratory-confirmed cases per each quartile and lack of comprehensive data for the outbreak. hOCD areas between outbreaks for school season versus summer (Onlinesupplementary figure 2) were also inconsistent.
Supplementary file 1
Supplementary file 2

Areas of HOCD in 2004–2005 versus 2012 pertussis outbreak. Five hOCD areas in 2004–2005 (blue) and seven hOCD areas in 2012 (orange; one each in Byron and Stewartville) were identified. They appear to be partially, but not exactly overlapped (brown areas), suggesting different epidemiological features of both outbreaks. hOCD, high observed case density.

![[bmjopen-2018-025521supp001.jpg]](https://bmjopen.bmj.com/content/bmjopen/9/5/e025521/DC1/embed/inline-supplementary-material-1.jpg?download=true)
![[bmjopen-2018-025521supp002.jpg]](https://bmjopen.bmj.com/content/bmjopen/9/5/e025521/DC2/embed/inline-supplementary-material-2.jpg?download=true)
Comparison of hOCD areas between two outbreaks during an early phase of outbreak (first quartile—86 days in 2004–2005, 145 days in 2012), Rochester Area, 2004–2005 and 2012. hOCD areas at the first quartile included a consistent area of Northwest Rochester in both outbreaks (Cluster A), despite different season of the first quartile for the two outbreaks, suggesting that this area may be a potential geographical risk factor and an initial outbreak location (ie, source) in the future. hOCD, high observed case density.
Impact of population density on pertussis outbreak
In 2004–2005, 43% of all pertussis cases were in hOCD areas with 37% of all cases in hECD areas. In 2012, 41% were in hOCD areas with 48% cases in hECD areas (Online supplementary table 1). In addition, 15% in 2004–2005 versus 9% in 2012 occurred in hOCD areas outside hECD areas, suggesting residential population density played a relatively larger role in 2012 compared with 2004–2005. The maps in online supplementary figure 3 show different geographical impact of population density on overall cases between two outbreaks. Online supplementary figure 4 overlaying two figures (ie, hOCD areas and hECD areas) shows hOCD areas (blue) were less likely to be overlapped with hECD areas (yellow–brown) in 2004–2005 than in 2012, again suggesting a larger role of population density in 2012 and of other unaccounted-for factors in 2004–2005.
Supplementary file 3
Supplementary file 4
![[bmjopen-2018-025521supp004.jpg]](https://bmjopen.bmj.com/content/bmjopen/9/5/e025521/DC4/embed/inline-supplementary-material-4.jpg?download=true)
Supplementary file 5
![[bmjopen-2018-025521supp005.jpg]](https://bmjopen.bmj.com/content/bmjopen/9/5/e025521/DC5/embed/inline-supplementary-material-5.jpg?download=true)
Discussion
To our knowledge, this is the first study to investigate spatio-temporal patterns in the onset and spread of pertussis outbreaks at different time points, using a well-defined population. While our study identified different spread patterns within outbreaks, we identified a consistent geographical area of early higher case density in both outbreaks in this community. Our spatio-temporal comparison reveals a geographical risk factor which may otherwise be missed by quantitative analysis.
Spatio-temporal analysis in identifying local areas with high density of outbreak cases may help find breakthrough risk factors. If spatio-temporal analysis identifies areas which have served as a consistent source or pathway for outbreaks in a local community, public health could use this information to further specify prevention recommendations. Our study finding of consistent hOCD areas at the beginning of two pertussis outbreaks is worth pursuing as it may help identify areas for further public health intervention. Given this study finding, we are planning to study the 2016 pertussis outbreak in Olmsted County to see whether the identified areas again had an early concentration of pertussis cases.
We previously showed that asthma increased risk of pertussis during 2004 pertussis outbreak,12 and demonstrated that socioeconomic status was associated with pertussis vaccine up-to-date status (defined by completion of all age-appropriate pertussis vaccinations), potentially impacting pertussis outbreaks.33 34 In this study, we showed that hECD areas accounted for 37% (58 cases) and 48% (93 cases) in 2004–2005 and 2012, respectively, suggesting that population density also played a role in these two pertussis outbreaks.35 36 Further studies using multilevel (individual-level and neighbourhood-level data) analysis will be needed to identify specific individual-level and neighborhood-level risk factors. These include the effect of membership in a neighbourhood with hOCD and its relationship to herd immunity, reflecting the literature regarding differences in vaccination rates in this community.8 10 Also, a multilevel analysis including vaccine up-to-date status by age subgroup and specific risk factors for pertussis such as asthma prevalence will help us better understand risk factors beyond the shift to acellular pertussis containing vaccines, especially when evaluating the increase in incidence in children aged less than 11 years from 2004 to 2005 and 2012 (table 1).8
The higher incidence of pertussis among adolescents in this community has been described previously.10 Pertussis outbreaks in this community occurred largely in children with a proportion of adolescents (aged 11–17 years) of 59% and 44% in the respective outbreaks, which is consistent with the literature that shows being 11–15 years of age was a risk factor for pertussis in Minnesota (2012) in the USA.22 23 Reasons for higher incidence of pertussis among adolescents could be explained by several possible mechanisms, such as rapidly waning immunity after administration of acellular pertussis vaccines, a low coverage booster vaccination and school-associated outbreak,7 10 11 13 37 38 but little is known about the potential role of suboptimal herd immunity due to low vaccine rate or waning antibody over time at a population level because it is hard to obtain community-level data on pertussis vaccine up-to-date status and vaccine titers.
Spatio-temporal comparison such as this has many potential implications. We used the first quartile of each outbreak as ‘the beginning’, which would not be applicable during an ongoing outbreak. In practice, the Minnesota Department of Health declares outbreaks by identifying either increased pertussis incidence compared with previous periods or by seeing several cases in a specific space or event (eg, school, activity).39 For example, in Olmsted County between 2009 and 2017, there were two county-wide pertussis outbreaks (2012 and 2016). The average number of pertussis cases (confirmed, probable, and suspect) per month during non-outbreak years ranged between 1 and 4 in this community compared with 20 and 22 during two outbreak years (2012 and 2016). Therefore, applying this rule (ie, 20 cases in any consecutive 30-day period) to our 2004–2005 and 2012 outbreak data, we were able to replicate the same initial hOCD (ie, Northwest Rochester). In both outbreaks, cases were clustered such that one or two schools had four to five cases in our datasets. Our findings can be useful to help identify areas where clustering is occurring that is not necessarily part of a specific space or event (ie, school, activity, etc). Early detection of hOCD areas could be very useful in reducing the extent of outbreaks through targeted community-based interventions (eg, school-based immunisation of non-up-to-date students who reside in neighbourhood with hOCD). If an area is an hOCD across multiple outbreaks, closer investigation of that area should be made to identify and reduce underlying individual and neighbourhood risk factors, especially for more vulnerable populations (eg, infants).40
The main strength of this study is identifying population-based hOCD and hECD areas. We also showed the inconsistent spatio-temporal pattern in the same community by comparing two outbreaks. This finding could give us some epidemiological insights into geographical risk factors and/or transmission routes during each outbreak, potentially further guiding surveillance of outbreaks and response strategies for public health.35 A limitation of our study is a relatively small number of cases despite the population-level data, resulting in inability of applying conventional ‘hot-spot’ approaches. Another limitation is including only laboratory-positive cases due to inability to obtain complete lists of linked cases and their addresses. Thus, we could not trace transmission through all plausible cases to identify possible core transmission routes. Third limitation is reliance on residential location which does not reflect differences in daily travel among age groups, which would likely influence exposure. Also, we have not investigated possible transmission pathways (eg, school bus, sports activity, mass gathering) for pertussis outbreaks which needs to be studied in the future with more comprehensive data. Lastly, the impact of change in vaccination protocols and status for populations (eg, introduction of Diphtheria, Tetanus, Pertussis Vaccine [DTaP] and Tetanus, Diphtheria, Pertussis Vaccine [Tdap]) between the two outbreaks was not addressed in this study.
In conclusion, while our study identified different spatio-temporal spread patterns between outbreaks, we identified a consistent area of higher case density at the beginning of the two outbreaks in Olmsted County. With further investigation, we may be able to initiate geographically targeted intervention for local areas with higher case density of pertussis using both traditional and non-traditional intervention.
Acknowledgments
This publication was made possible by CTSA Grant Number UL1 TR000135 from the National Center for Advancing Translational Sciences (NCATS), a component of the National Institutes of Health (NIH) and the resources of the Rochester Epidemiology Project (R01-AG34676) from the National Institute on Aging. Its contents are solely the responsibility of the authors and do not necessarily represent the official view of NIH. We would like to thank to Dr. Robin Patel for her data sharing and critical review and comments, Dr. Thomas G. Boyce, Dr. Raj Mody, Ms. Cynthia Kenyon and Mr. Victor Cruz for their critical review and comments, and Mrs. Kelly Okeson for her administrative assistance.
References
Footnotes
C-IW and PHW contributed equally.
Contributors Both C-IW and PHW contributed equally to the study conceptualisation, study design, data acquisition and analysis and edited the manuscript. HK contributed to the study conceptualisation, study design and data acquisition, and edited the manuscript. ER contributed to the study conceptualisation, study design, data acquisition and analysis, and edited the manuscript. DK contributed to the study conceptualisation and data interpretation, and edited the manuscript. YJ contributed to the study conceptualisation, study design, data analysis and interpretation, and edited the manuscript.
Funding YJ is the PI of ’The 2015 Innovative Methods for Asthma Award' supported by Genentech, the PI of Real World Evidence Pediatric Asthma Study supported by Roche/Genentech, and an advisory board member for Real World Evidence Project for Asthma supported by Genentech. This publication was made possible by CTSA Grant Number UL1 TR000135 from the National Center for Advancing Translational Sciences (NCATS), a component of the National Institutes of Health (NIH) and the resources of the Rochester Epidemiology Project (R01-AG34676) from the National Institute on Aging.
Competing interests None declared.
Provenance and peer review Not commissioned; externally peer reviewed.
Data sharing statement No additional data are available.
Patient consent for publication Not required.