Article Text

Abstract
Objective When faced with an emergent epidemic with high mortality and morbidity potential, policy makers must decide what public health interventions to deploy at different stages of the outbreak. However, almost nothing is known about how the public view these interventions or how they trade off risks (of disease) with inconvenience (of interventions). In this paper, we aim to understand public perceptions on pandemic interventions, as well as to identify if there are any distinct respondent preference classes.
Design A discrete choice experiment.
Setting This study was fielded in Singapore between November 2012 and February 2013.
Participants A random sample of 500 Singapore residents aged 21 and over, including 271 women and 229 men, was analysed.
Outcome measures Demographic information was collected from each participant. Participants were also shown a series of pairs of alternatives, each combining interventions and morbidity, mortality and cost outcomes and declared a preference for one combination. A random utility model was developed to determine the individual’s preference for interventions and a hierarchical cluster analysis was performed to identify distinct respondent preference classes.
Results On average, participants preferred more intense interventions, and preferred scenarios with fewer deaths and lower tax. The number of infections did not significantly influence respondents’ responses. We identified two broad classes of respondents: those who were mortality averse and those who were expenditure averse. Education was found to be a predictor of group membership.
Conclusion Overall, there was considerable support for government interventions to prevent or mitigate outbreaks of emerging infectious diseases, including those that greatly restricted individual liberties, as long as the restrictions showed a reasonable chance of reducing the adverse health effects of the outbreak.
- Public health
- discrete choice experiment
- emerging infectious diseases
- interventions
This is an Open Access article distributed in accordance with the Creative Commons Attribution Non Commercial (CC BY-NC 4.0) license, which permits others to distribute, remix, adapt, build upon this work non-commercially, and license their derivative works on different terms, provided the original work is properly cited and the use is non-commercial. See: http://creativecommons.org/licenses/by-nc/4.0/
Statistics from Altmetric.com
Strengths and limitations of this study
This study conducts discrete choice experiments that allow strength of preferences for different pandemic preparedness interventions among the general public to be estimated.
A hierarchical cluster analysis identifies key population subgroups that perceive the public health response differently from the general population.
The study design and statistical methods proposed in this study can be easily adapted to other settings.
The public reaction is unpredictable, and it may depend on the severity and symptoms of the disease.
Introduction
The last decade has witnessed the emergence of several emerging infectious diseases, including the first influenza pandemic of the 21 st century,1 avian influenza A(H7N9) outbreaks,2–4 a novel coronavirus (MERS-CoV) that emerged in Saudi Arabia5 and spread around the Middle East and Western Pacific,6 7 the Ebola crisis in Western Africa8 and the Zika outbreak in the Americas and Asia.9 10 When faced with such threats—the impact of which is hard to predict in advance, as witnessed in the very different impact of recent outbreaks (eg, a quarter of a million deaths for influenza A(H1N1pdm),11 over 10 000 deaths during the 2014/2015 Ebola crisis,12 or around 600 deaths from MERS-CoV13—policy makers worldwide have to decide which public health interventions to deploy should such an emerging infectious disease cause an outbreak in their territory. Following the emergence of the Severe Acute Respiratory Syndrome Coronavirus (SARS-CoV) in 2003,14 and the ongoing transmission of avian influenza A(H5N1) in Southeast Asia15 16 and China,17 WHO urged governments to develop pandemic preparedness plans18 as it revised the International Health Regulations in 2005.19 Details vary between countries,20 21 and the influenza A(H1N1) pandemic of 2009 demonstrated clearly that willingness to respond also varied substantially between countries, with several Asian countries adopting more aggressive response policies22–24 than the approach common in America and Europe, which could be described as being more proportionate to the severity of the epidemics that came to pass.
In the aftermath of the 2009 influenza pandemic, particularly severe criticism was voiced from some European quarters that health authorities and WHO over-reacted in their response to the influenza A(H1N1) pandemic of 2009.25 Others argued that the prior experiences with SARS-CoV and H5N1 justified a robust response to the influenza A(H1N1pdm09) pandemic in 2009.22 23 For instance, in Singapore, where SARS-CoV caused 238 infections, 33 deaths and reduced annual GDP by 1%,26 there was a strong governmental response, with over 8000 contacts of SARS-CoV cases quarantined.27 Singapore’s health authorities used similarly robust measures during the influenza pandemic in 2009, and initially mandated isolation of confirmed cases, quarantining of exposed individuals, and temperature screening in hospitals, public places and ports of entry.28 This was in spite of the paucity of evidence that such measures would make any difference to the overall course of the pandemic.
Since public acceptance is vital for many outbreak response policies to have the intended effect, public health decision making must go beyond accurate assessments of the severity of a threat and what measures might be effective against it. It has to calibrate policy to the public’s willingness to accept the trade-offs associated with a given response to the outbreak, and a framework is needed for assessing this while recognising the diversity of views between and within populations as to what they value. This framework must be able to accommodate a diversity of scenarios on the key characteristics of the threat, and the suite of public health interventions available.
Public health policy makers have several constituencies, but chief among these is the populace on whose behalf they make decisions. Yet, while tolerance and potential impact of interventions can (and should be) be assessed through surveys,29 when it comes to pandemic preparedness, it is remarkable how little is known about what interventions the general population actually wants their governments to undertake. This gap is especially noteworthy due to the considerable personal burden imposed by some interventions and the backlash against what some deemed excessive measures during the 2009 influenza pandemic.25 30
To this end, we conducted a ‘conjoint’ discrete choice experiment to explore the Singapore public’s willingness to accept certain containment and mitigation strategies under various outbreak scenarios, spanning a range of infection and fatality rates. Specifically, we assess three broad questions: (i) How informed are the public about infectious disease outbreaks and the effectiveness of different interventions? (ii) How much do the public support interventions—quarantine, isolation of contacts, school closure and mass screening—that restrict civil liberties in an outbreak? (iii) How consistent are overall preferences for intervention policies throughout the population? Are there subgroups whose preferences are in opposition to the majority? We hypothesised that the population would be broadly supportive of interventions that restricted their civil liberties, but that they might be averse to monetary impacts of those interventions. Our work was motivated by the past vulnerability of Singapore to a diversity of emerging infectious disease threats such as Nipah virus in the 1990s31 to SARS-CoV in 2003,32 Chikungunya in 2008,33 pandemic influenza A(H1N1pdm09) in 200934 and the Zika epidemic in 2016,35 and its perceived vulnerability to future threats, given its location at the centre of Southeast Asia where various highly pathogenic strains of avian influenza continue to spread, its role as a transport hub, its highly urbanised environment and its tropical climate, which permits year round transmission of many viruses.36 These results are hence intended to allow policy makers to identify policies which will have high levels of public support and are hence expected to translate into high levels of compliance, while exemplifying a method that can be used to address the same questions in different settings.
Methods
Fielding and sample
This survey was fielded in Singapore between November 2012 and February 2013 by a market research company contracted by the authors. The sampling frame was based on a list of households obtained from the Singapore national database of dwellings and continued until 500 responses with written informed consent were obtained, which required 1196 households to be contacted (yielding an unadjusted response rate of 41.8%). Respondent eligibility could not be determined in 41 households. The remaining households were found to have at least one eligible respondent (citizen or permanent resident aged 21 and over). For those with multiple eligible respondents, one was randomly selected to take the survey. Trained interviewers administered the paper survey face-to-face in English, Malay, Mandarin or Tamil. Participants were guided through the discrete choice experiment by the interviewer. The study was approved by the National University of Singapore Institutional Review Board. All methods were performed in accordance with relevant guidelines and regulations.
Survey structure
The survey questioned respondents’ travel habits, experience with two previous infectious disease outbreaks in Singapore (the 2009 influenza A(H1N1pdm09) pandemic and the 2003 SARS-CoV outbreaks), attitudes towards and knowledge of the effectiveness of interventions and beliefs about the burden of infectious diseases in Singapore. Participants were also asked how frequently they attended various crowded public places and whether they would reduce such attendance in response to an outbreak. Sociodemographic questions were also included.
The core of the survey was a discrete choice experiment (DCE), which is a method often used to identify preferences for, importance of, and willingness to pay (WTP) for specific features of products that are composed of multiple features. In this case, we used it to elicit preferences for specific policy responses to an infectious disease outbreak, and report WTP as an easy to understand scale of support. Each policy scenario consists of a number of attributes (eg, social distancing) and each attribute of a number of levels (eg, none, closure of schools or closure of schools and cancellation of mass gatherings). Each participant was provided a series of 10 pairs of hypothetical alternatives, and for each pair was asked to select one of the two options (with a combination of one level for each attribute) as being his or her preference. An example of a typical pair of options is provided in table 1. Each pair contains the same attributes but different levels of each attribute; the attributes and levels used are found in table 2.
A typical pair of sets of options. In this example, the individual selected scenario A over scenario B
Attributes and levels used in the discrete choice experiment. Each set of options contained one level for each attribute
The first four attributes include interventions which were used in Singapore and other countries at various points of the 2009 influenza pandemic, 2003 SARS outbreak and in response to other emerging outbreaks. The fifth assesses the tolerance to economic losses. The final two summarise the severity of the outbreak, in size (number of cases) and fatality rates.
Five of the seven attributes consisted of measures the government could take to restrict the spread of an emerging infectious disease. We excluded vaccination as a control measure due to the long lead time required to get a vaccine to market, which is 6 months for a reformulated influenza vaccine37 but can be much longer (for dengue, for instance, it has taken decades38). The Singapore government, during the 2009 influenza pandemic and 2003 SARS-CoV outbreaks, quarantined suspected cases and enforced the isolation of actual cases. Both of these measures were included as attributes with two levels for each: mandatory and voluntary. The cancellation of mass gatherings was also included as an attribute with levels ranging from no cancellations to the closure of schools and prohibition of other types of mass gatherings. Temperature screening using thermal scanners was used during both the two events in Singapore and was therefore also included with different levels indicating whether the screenings were to be conducted only at border checkpoints, at checkpoints and other sites within Singapore, or not at all. Finally, a monetary attribute was included which posited a hypothetical one-time tax to fund control efforts with the following values: S$15, S$20, S$40 and S$50 (in 2013 S$1≈US$0.80). The two remaining attributes described the outcome of an infectious disease outbreak in terms of two metrics: the expected number of infections (five levels ranging from 200 to 1 000 000 cases) and the expected number of infection-related deaths (five levels; 0–180 deaths). Attributes and levels for the survey were determined through literature review, cognitive interviews and piloting a draft instrument (n=50)39 to span plausible ranges for emerging infectious disease outbreaks or pandemics.
Following standard practice in DCEs,39 respondents saw a fractional DCE design that is statistically efficient, minimises level overlap (where levels do not vary across competing options) and ensures level balance (each level appears approximately the same number of times).40 The design was produced using Sawtooth SSI Web V.8.22 and included four versions, each version containing 10 tasks. Individual level data are available in online supplementary data 1 and supplementary data 2.
Supplementary data 1
Supplementary data 2
Analyses
Model overview
The analysis uses a random utility model (RUM), which posits that respondents choose the option which provides them greater satisfaction/utility. By regressing respondent choices on the policy attributes and levels, we derived preference weights for each attribute-level, when all other attribute levels are held constant. The model assumes that the utility of a given scenario is a linear combination of the utilities associated with each attribute of the scenario, from interventions to outcomes, plus Gaussian noise. In addition, a hierarchical model was developed in which individuals were allowed differing utilities, the output of which was used to cluster individuals into groups.
Model formulation
A single attribute
a
has  levels. A single set of policy/outcome options contains A attributes in all, and so the information about the set is contained in the object
  . To facilitate analysis, the information is reformulated as a vector of dummy variables,
  , where
  (1) is the total number of dummy variables, and where the dummy variables are coded 1 and 0 to indicate which levels are present for each attribute. One level per attribute is omitted to be treated as the baseline. We indicate sets via superscripts on the
  . The exception to this is the monetary variable which was left as a numerical value.
The average utility  over individuals in the population presented with a set of options b is modelled as a linear combination of utility components
 (2)
(2)
where the  capture the utility of each component. The utility experienced in the ith response is assumed to be
  (3). The respondent reports whether
  or not. If we denote the difference between these utilities as
  (4) then
  (5). We observe
  which is 1 if
  and 0 otherwise. The likelihood of the data therefore follows directly.
WTP for a given change in a policy scenario is the amount of cash (in this case a one-time tax) that would leave a respondent indifferent between paying (or receiving payment) for the attribute levels in a new scenario or remain with the original scenario. Although individuals cannot directly pay for public health interventions that apply to society as a whole, WTP serves as a useful gauge for strength of support for or against a policy measure. The WTP can be estimated by comparing the change in utility between the scenarios and the marginal utility of the tax attribute. The utility of tax was assumed to be linear, creating a single utility to money mapping that permitted the posterior distribution of WTP (in units of one Singapore dollar) to be derived by taking the ratio of the other  to the tax
β
.
to the tax
β
.
Subgroup analysis
We then employed a hierarchical cluster analysis with Wald’s method to identify distinct respondent preference classes. To account for the between-individual variation, a hierarchical model was fitted. This model is similar as the original model, but the utility parameter
β
varies by individual. The utility parameter,  , for individual
i
attribute
k
was assigned a Normal prior, that is,
, for individual
i
attribute
k
was assigned a Normal prior, that is,  (6). Following parameter estimation (see the ’Model fitting' section), the Euclidean distance matrix used for cluster analysis was calculated from posterior mean utilities associated with each attribute and each individual. The number of latent classes was determined using the dendrogram from the cluster analysis, centroid plot from a two-group linear discriminant analysis and elbow plot. Demographic predictors of class membership were then determined through logistic regression.
Model fitting
In the main model, flat prior distributions were assigned to each  and to
  . To ensure identifiability, one exception is made: the extreme level for one attribute (180 deaths) was set to −1 so that all other utilities are relative to that. The choice of the variable to anchor the utility scale to was made on pilot runs. In the hierarchical model used for clustering, the hyperprior distributions for
  and
and  followed a normal distribution
  and an inverse-gamma distribution with a shape of 0.1 and a scale of 0.1, respectively. The model was fit using the Rstan package41 that used the Stan language42 to sample from the posterior distribution for the parameters resulting from the model described above. This used a Hamiltonian Monte Carlo algorithm.43 In total, 500 000 draws with a thin of five iterations from the posterior were made, and convergence assessed visually. Analyses were done in R.44
Variant model
An alternative model was also constructed in which the linear tax variable was transformed using three dummy variables representing the tax effect of S$20, S$40 and S$50 compared with S$15. Similar results were obtained.
Results
Survey respondents
Table 3 presents demographic characteristics for the 500 respondents and for a comparable population from the 2010 Singapore census. Although the age, gender, racial group, employment status and family status distributions are similar between the groups, the sample has a higher proportion of those educated to a polytechnic diploma level or higher (45.2% compared with 38.0% in census).
Demographic characteristics of sample (n=500) and population. Sample racial groups are self-declared. Census racial groups accord with national registration
Attitudes and knowledge
The fraction predicting there would be an infectious disease outbreak in Singapore infecting >200 people over the next 12 months was 29% (95% CI 25% to 33%, see figure 1); the estimate for an outbreak infecting more than a million people (ie, around a fifth of the total population) was much lower (10%, 95% CI 7% to 12%). Mortality estimates also varied, with 20% (95% CI 16% to 23%) predicting it likely that there would be an outbreak which kills >30, and 9% (95% CI 6% to 11%) predicting one which kills >180 people, in the next year.

Risk perceptions, support for interventions during infectious disease outbreaks and belief in their effectiveness among 500 adult Singapore residents. Whiskers represent 95% CIs. (A) Estimates of risk of large outbreaks over the next 12 months in Singapore. (B, C) Support for mandatory isolation and quarantine in the event of an outbreak. A four-point Likert scale (strongly oppose, moderately oppose, moderately in favour, strongly in favour) is presented with stronger opinions to the left-most and right-most extremes of the plot. (D) Belief in the effectiveness of, experience of and support for the use of temperature screening. (E–H) Frequency of attendance at hawker centres (outdoor food courts), religious gatherings and festivals, shopping malls (black). Week/month/year stand for at least once a week/month/year. Within each frequency, the number reporting they would not reduce their attendance in the event of an outbreak is overlaid (white), excepting those who never attend such activities.
When asked about each intervention in isolation, a large majority of respondents favoured a policy of quarantine for potentially infected contacts (83%, 95% CI 79% to 86%, see figure 1). Isolation for diagnosed cases of infection was favoured by an even larger proportion (95%, 95% CI 93% to 97%). Most of the sample was also in favour of temperature screenings (although the proportion was higher for screenings conducted at the border than elsewhere: 95% (95% CI 94% to 98%) vs 89% (95% CI 87% to 92%)). Temperature screening was thought to be somewhat or very effective by 91% (95% CI 89% to 94%) and quarantine by 95% (95% CI 94%to 97%).
On attendance at crowded events or venues, the venue most frequently attended by survey participants were hawker centres (naturally ventilated food courts), where 29% (95% CI 25% to 33%) went daily, and 48% (95% CI 43% to 52%) went weekly. A substantial fraction (60%, 95% CI 56% to 64%) reported going to shopping malls at least weekly, as opposed to 28% (95% CI 24% to 32%) who reported going to religious gatherings and 3% (95% CI 2% to 5%) to festivals. When asked whether they would limit attendance at mass gatherings in the event of an infectious disease outbreak, a significant proportion reported they would not: 58% (95% CI 50% to 67%) of those attending religious gatherings weekly and 51% (95% CI 43% to 59%) of daily hawker centre patrons stated they would not reduce the frequency of attendance.
Overall preferences for interventions and WTP
Figure 2A presents utilities for the entire sample excluding seven with missing responses (full regression results are included in the supplementary materials). In outbreaks with at least 200 cases (the scenarios proffered), the sample as a whole marginally preferred mandatory to voluntary quarantine and isolation. They also favoured the cancellation of all mass gatherings and temperature screenings at sites all around Singapore. The two certainties of life—death and taxes—were disfavoured, but respondents’ preferences were not influenced by the number of infections.

Preference weights for policy scenario attributes, elicited by a discrete choice experiment. Overall (A) and in two subgroups (B, C) identified via hierarchical cluster analysis. Attribute levels with larger (positive) utilities are preferred to those with smaller (negative) utilities. The figure reflects estimated coefficients from the probit model, with the utilities for voluntary quarantine, voluntary isolation, no social distancing, no temperature screening, 200 infections and 0 deaths being set to 0. For panel (A), the utility for 180 deaths is set to −1 for identifiability, all other utilities are therefore relative to it. Bars indicate 95% credible intervals. For panels (B, C), utilities are stratified posterior means from the Bayesian hierarchical model, and bars indicate 95% CIs.
Table 4 shows how respondents valued, in monetary terms, different policy options or outcomes, based on their estimated WTP (parameter estimates (posterior means, 95% credible intervals) are presented in online supplementary table S1 and table S2 for the models with and without linear terms for the tax attribute). In general, respondents preferred more intervention, rather than less, and were willing to accept a loss of S$370 million at the societal level for the full set of interventions considered for implementation. Participants indicated via their choices a willingness to accept (personal) costs of up to S$34 (S$19, S$58) to prevent 30 deaths, S$70 (S$45, S$112) to prevent 80, S$71 (S$49, S$109) to prevent 120 and S$98 (S$69, S$148) to prevent 180—at a national level, these imply a WTP ∼ S$0.5M to S$1M for each life saved. The value placed on a strong response (mandatory isolation and quarantine, cancelling all mass gatherings, and island-wide screening), S$74, thus approximately corresponded to the value placed on preventing 100 deaths.
Supplementary table
WTP to move between options. The WTP figures indicate the cash amount (in Singapore dollars, at 2013 prices S$1≈US$0.80) required to make respondents indifferent between two neighbouring attribute levels, with arrows representing the direction in which the individual would be willing to pay to move. For instance, participants would pay S$15 (as revealed by their choices) to move from a voluntary to a mandatory quarantine policy
Group preferences
The hierarchical cluster analysis determined that the sample included two subgroups, and based on the following results we labelled these groups mortality-averse and expenditure-averse (estimates in online supplementary table S1 and table S2). Cluster analysis results for these groups are shown in figure 3, while utilities for the two groups are presented in figure 2B,C. The mortality-averse group (n=317, 63%) was in favour of the actual deployment of interventions, whereas the expenditure-averse group (n=183, 37%) expressed a strong disutility for a tax to cover the response and were ambivalent about mandatory isolation of confirmed cases. Both groups, as expected, favoured a lower number of deaths, although the strength of preference varied substantially, with the mortality-averse group expressing a large disutility and the expenditure-averse a much smaller one. Neither group found reducing the number of infections important.
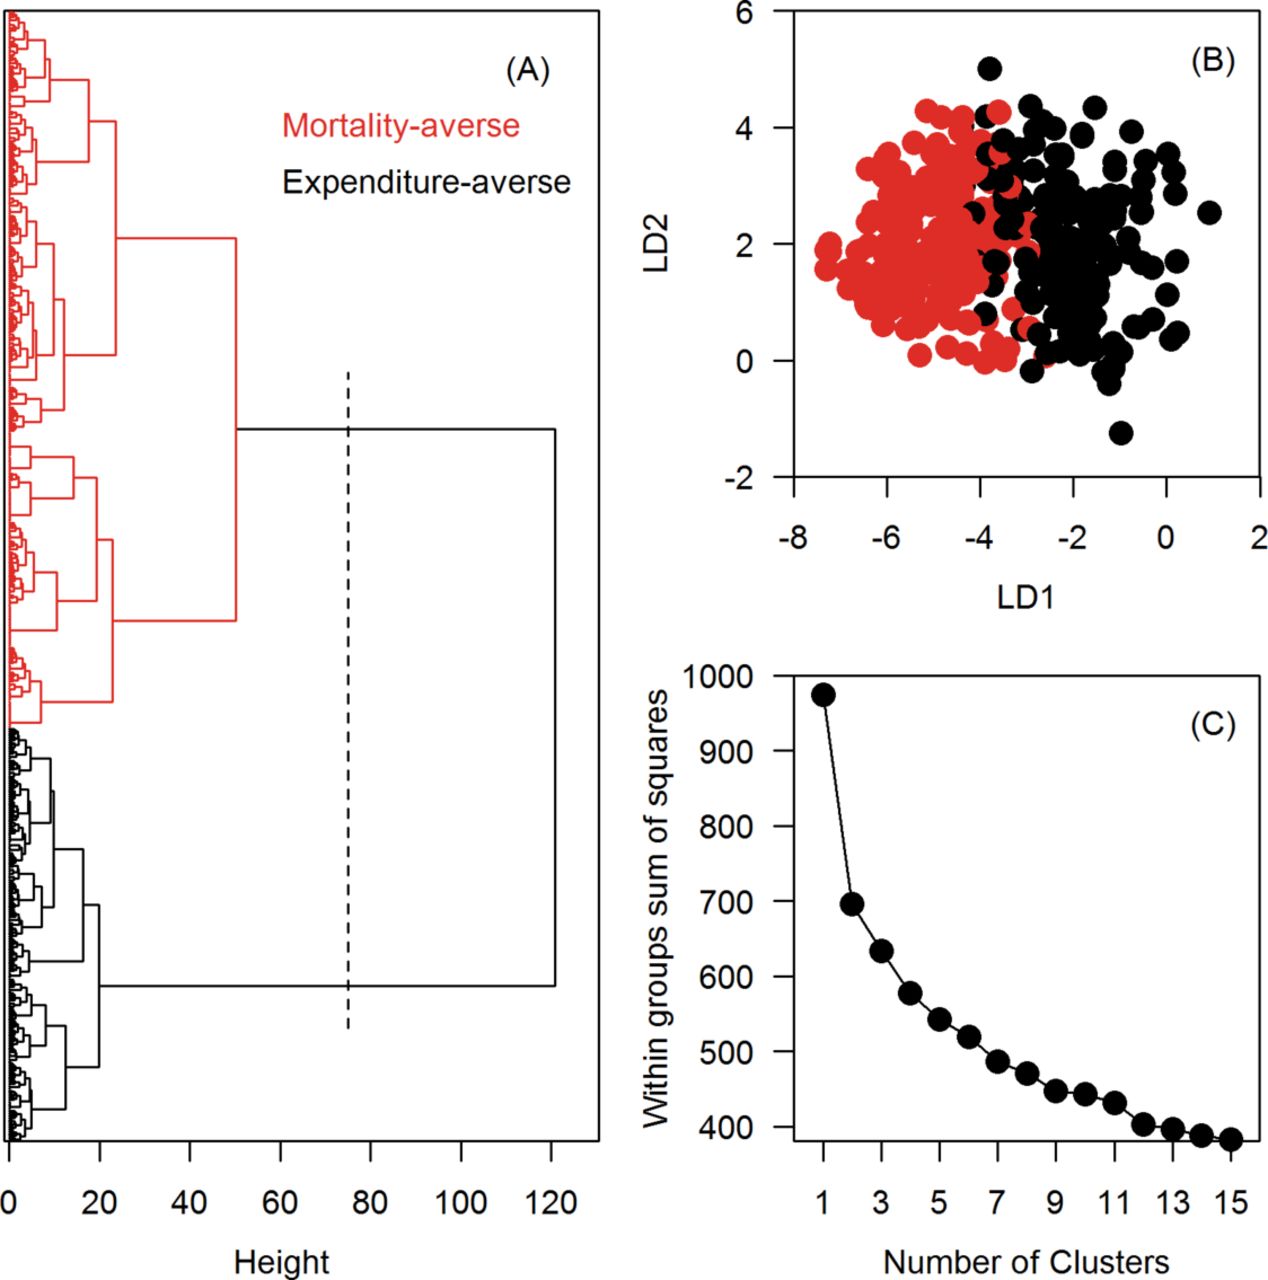
Identification of distinct respondent preference classes among 500 adult Singapore residents using a hierarchical cluster analysis. (A) A dendrogram of the hierarchical cluster analysis (Wald’s method). The x-axis measures the closeness of either individual points or clusters. (B) A centroid plot shows the first (linear discriminant (LD)1, x-axis) vs the second discriminant function (LD2, y-axis) from a two-group LD analysis. (C) An elbow plot validates the number of clusters. The ‘elbow’ on the line is at two clusters.
Predictors of class membership
Those with postsecondary school education were more likely to belong to the mortality-adverse group than to belong to the expenditure-averse group (adjusted OR 1.71, 95% CI 1.12 to 2.61). Other demographic variables were not predictive of class membership (see figure 4).

Demographics of participants classified as expenditure averse (imperial red) and mortality averse (navy blue). Whiskers indicate 95% CIs. NILF, not in the labour force.
Discussion
Research on interventions to prevent or mitigate pandemics has assessed their effectiveness, using modelling45 46 or empirical evidence,47 48 on their indirect effects,49 50 their economic impacts51 52 and the legal and ethical issues surrounding their use.53 This paper presents what we believe to be one of the first studies to measure the preferences of members of the public for control policies that form part of established pandemic preparedness plans.
As in many countries, Singaporean law permits the government to curtail civil liberties in response to an infectious disease outbreak (in Singapore’s case, under the Infectious Diseases Act), but the use of this power to isolate cases or quarantine potential cases requires careful weighting of the risk to others from not acting versus the loss of liberty of the individual being isolated or quarantined.53 Our survey found that most Singaporeans reported a high tolerance for interventions that curtail individual liberties, which may be related to their long-standing acceptance of a paternalistic streak in their government.54 Most participants supported the isolation of known cases and the quarantine of potential cases, both strategies that have been used in recent history in Singapore: in 2003, thousands of contacts of SARS-CoV cases were isolated or put under daily telephone surveillance,27 while in the early period of the 2009 epidemic, cases with confirmed influenza A(H1N1pdm09) infection and their household contacts were isolated at home, with foreigners detained in Government Quarantine Facilities.55 While such popular support does not justify a policy of isolation or quarantine per se, it may facilitate the effective implementation of such a policy.
Overall, utilities of all participants were high for the more intense control measures, that is, given the same number of infections and deaths, respondents reported preferring mandatory isolation, quarantine and social distancing. It is not clear how effective social distancing measures would be in a mild outbreak, however, as many respondents reported that they would not voluntarily reduce how frequently they go out to eat or shop. It may be the implicit recognition of this that made the majority of participants recognise that isolation and quarantine should be mandatory rather than voluntary. Results reveal that the preferences of the population are not uniform; respondents could be broadly categorised into two groupings: one group (mortality averse) was strongly motivated to reduce the number of deaths and willing to accept interventions that did so, whereas another (expenditure averse, 37% of our respondents) was tax averse, and not in favour of any measures that might increase their taxes, even at levels comparable to the per capita costs of Singapore’s routine dengue vector control programme.56
Discrete-choice experiments can inform policy makers as to how much support there would be for potentially disruptive measures such as quarantine, isolation and school closures, and what kind of public health information might garner support from those otherwise not in favour. In Singapore, given our findings, this might involve stressing the necessity of such measures to reduce mortality, to co-opt the mortality-averse group, and to minimise the economic impact, to gain support from the sizeable tax-averse group. Studies such as this one can also identify misperceptions among the public that may hinder support for effective control. Two such examples surfaced in our study: (1) temperature screening island-wide received considerable support by our survey participants, although temperature screening at the country’s main airport was estimated only to pick up around one imported case in four in 2009,28 and was increasingly ineffective as the infection became more widespread,57 and (2) the predicted risk of infectious disease outbreaks was considerably underestimated: 2013 saw ∼ 20 000 dengue infections in Singapore, but the mean forecast risk of an outbreak infecting at least 200 people was a mere 29%. Future studies might evaluate the effect of priming respondents with accurate public health information before eliciting their preferences. We included interventions that would be considered for use in response to an emerging infectious disease, and so did not consider vaccination given the lead time needed to develop a vaccine. For many vaccine-preventable infections, however, decisions about whether to be vaccinated are made by the individual, rather than by the government, and so alternative study designs might be better suited to determining features that lead to vaccine uptake and support, such as standard cross-sectional surveys.58 Ethical issues regarding loss of liberty during an outbreak were not covered in our experiment, and should be explored in future studies, together with more contextual information on why policies were favoured or not.59
Beyond its direct application to Singapore, our work holds a wider relevance on how governments and global health authorities can use such methods to inform better management of epidemics and pandemics. It has been argued that, during the influenza pandemic in 2009, the failure of WHO and government health agencies was not so much in their assessment of the severity of the threat or what interventions might be effective against it, but in being able to effectively communicate the risk and the benefits of select mitigation strategies.60 61 Prior assessment of population level preferences could help identify thresholds of epidemic severity which could serve as triggers for the implementation of more disruptive measures. In addition, information from such surveys could be used to explain the rationale for particular decisions, with hierarchical cluster analysis used to support the targeting of different messages to audiences with different values. Whereas surveys have been performed retrospectively to gauge support for government responses to specific circumstances like the SARS-CoV outbreaks in 2003 and influenza pandemic in 2009,62 63 our method is the first conjoint analysis that quantifies public support for government interventions over a realistic range of outbreak scenarios and parameters.
Singapore is a city state in the centre of Southeast Asia that has experienced several emerging infectious disease threats and where there is a general acceptance that some civil liberties be constrained for the overall public good.54 Her people mostly originate in China, India and the Malay Archipelago, and, culturally and socially, Singapore has much in common with other countries in South, East, and Southeast Asia. Our study may therefore shed light on attitudes towards response to infectious disease threats in Asia, a hotspot for emerging infectious diseases.64 Future research should extend the approach to African, American and European settings, where attitudes on the role the state should play in responding to public health threats may differ.
The current study does have limitations. The response rate was low (41.8%) and although there were no significant differences when compared with the population age, gender, race, employment or family data, those with higher education were over-represented in our sample. A further limitation is that the study design elicits the public’s preferences and trade-offs between known interventions and known outcomes of those interventions. However, at an early stage of an outbreak of a novel pathogen, policy makers face grave uncertainty about the outcomes of interventions because the characteristics of the pathogen’s transmission routes and potential, the severity and symptoms of the disease it causes, and the public reaction is unpredictable. As a result, the decisions by policy makers must continue to be based on scientific advice and political imperatives. Surveys such as this one permit a better understanding of those political imperatives in emerging infectious disease outbreaks.
In conclusion, we report what we believe is the first discrete choice experiment to assess support for policies to control an emerging infectious disease outbreak, finding high levels of support among the Singaporean population for interventions that curtail individual liberties. Similar studies in other settings would be useful for public health decision makers.
References
Footnotes
Contributors Conceived the study: ARC, MICC, EAF. Oversaw data collection: EAF. Performed analyses: ARC, XZ. Wrote the paper: ARC, XZ, MICC, EAF.
Funding The work was funded by Singapore’s National Medical Research Council, grant NMRC/H1N1R/005/2009, the Ministry of Health, Singapore, grant CDPHRG/0009/2014 and the Centre for Infectious Disease Epidemiology and Research. The funders had no role in study design, data collection and analysis, decision to publish or preparation of the manuscript.
Competing interests None declared.
Patient consent Not required.
Ethics approval National University of Singapore Institutional Review Board.
Provenance and peer review Not commissioned; externally peer reviewed.
Data sharing statement All data analysed during this study are included in this published article (supplementary data 1 and 2).