Article Text

Abstract
Objective Despite tremendous efforts to scale up key maternal and child health interventions in Zambia, progress has not been uniform across the country. This raises fundamental health system performance questions that require further investigation. Our study investigates technical and scale efficiency (SE) in the delivery of maternal and child health services in the country.
Setting The study focused on all 72 health districts of Zambia.
Methods We compiled a district-level database comprising health outcomes (measured by the probability of survival to 5 years of age), health outputs (measured by coverage of key health interventions) and a set of health system inputs, namely, financial resources and human resources for health, for the year 2010. We used data envelopment analysis to assess the performance of subnational units across Zambia with respect to technical and SE, controlling for environmental factors that are beyond the control of health system decision makers.
Results Nationally, average technical efficiency with respect to improving child survival was 61.5% (95% CI 58.2% to 64.8%), which suggests that there is a huge inefficiency in resource use in the country and the potential to expand services without injecting additional resources into the system. Districts that were more urbanised and had a higher proportion of educated women were more technically efficient. Improved cooking methods and donor funding had no significant effect on efficiency.
Conclusions With the pressing need to accelerate progress in population health, decision makers must seek efficient ways to deliver services to achieve universal health coverage. Understanding the factors that drive performance and seeking ways to enhance efficiency offer a practical pathway through which low-income countries could improve population health without necessarily seeking additional resources.
- Technical Efficiency
- Data Envelopment Analysis
- Scale Efficiency
- Health Systems Performance;
This is an Open Access article distributed in accordance with the Creative Commons Attribution Non Commercial (CC BY-NC 4.0) license, which permits others to distribute, remix, adapt, build upon this work non-commercially, and license their derivative works on different terms, provided the original work is properly cited and the use is non-commercial. See: http://creativecommons.org/licenses/by-nc/4.0/
Statistics from Altmetric.com
Strengths and limitations of this study
The study measures technical and scale efficiency at the district level, the lowest health system management unit in most developing countries.
Data envelopment analysis is used to determine sources of inefficiency in the health system.
The study covers only maternal and child health, although the health system also encompasses other broader programmatic areas.
Introduction
The decentralisation of health services has been pivotal in efforts to promote universal health coverage across the developing world.1–3 There are many drivers of this trend, but improvements in service delivery remains an implicit motivation in most decentralisation efforts.2 ,3 This is anchored mainly around the ideals and principles of local ownership and accountability in service delivery, as well as meeting key health system goals with respect to equity, efficiency and responsiveness.1–4
As in most other countries, Zambia has embraced a decentralised health system model since 1992 as a pathway towards equitable access to health services for its population.3 ,4 This entailed the devolution of key decision-making and implementation functions to the provincial and district level, where stewards were assigned specific roles aimed at meeting national health policy objectives. Consequently, health resources were directed towards districts, which were given primary responsibility in the delivery of key health services to meet various local population health needs.3 ,5–7
In this arrangement, the central government is largely focused on setting national priorities and allocating health resources to subnational units based on projected health needs. In practice, this involves the Ministry of Health (MOH) providing budget ceilings to all the district health offices, which then make their own plans and budget for their activities in alignment with local projected health needs, bearing in mind the budget ceiling.3 ,5 Meanwhile, donor organisations channel their funding primarily through non-governmental and faith-based organisations involved in health service provision at the district level.4 ,6 ,8 The Provincial Health Offices occupy an intermediate position between the national and district levels and mainly serve in an oversight role for the districts nested within their respective jurisdictions.3 ,5 ,6 The organisation of the health system is aimed at ensuring equity in health service delivery, a core health objective of the government of Zambia.5–8
Despite these efforts, an in-depth investigation of the country's health system performance reveals wide subnational heterogeneity in goal attainment. This underscores the need to understand the root cause of the differences in performance across subsystems so that the lessons drawn from high-performing subunits can be informative for those that are lagging behind.3 ,4 ,7–9 A systematic and objective comparison of goal attainment and resource allocation across health subunits in Zambia is timely. The results could provide a valuable benchmarking framework in the effort to drive the country's health systems towards better performance.4 ,9 ,10
In this paper, we make a systematic comparison of performance across districts and provinces in Zambia, paying attention to the priority area of child survival as a key health system outcome. Health intervention coverage for maternal and child health services is used as the measure of health system output, whereas the human and financial resources allocated to districts are considered the health system inputs. Further, we seek to demonstrate how data envelopment analysis (DEA)11 can be applied in efficiency benchmarking and comparative performance assessment for a decentralised health system.
Conceptual framework
The conceptual framework proposed here borrows its fundamentals from the WHO Health System Framework, which effectively connects health inputs with health outputs, processes and outcomes.2 The framework identifies six discrete pillars that must function in tandem to meet expected health goals.2 ,4 ,8–10 The six pillars of a well-functioning health system include the following: good health service provision, adequate and progressive health financing, well-functioning human resources, good governance and leadership, a well-functioning health information system and access to and equitable distribution of essential medicines and health technologies.2
In our analysis, we have focused on human resources and health financing as the key health systems inputs underlying the production function used in the estimation of efficiency scores. Meanwhile, health intervention coverage is the intermediate health system output through which changes in health outcomes (in this case mortality among children under 5 years of age) are realised. Health intervention coverage was constructed as a composite metric comprising diphtheria, pertussis, tetanus vaccine-3 doses (DPT3) and measles immunisations, skilled birth attendance and malaria prevention. The approach employed in the construction of this metric and its merits are further discussed in the methods section.
We selected under-5 mortality rate (U5MR) in our assessment of district health system performance, as it is a key indicator used to monitor progress towards the reduction of child mortality rates, which was a key objective of the Millennium Development Goals. This indicator is further recognised as a good measure of overall population health, particularly in developing countries. Meanwhile, our health intervention coverage—as a measure of health system output—is composed of essential maternal and child health interventions that are critical for child survival in most developing countries in the tropics.4 ,8 However, given that health outcomes depend on a variety of factors, some of which are under the control of the health sector and some of which are not, we remain cognisant of the fact that there may not be a direct relationship between improvement in health system inputs and the achievement of better health system outputs and health outcomes.11 Another point that deserves equal attention with regard to the study is the fact that efficiency estimates refer to the efficiency of an output (or an outcome) for a given level of input; they do not refer to the level of the output (or outcome) itself. In other words, it is still possible for a district or a country to be fully efficient and yet have lower output and/or outcome levels.12 We have attempted to explore this further in the assessment of district health system performance.
Methods
In the definition of efficiency, a distinction should be made between technical, allocative and scale efficiency (SE) measures.13–15 In this study, only technical and scale efficiencies were considered, mainly because the input prices needed for the estimation of cost functions were not available to us.12 ,14 To estimate the efficiency scores, we employed the Banker, Charnes and Cooper (BCC) formulation of the DEA model. The choice of the BCC approach is partially guided by the fact that all our variables were ratio based, and we endeavoured to take economies of scale into account in the analysis. In addition, similar to all other DEA models, the BCC model handles multiple inputs and outputs, an approach that is particularly suited to complex fields such as health systems,13 ,15 in which there is a multidimensional mix of input and output variables that have to be considered simultaneously.15–18 Further, we applied the approach developed by Charnes, Cooper and Rhodes to enable us to decompose the overall efficiency score into scale and pure technical efficiency (PTE).
Given that each decision-making unit (DMU) may face locally unique conditions, the DEA approach assesses each unit separately, assigning a specific weighted combination of inputs and outputs that maximises its efficiency score.13 ,15 Algebraically, this is achieved by solving for each DMU (district) the following linear programming problem.15
where yo0, quantity of output ‘o’ for DMU0; uo, weight attached to output o, uo>0, o=1, …….., O; kio, quantity of input ‘i’ for DMU0; vi, weight attached to input i, vo>0, i=1, …….., I.
The equation is solved for each DMU iteratively (for n=1, 2,…, N); therefore, the weights that maximise the efficiency of one DMU might differ from the weights that maximise the efficiency of another DMU.17 ,18 Theoretically, these weights can assume any non-negative value, whereas the resulting technical efficiency scores can vary only within a scale of 0–1, subject to the constraint that all the other DMUs also have efficiencies between 0 and 1.
However, the ratio formulation expressed above leads to an infinite number of solutions, because if (u*, v*) is a solution, then (αu*, αv*) is another solution.15 ,17 ,19 ,20 To avoid this problem, one can impose an additional constraint by setting either the denominator or the numerator of the ratio to be equal to 1 (eg, v'xj=1), which translates the problem to one of either maximising weighted output subjected to weighted input being equal to 1 or of minimising weighted input subjected to weighted output being equal to 1.15 ,21 This would lead to the multiplier form of the equation as expressed as follows:15 ,19 ,20
subject to:
v’xj=1,
μ’yj−v’xj ≤0, j=1,2 …..J,
μ, v ≥0.
This maximisation problem can also be expressed as an equivalent minimisation problem.15 ,19
Technically, a DEA-based efficiency analysis can adopt either an input or output orientation. In an input orientation, the primary objective is to minimise the inputs, whereas in an output orientation, the goal is to attain the highest possible output with a given amounts of inputs. In our case, an output-oriented DEA model was deemed more appropriate based on the premise that district health teams have an essentially fixed set of inputs to work with at any given time.3 ,5 ,6 In other words, the district health system stewards would have more leverage in controlling outputs through innovative programming rather than by raising additional resources.
As performance and institutional capacity are expected to vary across districts,4 a variable returns to scale (VRS) approach was also considered more relevant to the study setting. This approach allows for economies and diseconomies of scale rather than imposing the laws of direct proportionality in input–output relationships as espoused in a constant returns to scale model.16–22 A VRS model also offers the advantage of decomposing overall technical efficiency (OTE) into PTE and SE, which is essential in locating the source(s) of differences in performance across production units.16–18
The analyses were performed using R V.3.2.1, specifically the r-DEA package that has the capability to combine input, output and environmental variables into one stage of analysis. This package implements a double bootstrap estimation technique to obtain bias-corrected estimates of efficiency measures, adjusting for the unique set of environmental characteristics under which different DMUs are operating.11 ,23 To obtain robust estimates, we bootstrapped the model 1000 times and generated uncertainty around the estimates.23 ,24 The same approach was used to generate robust DEA efficiency scores corresponding to health intervention coverage, applying the same input and environmental variables.
Data sources
We used data from the Malaria Control Policy Assessment (MCPA) project in Zambia, which compiled one of the most comprehensive district-level data sets of U5MR, health intervention coverage and socioeconomic indices in the country based on standardised population health surveys.4 ,8 For both indicators, to capture the most recent period for the country, the data representing the year 2010 were used.
In our DEA model, U5MR was used to measure district health system outcomes. To measure the outcome, output and inputs in the same direction in such a way that ‘more is better’, we converted the probability of dying before 5 years of age (which is conventionally known as the U5MR) into the probability of survival to age 5. This was accomplished by simply subtracting the reported U5MR per 1000 live births from 1000.11 ,25 Health intervention coverage was a composite metric that consisted of the proportion of the population in need of a health intervention who actually receive it.4 ,8
The composite metric consisted of DPT3 and measles immunisations, skilled birth attendance and malaria prevention. For malaria prevention, we included an indicator approximating malaria prevention efforts across districts, that is, a combination of insecticide-treated net ownership and indoor residual spraying coverage. The average of all five health interventions for each district was used to represent health intervention coverage.4 This innovative method of data reduction by combining a range of health interventions has the advantage of reducing the number of variables that are entered into the model. This in turn helps to maintain a reasonable balance between the number of DMUs and the input and output variables. This is required to avoid a scarcity of adjacent reference observations or ‘peers’, which if not addressed would lead to sections of the frontier being unreliably estimated and inappropriately positioned.15 ,16 ,18
For the inputs portion, we obtained a data set of annual operational funds from the governments of and donors to each of the 72 districts for the year 2010. These data are available through the Directorate of Health Policy and Planning of the MOH.8 Using population data from the Central Statistics Office of Zambia, we calculated the total population-adjusted funds disbursed to each district. We also obtained data from the MOH on the human resource complement for the year 2010, which covered the medical professionals (doctors and clinical officers) and nurses (including midwives) in each district and adjusted the data for the district population.
In addition, we included the mean years of education among women aged 15–49 years, the proportion of district funds originating from donors, household access to electricity and the proportion of households with improved cooking methods as environmental variables that are external to district health units but nonetheless affect the performance and efficiency levels of the health system. These variables were chosen based on their importance in addressing the key global health targets related to maternal and child health in Africa.1–3 Donor funding is a major feature in African health systems and has been the subject of major debate in efforts to strengthen health systems. Similarly, the relationship between health and education, particularly among women, has been extensively documented.2–4 ,8 Both data sets were obtained from the MCPA database.
Ethical approval
Permission to conduct the study was obtained from the MOH, Zambia. Since our study used only de-identified secondary data, we were granted an exemption from the institutional review board, University of Zambia: IRB00001131 of IROG000074.
Results
Descriptive statistics
Table 1 presents descriptive statistics for the variables used in the study. The range for inputs and outputs is quite wide. For example, the U5MR across districts varies between 87.16 deaths/1000 live births and 161.96 deaths/1000 live births, whereas health intervention coverage varies from 44.20% to 93.42%. Similar patterns are apparent for the health workforce and financing indicators, for which the distribution of nursing personnel ranged from 5.16 nurses/1000 population to 33.03 nurses/1000 population, whereas total funds to districts ranged from 4.24 million ZMK/1000 population to 23.77 million ZMK/1000 population. This suggests that at the subnational level, the Zambian health system is quite heterogeneous.
Summary statistics of the variables
Table 2 displays provincial comparisons of the input, output and outcome variables, revealing further heterogeneity across the country. For instance, in the predominantly urbanised Copperbelt province, health intervention coverage was as high as 81.05% (95% CI 75.31% to 86.78%). In comparison, the predominantly rural North-Western province had a coverage rate of 61.64% (95% CI 53.80% to 69.48%). Even within provinces, there was significant heterogeneity given that all the provincial estimates of health intervention coverage had wide CIs of >10% points. This trend further underscores the differences in goal attainment across the districts in the country. Similar differences were also observed with respect to the under-5 survival rate: the provincial estimates revealed a wide gap across provinces, with the Southern province topping the list with 898.14 survivors/1000 live births (95% CI 892.64 to 903.63) and the Northern province lagging with 869.82 survivors/1000 live births (95% CI 862.25 to 877.38).
Summary of variables by province
Overall efficiency, pure technical efficiency and scale efficiency
Figure 1 shows the estimates of OTE scores that were obtained using an output-oriented, bias-corrected DEA model across the 72 districts of Zambia with the under-5 survival rate as our outcome indicator. A value of 1 indicates that a district produces at the frontier; the lower the value, the farther the district is from the efficient frontier. Consistent with the input, output and outcome indicators shown in table 1, the results shown in figure 1 portray a deeply heterogeneous picture in terms of OTE across subnational units. For example, the worst and best performing districts, Luangwa at 31.0% (95% CI 29.5% to 33.0%) and Kafue at 88% (95% CI 79.2% to 97.1%), respectively, are found in the predominantly urban province of Lusaka.

Overall technical efficiency across districts.
Only 22 (31.0%) of the districts in the country (predominantly those in the Northern and Lusaka provinces) had efficiency scores above 70%. The next tier of top performers, with an OTE score between 60% and 70%, showed a mixed picture but also had predominant representation from the Copperbelt province and other districts in the northern and eastern parts of the country, which suggests a phenomenon of spatial clustering in performance in the country. The average efficiency score for the country as a whole was 61.5% (95% CI 58.2% to 64.8%), which suggests that there is significant potential for further improvement without the need for additional resources.
Figure 2 shows that there was a strong association between the OTE scores for under-5 survival (outcome) and the OTE scores for health intervention coverage (output). This means that efficient attainment of health intervention coverage is strongly predictive of how efficiently districts in Zambia perform in meeting their child survival objectives. However, although this trend is observed in most districts, there are some that deviate from it, which raises further questions into the role of environmental factors that are beyond the control of the health system.

Provincial efficiency ranking.
The OTE can be further decomposed into PTE, which is a measure of managerial performance in the production process, and SE, which is the ability to choose the optimum size of resources in production. Figure 3 shows the PTE, SE and OTE scores for the nine provinces of Zambia. OTE appears to be higher in the Northern, Lusaka and Eastern provinces. However, the Northern and Lusaka provinces are also in the lead in terms of PTE, whereas the Southern and North-Western provinces are in the bottom tier. Meanwhile, SE appears to be generally high across the country, with the Lusaka province leading with 100%.

A comparison of under-5 survival and health intervention coverage technical efficiency.
The efficiency measures discussed above consider only the use of resources or the scale of operation and do not directly address outcomes. For instance, it is possible for districts or provinces to have lower service coverage but perform better in the management of resources available to them, and vice versa. Figure 4 shows a comparison of PTE and health intervention coverage across the 72 districts of Zambia, with the quadrants defined as the means of each estimate. The PTE scores presented in the figure provide an opportunity for policymakers and local decision makers to examine the effect of managerial competence without the diluting effects of scale of operation on performance.

A comparison of pure technical efficiency and health intervention coverage.
In figure 4, 37 of the 72 districts fall into the high managerial performance category, of which 18 have managed to combine high managerial efficiency with high health intervention coverage. However, in the remaining 19 districts in this category, health intervention coverage is still low despite high efficiency. In contrast, there are 17 districts in which managerial performance and coverage remain low. The average PTE score was 66.3% (95% CI 62.9% to 69.7%), whereas the actual scores ranged between 31.3% (95% CI 31.0% to 32.9%) and 89.5% (95% CI 83.7% to 96.8%).
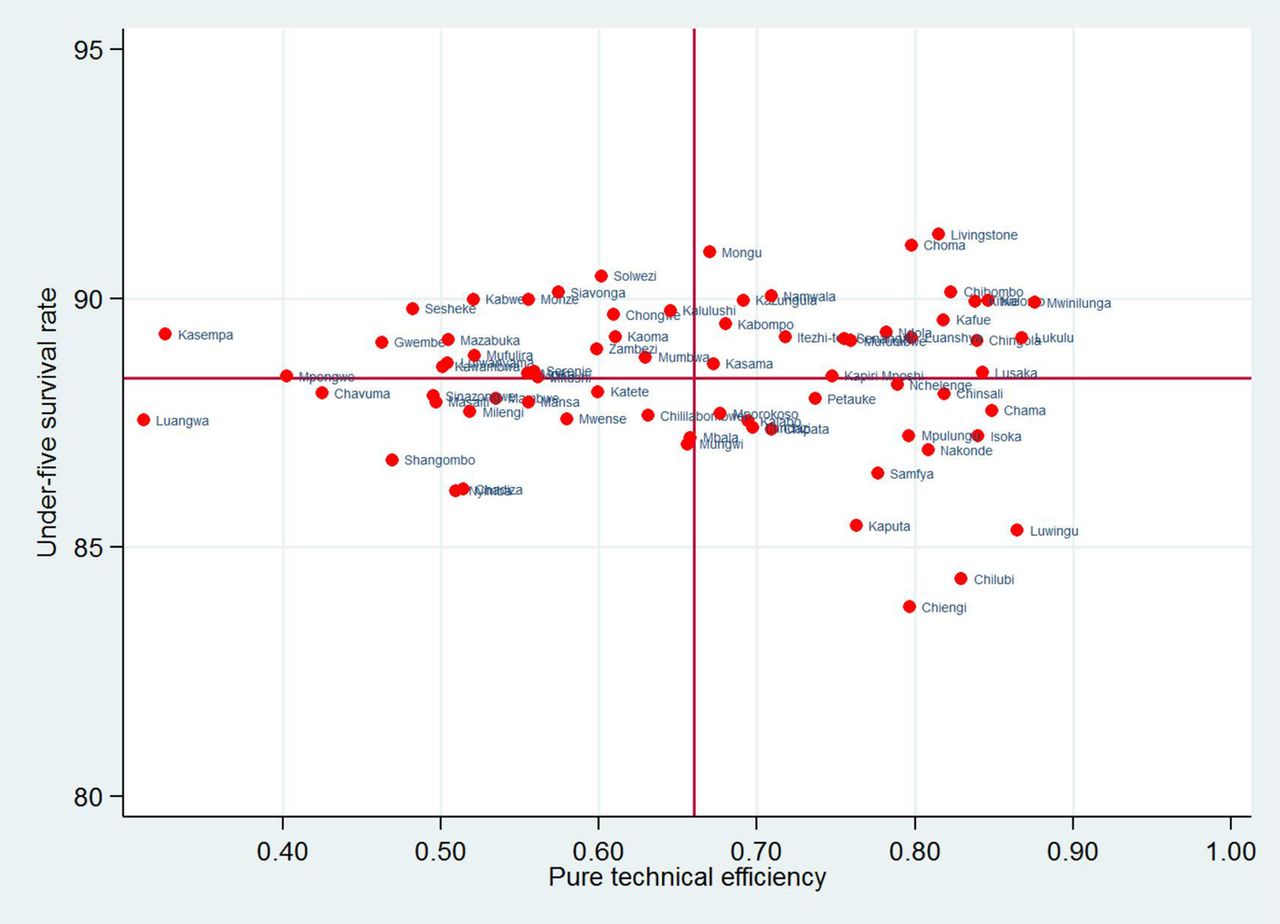
Further, figure 5 shows a comparison between under-5 survival rates across districts and PTE. It is clear that high performance in terms of PTE in a given district does not necessarily translate to better health outcomes. This is observed in districts such as Chiengi and Chilubi, which score high in terms of PTE but trail their peers in under-5 survival rate.
A comparison of pure technical efficiency and under-5 survival.
Effects of environmental factors on overall technical efficiency
Table 3 presents results of a regression analysis to estimate the effect of environmental factors on the OTE for under-5 survival rate at the district level. The results were obtained using the bias-corrected, two-stage estimation process for the four environmental variables we chose for our analysis. The results suggest that the channelling of donor funding in Zambia seems to have an insignificant effect on technical efficiency. Meanwhile, female education had a significant positive effect, confirming the interdependencies between health and education noted in previous studies.
The effects of the environmental variables
Discussion
With the push for universal coverage across the developing world and the existence of uncertainties regarding future global investments in health, the question of efficiency in health service delivery has become increasingly important. This paper attempted to evaluate the extent of pure technical, scale and overall technical efficiencies in Zambia using cross-sectional data from 72 districts. In addition, an attempt has been made to investigate the role of environmental factors, specifically donor funds and maternal education, on the efficiency of maternal and child health in the country. This effort is particularly relevant given the finite nature of available health resources in the face of rising health needs.1 ,2 ,4 ,8
DEA is an attention-directing managerial technique.15–22 ,26 By evaluating the relative efficiency of subnational units, it locates trouble spots in the service delivery system and identifies potential areas for further improvement. This is based on the understanding that in a decentralised health system, subnational units have a far-reaching impact on the overall performance of the health system.4 ,7 ,9 Through this framework, policymakers can objectively benchmark the performance of the district health system with the aim of fostering peer learning and accountability.
DEA has been extensively used to assess the performance of health systems across different settings. For instance, Ortega et al11 used DEA to analyse the impact of income inequality and government effectiveness on the efficiency of health inputs to improve child survival in developing countries. Kirigia et al27 applied DEA to measure technical and SE across 55 public hospitals in South Africa. Kirigia et al28 also used the DEA methodology to measure the relative efficiency of 54 hospitals in Kenya. In Ghana, Alhassan et al14 applied DEA to estimate the technical efficiency of private and public health facilities accredited by the National Health Insurance Authority. In addition, Masiye29 has used DEA to measure the technical and SE of hospitals in Zambia.
Building on existing evidence regarding the application of DEA in Zambia, the findings from the present study reveal significant heterogeneity in performance across the country. It is clear that OTE in the production of health outcomes is strongly correlated with efficiency in the production of health outputs, given the same inputs. However, as noted earlier, efficiency estimates refer to the efficiency of an output (or an outcome) for a given level of input; they do not refer to the level of the output (or outcome) itself. In other words, it is possible for a district or a country to be fully efficient and yet have lower output and/or outcome levels.11 ,12
Low performance in the districts and provinces was due largely to both poor input usage (ie, pure technical inefficiency) rather than to the failure to operate at the most productive scale size (ie, scale inefficiency). The average PTE score for the country was observed to be 66.3%, which implies that 33.7% points of the ∼38.5% overall technical inefficiency in the country is attributed to district health managers who are not following appropriate management practices and who are selecting incorrect input combinations. The remaining shortfall in overall inefficiency appears to be due to the inappropriate scale of operations. This is consistent with the findings of Masiye,29 which established that a significant proportion of hospitals in Zambia were technically inefficient.
Specifically, urban districts seemed to be more scale efficient than their rural counterparts, probably as a result of having a densely populated environment in which the marginal cost of increasing population coverage is significantly lower than in rural areas. Similarly, urban residents tend to have better access to health services, in physical and financial terms, than their rural counterparts, resulting in higher usage of the available services. In contrast, due to access challenges in rural areas, there is often low usage of the available health services.
We showed that 37 of the 72 districts fall into the high managerial performance category, of which 18 combine high managerial efficiency with high health intervention coverage. In the remaining 19 of the 37 districts in this category, health intervention coverage is still low, but this had no relation to the efficiency with which managers combined the inputs at their disposal, suggesting that for this group of districts, the only way to improve coverage would be to put additional resources into the system. In contrast, in the remaining 17 districts, where PTE and coverage of services remained low, improvements in health intervention coverage should first and foremost focus on improving managerial underperformance (ie, managerial inefficiency) in organising the inputs at their disposal, followed by introducing new resources, especially in areas where coverage rates are extremely low. A similar interpretation applies when considering health outcomes in districts such as Chiengi and Chilubi, in which the efficiency level is already high but outcome levels remain low; further progress in child survival can only be realised by investing new resources in these areas.
We further demonstrated that the relationship between health system inputs, outputs and outcomes is complex.11 Although there is a strong association between the efficiency measures in the production of health outputs and health outcomes, there are some deviations that need further investigation. Health systems are mainly responsible for organising the available resources to maximise health outputs with the hope that these outputs will translate into better health outcomes. However, the environmental factors in the district within which a health system operates also play a significant role in determining outcomes.
Therefore, in health programming, it is equally important to not ignore the social determinants of health, particularly the educational status of women, which is shown to have a positive impact on the efficiency of the healthcare system. Educated women are likely to be aware of and demand appropriate health services when they need them. In fact, the variables that have been included in the composite metric—skilled birth attendance, childhood immunisations and malaria prevention—are all considered crucial for maternal and child health in most of Africa.4 Therefore, it is only natural that educated women would have a greater awareness of and ability to seek and use these important health services when they are available than less educated women. The cumulative effect at the district level would also translate to higher usage and therefore efficient service provision in districts where women are more educated. This would ultimately translate to better survival in areas where caregivers are better educated.
While donor funding has been a dominant feature of the African health systems landscape in recent years and has contributed significantly to the scaling up of priority health interventions, many have raised questions regarding its effectiveness.2 ,30–32 From this analysis, we cast doubt on whether donor funds are being channelled and used optimally at the district level. The reasons that donor funding had no significant effect on efficiency could be explained by various factors. First, districts with limited institutional capacity might lack the implementation capacity to use the available funds to deliver required health services effectively. This would lead to inefficiency within the health system, whereby districts would have large amounts of money without the ability to deliver required services. Second, donor funds are often earmarked for specific programmes such as malaria, HIV/AIDS and tuberculosis.3 In such vertical programming, the donor-funded programmes might reduce other health programs’ implementation capacity, leading to suboptimal performance in other key programme areas such as skilled birth attendance and other preventive services that are relevant to maternal and child healthcare.
Our analysis is not, however, without limitations. First, we have focused on a limited number of health system outputs (ie, maternal and child health indicators), despite the fact that a health system produces many more outputs covering different programmatic areas. Similarly, due to data availability constraints, we have also considered a limited set of health inputs and non-discretionary variables to explain the differences in efficiency across districts. Moreover, in our comparison of relative efficiency across districts, we did not fully account for important structural and organisational factors such as leadership and governance that play a key role as determinants of performance.10 ,30–32 These limitations call for an in-depth assessment that will seek to further explain the observed differences in performance across districts in Zambia.
The DEA approach implemented in the present study is also not without limitations; the major drawback is the sensitivity of the derived estimates to the methods and the presence of outliers in the data. Although these issues cannot be circumvented altogether, we have examined the sensitivity of the derived estimates using internal and external consistency checks on the data. Specifically, we fitted 72 separate DEA models, each of which had one fewer observation—which was achieved by removing one district from our analysis—and then compared the root-mean-square error (RMSE) and pairwise correlations of the efficiency scores across these models. We have also re-estimated the technical efficiency scores using a parametric approach following the stochastic frontier model and have compared the outcome with our original DEA-based model. These results (not shown here) confirmed that our efficiency estimates are unlikely to have been biased by outliers, as the RMSE for the different models is <2% in most cases, and the pairwise correlation coefficients estimated using the alternative models showed a strong significant correlation.
Conclusion
The WHO underscores that efficiency in health service delivery is a key attribute of a performance-oriented health system.2 ,10 ,29 ,30 Therefore, with many health systems facing resource constraints, decision makers must strive to understand the factors that drive health system performance and seek ways to improve efficiency. Paying attention to factors such as stewardship, resource allocation and management is particularly useful if meaningful progress towards universal health coverage is to be realised in low-income and middle-income countries.
Acknowledgments
We are grateful to all the researchers at IHME, University of Washington, particularly Professor Joseph Dieleman, Professor Abraham Flaxman and Professor Emmanuela Gakidou who provided useful advice, suggestions and comments that have been incorporated in this manuscript.
References
Footnotes
Twitter Follow Tom Achoki @tachoki
Contributors TA conceptualised the study and extracted all the relevant data. TA and YK developed the model, carried out the analyses and drafted the report. FM, AL, HL and AH critically read the draft and provided comments for the preparation of the final manuscript. All the authors read and approved the final manuscript.
Competing interests None declared.
Provenance and peer review Not commissioned; externally peer reviewed.
Data sharing statement The main data sets supporting the conclusions of this article are available on request and with written permission from the Ministry of Health of the Government of the Republic of Zambia.