Article Text

Abstract
Objectives We examined the utility of January 2004 to April 2014 Google Trends data from information searches for cancer screenings and preparations as a complement to population screening data, which are traditionally estimated through costly population-level surveys.
Setting State-level data across the USA.
Participants Persons who searched for terms related to cancer screening using Google, and persons who participated in the Behavioral Risk Factor Surveillance System (BRFSS).
Primary and secondary outcome measures (1) State-level Google Trends data, providing relative search volume (RSV) data scaled to the highest search proportion per week (RSV100) for search terms over time since 2004 and across different geographical locations. (2) RSV of new screening tests, free/low-cost screening for breast and colorectal cancer, and new preparations for colonoscopy (Prepopik). (3) State-level breast, cervical, colorectal and prostate cancer screening rates.
Results Correlations between Google Trends and BRFSS data ranged from 0.55 for ever having had a colonoscopy to 0.14 for having a Pap smear within the past 3 years. Free/low-cost mammography and colonoscopy showed higher RSV during their respective cancer awareness months. RSV for Miralax remained stable, while interest in Prepopik increased over time. RSV for lung cancer screening, virtual colonoscopy and three-dimensional mammography was low.
Conclusions Google Trends data provides enormous scientific possibilities, but are not a suitable substitute for, but may complement, traditional data collection and analysis about cancer screening and related interests.
- EPIDEMIOLOGY
- PUBLIC HEALTH
This is an Open Access article distributed in accordance with the Creative Commons Attribution Non Commercial (CC BY-NC 4.0) license, which permits others to distribute, remix, adapt, build upon this work non-commercially, and license their derivative works on different terms, provided the original work is properly cited and the use is non-commercial. See: http://creativecommons.org/licenses/by-nc/4.0/
Statistics from Altmetric.com
Strengths and limitations of this study
Google Trends data help identify developing interests in new cancer screening tests or related aspects of specific screening tests.
Internet searches can be an important source for generating hypotheses about public awareness and interest in cancer screening, evaluating changes in information seeking after targeted interventions or media coverage, and directing new communication campaigns to explain the evidence base for screening tests.
An evaluation that occurs almost immediately after an intervention may inform policymakers of the associated costs and benefits when there is still interest to make modifications to, or expand, any policy changes.
The utility of Google Trends to help evaluate interventions depends on the area where the intervention is implemented, since data is only available for states and selected metropolitan areas, limiting its use in rural areas or areas with a low search volume.
Google Trends data are anonymous, which limits its utility in examining specific subpopulations and disparities among populations. Also, Google Trends data represent only searches done using Google.
Introduction
Cancer screening is a cornerstone of public health aimed at promoting early diagnosis and, in some instances, prevention of cancer. There are several surveillance systems that monitor self-reported cancer screening utilisation, including the Behavioral Risk Factor Surveillance System (BRFSS),1 ,2 the National Health Interview Survey (NHIS),3 and the Health Information National Trends Survey (HINTS).4 These databases have been invaluable in identifying determinants of screening use and describing trends and disparities over time.
These traditional surveillance systems are ill equipped to deal with a rapidly changing digital world with a need for timely health data for public health and medical professionals, policymakers, and the public who influence policy choices. Traditional surveillance approaches are expensive to maintain due to their use of survey interview methods for data collection and the time required to aggregate the data. In addition, these older methods require participation of a large study population to estimate screening use accurately, they rely on self-report resulting in potential recall bias; and, for the BRFSS and HINTS, participants include only persons with landline telephones and, recently, mobile phones and a mailing address to complete a self-administered questionnaire, leaving the door open for potential selection bias. Other limitations of traditional surveillance approaches include the failure to capture new and emerging screening modalities (eg, virtual colonoscopy for colorectal cancer, MRI for breast cancer detection, or low-dose spiral CT for lung cancer screening among persons at high risk for lung cancer) especially when use is still low. As a result, population-based prevalence of newer screening methods is unknown.
Recent technological advances in data acquisition, such as Google Trends, may allow for more timely data collection to learn about trends in interest in various health-related topics, including cancer screening. Google Trends is a keyword research tool that provides near real-time trend data regarding interest as operationalised by internet search volume. Both Google and Yahoo! search engines have been used to analyse different types of search queries, for example about cancer incidence,5 cancer mortality,5 kidney stones,6 non-cigarette tobacco use,7 sexually transmitted infections,8 and flu trends.9 ,10 However, the value of Google Trends in illuminating search trends reflecting interest in cancer screening and related topics has not yet been examined. Depending on its utility, Google Trends may complement existing surveillance systems that monitor screening use.
Here, we examined the utility of Google Trends relative to the BRFSS, focusing on cancer screening. Specifically, we examined (1) the correlation between 2012 Google Trends and self-reported breast, cervical, colorectal and prostate cancer screening in the 2012 BRFSS and (2) interest in possible new and developing screening modalities and preparations not currently captured in existing surveillance systems since 2004.
Methods
Data sources about screening use
Prevalence data about breast cancer screening (mammography and breast self-examination), cervical cancer screening (Pap smear), colorectal cancer screening (faecal occult blood test (FOBT), colonoscopy), and prostate cancer screening using prostate screening antigen (PSA) test were all obtained from the 2012 BRFSS database http://apps.nccd.cdc.gov/brfss/.11 The BRFSS is one of the largest annual telephone health survey database systems in the world. The survey provides state-level prevalence data of the major behavioural risks among adults associated with premature morbidity and mortality among adults. Data are collected from all 50 US states, the District of Columbia, Puerto Rico, the US Virgin Islands, Guam, American Samoa, and Palau. Questions about cancer screening use have been validated.12 In this study, we included BRFSS data from all 50 US states to calculate correlations between reported screening use and Google Trends search volume. Use of mammography in the past 2 years was calculated among women aged 40 years or older. Use of Pap smear among women aged 18 years or older was estimated within the past 3 years. FOBT use in the past 2 years was calculated among men and women aged 50 years or older. Use of colonoscopy was defined as having ever had a colonoscopy among men and women aged 50 years or older. PSA testing prevalence was defined as a PSA test within the past 2 years among men aged 40 years or older.
Google Trends (http://www.google.com/trends/explore#cmpt=q), based on Google Search, the most widely used internet search engine, offers search volume data for search terms over time since 2004 and across different geographical locations. Google Trends shows how often search terms are entered in Google relative to the total search volume in a region or globally. Google Trends produces relative search volume (RSV) scaled to the highest search proportion week. RSV values are, by definition, always less than 100, and demonstrate how other weekly search proportions compared with the highest (RSV=100) search proportion. For example, RSV=50 represents 50% of the highest observed search proportion during the study period. RSV indirectly corrects for population size and internet access, both of which increased during the study period and would bias any absolute search volume measure. However, RSV allows for directly comparing search volume across search terms.
Google Trends can compile search volume for up to 30 words. We selected search terms a priori based on their face validity for the term's relationship to the screening test of interest. Google Trends allows up to four strata for different trend data. We included additional search terms in our main search if these additional strata increased RSV by at least one point. We also added search terms based on popular ‘related terms’ suggested by Google Trends. We included singular and plural forms of the search terms. Online supplementary appendix 1 shows the specific search terms used for each screening test, and associated terms relevant to specific tests (eg, Miralax for colonoscopy). In addition to obtaining search volume data about interest in existing screening tests, we examined search volume data regarding new screening tests (virtual colonoscopy, lung cancer screening using CT, three-dimensional (3D) mammography), free/low-cost screening for breast and colorectal cancer, and new preparations to cleanse the colon for colonoscopy (Prepopik). Prepopik was approved on 16 July 2012 by the Food and Drug Administration to help cleanse the colon in adults preparing for colonoscopy.13
Statistical analysis
We used the Pearson correlation coefficient to examine the associations between state-level Google Trends RSV and BRFSS state-level screening prevalence for each of the five cancer screening tests. We weighted these correlations by the 2011 state population estimates from the Bureau of the Census using weighted regression, because such estimates provide more weight to states with larger populations. We used Stata V.13.1 to calculate weighted correlations using the wls0 command.
We used the joinpoint methodology to identify significant changes in weekly RSV over time for each of the screening tests and associated interests.14 ,15 The joinpoint methodology is ideally suited to examine trends over time and to test whether an apparent change in trend is statistically significant, which other methods (eg, autoregressive integrated moving average analysis) may miss. Linear trends in search volume were summarised using the estimated annual percentage change (EAPC). The EAPC was calculated by fitting a linear regression to the natural logarithm of the weekly RSV, using week as a regression variable. Joinpoint regression tests were used to identify an inflection point (hereafter, called joinpoint) with a significant change in the slope of the trend.14 ,15 For our analysis, a minimum of 4 weeks between two joinpoints were required, and a maximum of three joinpoints were allowed for describing the data.
Results
Colorectal cancer screening
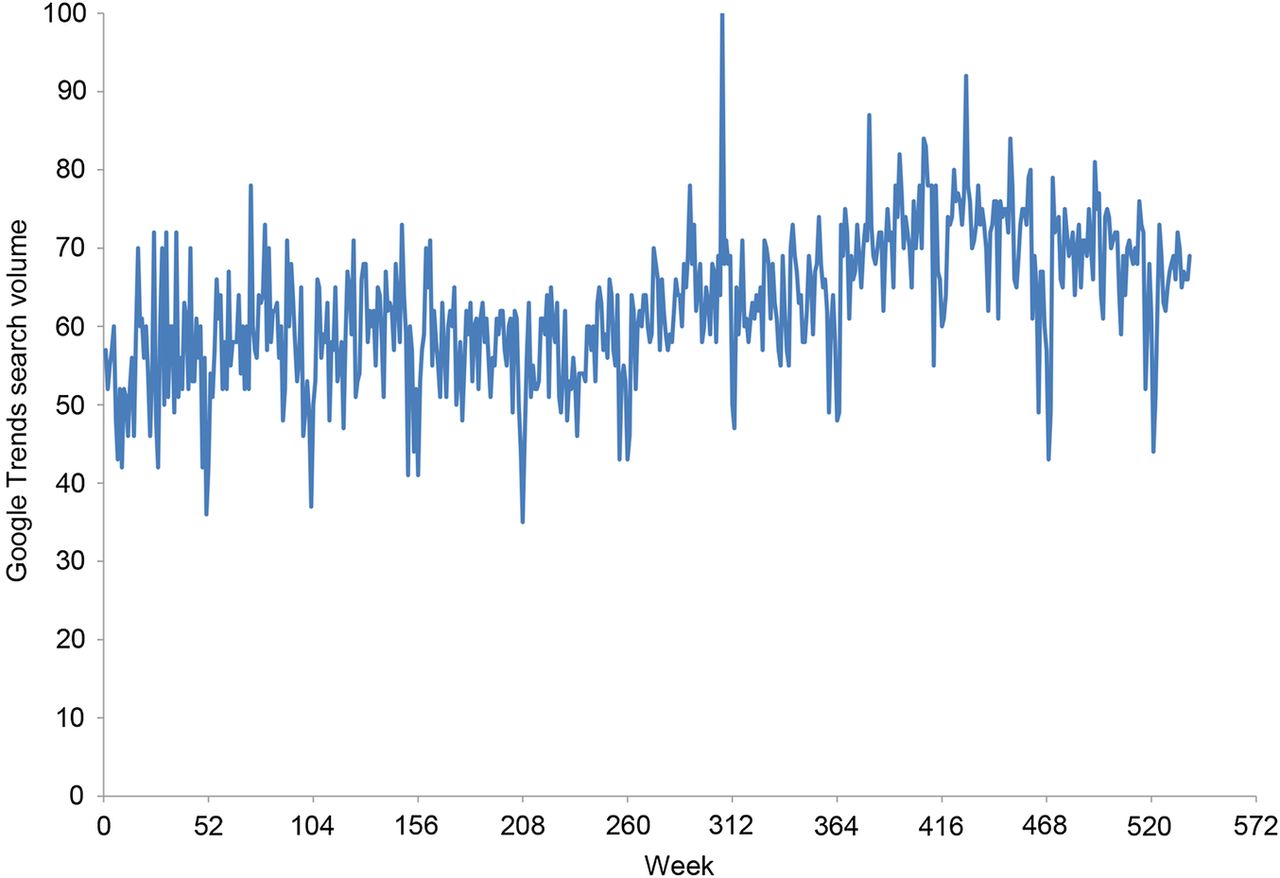
The weighted correlation between ever having had a colonoscopy based on 2012 BRFSS data and 2004–2012 Google Trends colonoscopy data was 0.55. Figure 1A shows the weekly Google Trends RSV for colorectal cancer screening using colonoscopy between January 2004 and April 2014. The average RSV was 61.9 in 2004 and increased to 85.8 during the past 52 weeks of data. During the first 3 years, RSV per week remained stable, but then increased 0.2% per week (95% CI 0.1% to 0.2%). Starting at week 308 (November 2009), RSV increased 0.09% per week (95% CI 0.07% to 0.11%). RSV was lowest during December of each year and slightly higher during March of each year (average: 74.3).

(A) Google Trends relative search volume for colonoscopy by week, January 2004 to April 2014. (B) Google Trends search volume interest about virtual colonoscopy, January 2007 to April 2014. (C) Google Trends relative search volume Miralax to prepare for colonoscopy by week, January 2009 to April 2014.
During 2007, the average RSV per week for virtual colonoscopy was 22.5, but RSV decreased 0.30% per week (−0.33% to −0.27%) starting in January 2008 (figure 1B). RSV per week for Miralax as a colon cleanser declined 0.50% per week (95% CI −0.69% to −0.30%) during January 2009 through August 2010, after which RSV about Miralax remained stable until April 2014 (figure 1C). The RSV per week for Prepopik, a newer colon cleanser approved by the FDA in July 2012, increased rapidly over time.
For FOBT use, Google Trends data was available for only eight states due to low search volume, and a correlation between BRFSS data about FOBT use and Google Trends RSV could not be calculated.
Breast cancer screening
The weighted correlation between Google Trends RSV and BRFSS-based mammography use was 0.36. Figure 2A shows RSV per week for mammography over time. Peaks were present during October each year and about 10 points higher than during December, the month with the lowest RSV. In November 2009, mammography RSV was highest during this 10-year period. Figure 2B shows Google Trends RSV per week for free/low-cost mammography, which peaked in October every year.

(A) Google Trends relative search volume about mammography by week, January 2004 to April 2014. (B) Google Trends relative search volume about free/low-cost mammography by week, January 2004 to April 2014.
Cervical cancer screening
The weighted correlation between 2012 BRFSS-based Pap smear use and RSV for Pap smears during 2010–2012 was 0.14. Figure 3 shows that during weeks 1–137, RSV per week for pap smear increased slightly (0.08% per week; 95% CI 0.03% to 0.13%), remained stable during weeks 137–208, increased during weeks 208–426 (0.13% per week; 95% CI 0.11% to 0.16%), but then decreased starting in week 426 (−0.11% per week; 95% CI −0.18% to −0.04%).
Google Trends relative search volume about Pap smears by week, January 2004 to April 2014.
Prostate cancer screening
The weighted correlation between Google Trends and BRFSS-based PSA use was 0.42. RSV for PSA declined very slowly (0.05% per week) starting in 2004 (95% CI −0.06% to −0.05%) until October 2009 (week 302), after which the decline became steeper at 0.20% per week (95% CI −0.30% to −0.11%) until December 2010 (week 364), then there were 3 weeks during which RSV remained stable (figure 4). Starting in January 2011 (week 367), RSV declined 0.05% per week (95% CI −0.07% to −0.03%). RSV for PSA was highest for week 272 (March, 2009).

Google Trends relative search volume about prostate cancer screening, January 2004 to April 2014.
Lung cancer screening
Between January 2007 and July 2010, RSV about lung cancer screening declined 1.1% per month (95% CI −1.7% to −0.5%), but then increased 2.8% per month (95% CI 2.3% to 3.4%) until April 2014 (figure 5). There was a peak in RSV about lung cancer screening during November 2010 (month 47).

Google Trends relative search volume about lung cancer screening, January 2007 to April 2014.
Discussion
We examined the utility of Google Trends relative to the BRFSS, one of the existing surveillance systems focusing on cancer screening. Correlations between Google Trends and BRFSS data ranged from a high of 0.55 for ever having had a colonoscopy to a low of 0.14 for having a Pap smear within the past 3 years. Although self-reported screening use is a less than perfect measure of behaviour,12 these modest correlations between data sources indicate that they are measuring different constructs: Google Trends provides estimates of the public's interest in learning more about cancer screening tests; the BRFSS and other surveillance systems provide estimates of self-reported use of these tests. However, correlations between the two data sources varied across screening types. One reason for the lower correlation related to cervical cancer screening may be that Pap smear use is very common, and is often part of routine primary care visits, resulting in lower information seeking.16
On the basis of our findings, there appears to be some utility of Google Trends data relative to existing surveillance systems to monitor cancer screening. Awareness and interest in cancer screening is a necessary, but insufficient, determinant of screening behaviour.17 ,18 Search volume data using Google Trends enabled us to measure the public's awareness and interest in possible new and developing screening modalities (eg, virtual colonoscopy, digital mammography, 3D mammography, CT for lung cancer screening) and screening test preparations (eg, Prepopik vs Miralax), which are not currently captured in existing surveillance systems. By harnessing real-time search-engine data around national media-based interventions (eg, CDC's (Centers for Disease Control) Tips from Former Smokers), programmes can be evaluated as they are implemented, generating timely feedback to assess the effectiveness of interventions to increase interest in cancer screening, prevention and other public health recommendations. Such adaptive designs using accumulating data to modify the intervention's course 19 ,20 have been used infrequently in community-based evaluations. Adaptive interventions that can be evaluated using interest and awareness may be especially useful. It appears that in some instances an increase in public interest in cancer screening is associated with the timing of news reports, celebrity cancer diagnosis, and advertisements.21 For example, the increase in search volume each October coincides with news stories and advertisements during Breast Cancer Awareness Month. Search volume for colon cancer screening was also slightly higher during March, Colon Cancer Awareness Month. Google Trends also identified a large interest in November 2009 when search volume about mammography increased dramatically likely in response to critics citing healthcare rationing in response to new mammography guidelines from the US Preventive Services Task Force.22 The panel recommended that most women wait until the age of 50 years to start routine mammography, then get the examination every 2 years instead of annually. For example, in March 2009, RSV for prostate cancer screening increased following coverage of two studies showing that prostate cancer screening did not reduce the risk of death.23 Also, in November 2010, RSV for lung cancer screening increased after trials reported its potential to reduce the risk of death among heavy smokers.24 The utility of Google Trends to help adapt interventions is limited by the area where the intervention is implemented, since data is only available at the state-level and for selected large metropolitan areas, limiting its use in rural areas or areas with a low search volume. Consequently, disparities in cancer screening are difficult to examine using these data. Additionally, Google Trends data is unable to evaluate interventions using outcomes such as behaviours or disease development.
Internet searches using Google Trends can guide the development of traditional surveillance systems surveys, such as the BRFSS, NHIS and HINTS, by vetting the inclusion of questions on surveys. Google Trends data can also gauge developing awareness and interests in new cancer screening tests (eg, virtual colonoscopy) or related aspects of specific screening tests (eg, about preparation for colonoscopy). For example, Google Trends showed that interest in lung cancer screening and virtual colonoscopy is still very low, while interest in prostate cancer screening is very high even though PSA tests have been shown to be not very effective in reducing risk of death.25 Interest in virtual colonoscopy, despite showing promise as a screening tool relative to traditional colonoscopy,26 was very low. For the most part, screening colonoscopy remains the first-line strategy for the detection of adenomas, with a lower miss rate than virtual colonoscopy, no radiation exposure, and offers therapeutic removal of polyps as well.27 Internet searches can be an important source of information for generating hypotheses about public awareness and interest in cancer screening, evaluating changes in information seeking after targeted interventions or media coverage, and directing new communication campaigns to explain the evidence base for screening tests.
Search query results may also be politically relevant. Since policy changes often require public support, evaluation strategies that take years to perform may not provide relevant feedback to public interest groups and voters. Instead, an evaluation that occurs almost immediately after the policy change may inform policymakers and their supporters of the associated costs and benefits when there is still interest to make modifications to, or expand, the policy change.28 For example, the interest in and implementation of free/low-cost breast and colorectal cancer screening can be evaluated. The CDC and local organisations implemented free/low-cost mammograms starting in the 1990s across the USA followed by free/low-cost colonoscopies in selected locations to eligible participants. The potential need for, and likely early success (eg, awareness) of the expansion of these interventions could be gleaned through Google Trends data, much earlier than traditional evaluation strategies.
The utility of Google Trends data should be viewed in light of its limitations. Google Trends data are anonymous, which limits its utility in examining specific subpopulations and disparities among populations. Also, Google Trends data represent only searches done using Google. However, Google accounts for an estimated 65% of all internet searches.29 Google Trends data may have sampling biases. However, such biases are increasingly eroding at the population level, as more and more people search for information online. Google Trends does eliminate repeated queries from the same user over a short period of time to reduce counts of continued searching. Google Trends uses a certain threshold of traffic volume, so that very new search terms are assigned a value of zero, but this could change very quickly. The motivation of Google users is not known. As a corollary, the data obtained from Google Trends cannot be independently verified. Also, the researcher has no control over the data, making quality control difficult. Understanding local health information-seeking behaviours also may be important, but Google Trends data may not be available for geographic areas smaller than at the state level depending on search volume. Additionally, a user option to download Google Trends data for different time periods (eg, by month or season) is not currently available. Finally, it may be misleading to compare levels of interest in different screening methods based on the way RSV values are constructed. One remedy that would circumvent many of these limitations is the release of actual search volume data rather than RSV data. Finally, search terms entered in other languages were not captured by this study, but could be used to examine interest among non-English speaking populations.
Although Google Trends’ ‘big data’ approach provides enormous scientific possibilities, they are not a substitute for, but may complement, traditional data collection and analysis of cancer preventive behaviour. The strengths of Google Trends to provide data about the public's interests in cancer screening, despite its inability to provide cancer screening usage data, can foster provision of timely feedback about interventions aimed at increasing interest in cancer screening and other public health recommendations.
Acknowledgments
The authors thank the Alvin J Siteman Cancer Center at Barnes-Jewish Hospital and Washington University School of Medicine in St Louis, Missouri, for the use of the Health Behavior, Communication, and Outreach Core, which is supported, in part, by the National Cancer Institute Cancer Center Support Grant (grant number P30 CA91842) to the Alvin J Siteman Cancer Center. Dr Davidson was supported, in part, through grants HL38180, DK56260, and Digestive Disease Research Core Center DK52574.
References
Supplementary materials
Supplementary Data
This web only file has been produced by the BMJ Publishing Group from an electronic file supplied by the author(s) and has not been edited for content.
- Data supplement 1 - Online supplement
Footnotes
Twitter Follow Aroona Toor at @aroona and Mario Schootman at @MarioSchootman
Contributors MS and AT designed and conceptualised the study, with MS overseeing data collection. MS performed the statistical analysis pertaining to the trends over time. MS and AT wrote sections of the manuscript. AT helped to conceptualise the study, performed some of the data analysis, and edited the manuscript. PC-R, DBJ, AM, JE and NOD helped to conceptualise the study, interpreted the results, and edited the manuscript. AM and JE provided insight into the use of behavioural theories that could help explain the findings. NOD provided clinical insight into screening issues pertaining to colorectal cancer.
Funding This work was supported by grants from the National Cancer Institute at the National Institutes of Health (grant number R01 CA112159).
Competing interests None declared.
Provenance and peer review Not commissioned; externally peer reviewed.
Data sharing statement No additional data are available.