Article Text

Abstract
Objective To investigate the influence of antimicrobials on both the gut microbiota structure and the plasma ghrelin level using Helicobacter pylori-infected patients who underwent eradication therapy.
Design Twenty H. pylori-infected patients (mean age 68.3 years old) who underwent eradication therapy participated in the study. For the therapy, patients had 1 week of triple therapy consisting of amoxicillin, clarithromycin and proton-pump inhibitors. Stool and blood samples were obtained before (S1), immediately after (S2) and/or 3 months after (S3) the therapies. The concentrations of ghrelin and leptin in the blood were assayed using an ELISA. The V3-V4 region of the 16S rRNA gene was amplified using bacterial DNA from the stool, and about 50 000 high-quality amplicons per sample were grouped into operational taxonomic units for bacteriological analyses.
Results The Bacteroidetes:Firmicutes (B:F) ratio was significantly greater at S3 than S1 (P<0.01). This increase in the B:F ratio between S3 and S1 was found in 15 out of 20 patients. A significant decrease in the concentration of active ghrelin (P=0.003) in the plasma was observed between S3 and S1. There was a statistically significant correlation between the rate of patients whose B:F ratio increased and that of patients whose active ghrelin level decreased between S3 and S1 according to Fisher’s exact probability test (P=0.03).
Conclusions Changes in the gut microbiota, such as the B:F ratio after treatment with antimicrobials, might cause a change in the plasma ghrelin level, as the direct and earliest target of antimicrobials would be the microbiota rather than the hormone-secreting system.
- antibiotic therapy
- helicobacter pylori
- intestinal microbiology
- obesity
This is an Open Access article distributed in accordance with the Creative Commons Attribution Non Commercial (CC BY-NC 4.0) license, which permits others to distribute, remix, adapt, build upon this work non-commercially, and license their derivative works on different terms, provided the original work is properly cited and the use is non-commercial. See: http://creativecommons.org/licenses/by-nc/4.0/
Statistics from Altmetric.com
Summary box
What is already known about this subject?
Gut microbiota plays a fundamental role in the pathophysiology of obesity.
Ghrelin is associated with obesity after the eradication of Helicobacter pylori.
What are the new findings?
Alteration in the gut microbiota may affect the plasma ghrelin level.
How might it impact on clinical practice in the foreseeable future?
Both the gut microbiota profiling and plasma ghrelin level might be used as an earliest biomarker to foresee the insulin resistance or obesity.
Introduction
Although antimicrobials have definite effects on particular pathogenic bacteria, the effect of antimicrobials on the gut microbial community and metabolism has recently been explored. Many of those studies performed so far are characterised by significant heterogeneity with respect to type of antimicrobials tested, route of administration, duration of follow-up and so on. However, in the eradication therapy of Helicobacter pylori, the first-line therapy has been widely used, which consists of oral administration of clarithromycin, amoxicillin and a proton-pump inhibitor twice a day for 7 days.1 Therefore, it will be free from the problem of heterogeneity to use H. pylori-infected patients with eradication therapy as subjects in the study of the effect of antimicrobials on indigenous bacteria in human.
It was reported that the body weight and body mass index significantly increased 1 year after the eradication of H. pylori when examined in 579 Japanese patients.2 Ghrelin is a multifunctional hormone that facilitates fat storage and regulates body weight.3 As ghrelin is predominantly synthesised and secreted by the gastric mucosa, the obesity associated with eradication of H. pylori has been attributed to an increase in the ghrelin level.4 However, some groups5 6 have found that the plasma ghrelin concentration decreased in most patients 12 weeks after successful H. pylori eradication therapy. A recent systemic review also reported that the relationship between circulating ghrelin and eradication of H. pylori is more complex.7
Recent studies have also suggested that the gut microbiota play a fundamental role in the pathophysiology of obesity.8 Ley et al 9 reported that the ratio of the phylum Bacteroidetes to the phylum Firmicutes (B:F ratio) in the faeces increased when weight was reduced either by a fat-restricted or carbohydrate-restricted diet in humans, suggesting a critical role of the gut microbiota in the obesity.
Therefore, in the present study, we investigated the influence of antimicrobials on both the gut microbiota structure and the plasma ghrelin level, as we hypothesised that the change in the ghrelin level after H. pylori eradication therapy was caused by elimination of H. pylori in the stomach but also by an alteration in the gut microbiota due to antimicrobials.
Methods
Patients
Patients were defined as positive for H. pylori infection if positive results were obtained on a 13C-urea breath test, H. pylori stool antigen test or culturing of biopsy specimens. The exclusion criteria were the patients with gastric cancers and a history of gastrointestinal or hepatobiliary surgery. The demographic data and clinical characteristics of the subjects are summarised in table 1. For eradication therapy, patients had 1 week of triple therapy consisting of lansoprazole (30 mg twice a day), amoxicillin (750 mg twice daily) and clarithromycin (200 mg twice daily). The eradication of H. pylori was confirmed by a urea breath test 3 months after the termination of eradication therapy. Written informed consent was obtained from all of the patients.
Demographic and clinical data of the patients
Hormone assay
The concentrations of des-acyl ghrelin and active ghrelin in the plasma were assayed using a Desacyl-Ghrelin ELISA Kit (SCETI, Tokyo, Japan) and Active Ghrelin ELISA Kit (SCETI), respectively. The specific antibodies used in the former and latter assay kits recognise the C-terminal portion and the octanoyl-modified Ser 3 residue of ghrelin, respectively.10 The concentration of leptin in the serum was assayed using Human Leptin RIA Kit (Millipore, Belmopan, Belize).
Stool sample collection and DNA extraction
Stool sample collection from patients was done three times before (S1), immediately after (S2) and 3 months after eradication therapy (S3). On the day of sample collection, the patients were instructed to take a fresh stool in a test tube. Those samples were immediately sealed in a plastic bag containing a disposable oxygen-absorbing and carbon dioxide-generating agent, and then transported to the laboratory within several hours on ice. To count the number of anaerobic bacteria using the culturing method, fresh stool was spread over glucose blood liver (BL) agar plates containing 5% horse serum, and then incubated at 37ºC for 72 hours in 10% H2, 10% CO2 and 80% N2. The other samples were stored at –80ºC until the 16S rDNA assay. For the extraction of DNA, faecal solids in the suspension were broken down using a FastPrep 24 Instrument (MP Biomedicals, Santa Ana, California, USA) with zirconia beads at 5 m/s for 2 min. Bacterial DNA extraction from the suspension was performed using a Magtration System 12GC (Precision System Science, Tokyo, Japan).
PCR amplification of the 16S rRNA gene and next-generation sequencing
The hypervariable V3-V4 region of the bacterial 16S rDNA was amplified by PCR with 341F11 and R80612 primers. PCR was performed in accordance with the method reported by Takahashi et al.13 Sequencing was conducted using a paired end and modified to 2×300 bp cycle run on an Illumina Miseq sequencing system (Illumina, San Diego, California, USA) with MiSeq Reagent Kit version 3 chemistry.
A 16S rDNA-based operational taxonomic unit (OTU) analysis
The paired-end reads for each sample were joined using the Fastiq-Join and then processed with quality filtering.14 The number of quality filter passed reads were 984 296, 1 187 681 and 1 022 232 in the samples at S1, S2, and S3, respectively. Those high-quality reads were then sorted and grouped into OTUs using the Quantitative Insights Into Microbial Ecology pipeline15 with default settings. The reads were next clustered into OTUs at 97% pairwise identity. To analyse the bacterial composition, TechnoSuruga Lab Microbial Identification Database DB-BA 10.0 (TechnoSuruga Laboratory, Shizuoka-City, Japan) were used in accordance with the method reported by Hisada et al.16 In this composition analysis, we focused on the genera representing >0.1% of the total microbiota, which was approximately >85% in this study. Hierarchical clustering based on the unweighted pair group method with arithmetic mean was performed using JMP V.8.0 (SAS Institute, Cary, North Carolina, USA) to analyse the overall bacterial community structure and the similarity in the frequency of identification of each taxon among the samples. The similarity between the bacterial communities was determined using Euclidean distance.
Statistical analyses
The paired t-test or Wilcoxon signed-rank test was used to compare the bacterial abundance and clinical laboratory data between different time points. The difference in the rate between groups was examined by Fisher’s exact probability test. An analysis of similarity was used to test for statistical differences in bacterial community similarities using the vegan package (V.2.3–4) implemented in R (V.3.2.4). All P values were two sided and considered to be significant at P<0.05.
Results
Patients with eradication therapy
A total of 20 patients who had been diagnosed with H. pylori infection and underwent eradication therapy participated in this study from April 2016 to March 2017. The mean age (SD) of them was 63.8 (13.2) years and male/female ratio was 10/10. Three patients whose ID numbers were 8, 16 and 18 were revealed to be in failure for eradication (table 1).
Change in the gut microbiota community structure after eradication therapy
The bacterial diversity within individual stool samples (alpha diversity) was evaluated using both the chao 1 index and the observed OTU number. Rarefaction curves showed no significant difference in the degree of diversity between before (S1) and 3 months after (S3) the eradication therapy (data not shown).
Alteration in the gut microbiota composition after eradication therapy
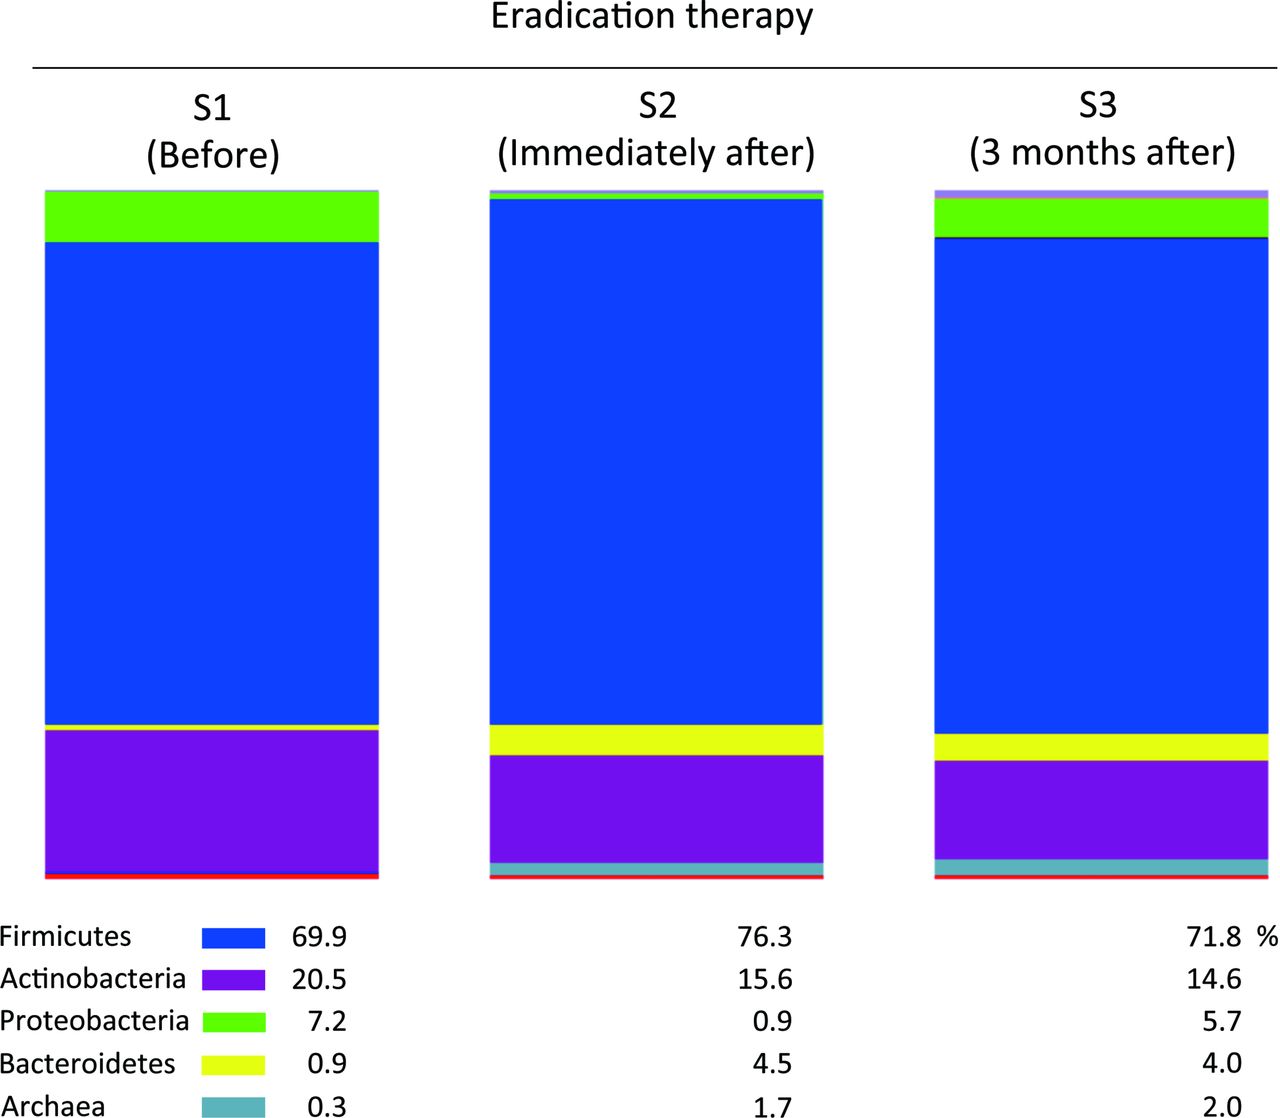
The number of anaerobes by the culturing method was marginally lower at S2 than at S1 but increased to the pretherapy level at S3 (table 2). The OTUs generated from the 16S reads were then classified into phyla according to a similarity search (figure 1). At S2, there was a marked increase in the abundance of both Bacteroidetes ((0.9% to 4.5%)%) and Archaea but a decrease in that of both Actinobacteria ((20.5% to 15.6%)%) and Proteobacteria. The increase in Bacteroidetes and decrease in Actinobacteria persisted even at S3 (0.9% to 4.0% and 20.5% to 14.6%, respectively). The abundance of Firmicutes, the predominant phylum, showed little change between S1 and S3 ((69.9% to 71.8%)%). Thus, the median B:F ratio was significantly greater at S3 than at S1 (P<0.01, table 2). This increase in the B:F ratio was quite obvious, with 15 of the 20 patients (75%) showing a higher ratio at S3 than at S1 (table 1 and figure 2).

Proportion of the dominant five phyla in the faecal samples. The per cent proportions of the five dominant phyla of Firmicutes, Actinobacteria, Proteobacteria, Bacteroidetes and Archaea in all faecal samples at S1, S2 and S3 are depicted in the bar charts. The S1, S2 and S3 samples include 984 296, 1 187 681 and 1 022 232 high-quality reads, respectively.

Difference in the bacterial ratios and hormone levels between S1 and S3. Each symbol represents the logarithmic differential ratio of Bacteroidetes:Firmicutes (B:F) (middle), the concentration of plasma ghrelin (left), and the concentration of serum leptin (right) in a patient at S1 and S3. Symbols representing the same patients are connected with lines. P values at the bottom indicate the statistical significance according to Fisher’s exact probability test.
Effect of eradication therapy on the number/abundance of bacteria
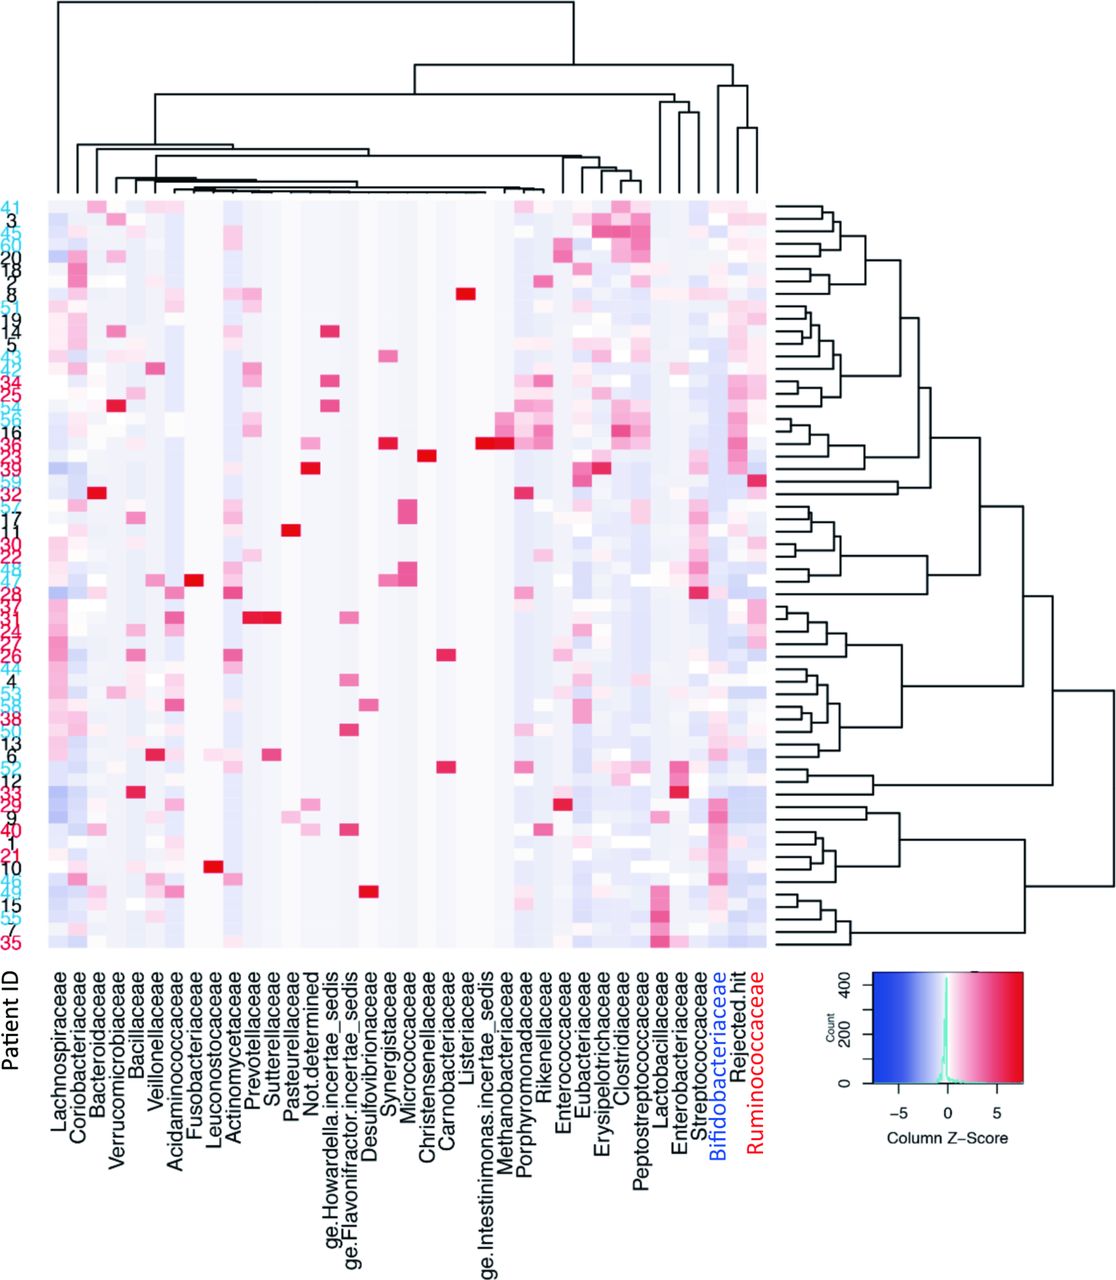
We then examined the abundance of particular bacteria considered to be associated with dysbiosis in obesity (table 2). The abundance of the genus Bifidobacterium, which is included in phylum Actinobacteria, was significantly lower at S3 than at S1 (P<0.01). In contrast, the abundance of Faecalibacterium prausnitzii was greater at S3 than at S1 (P=0.02). A double hierarchical clustering analysis demonstrated an opposite but closely related change in the abundance after therapy between Bifidobacterium and Faecalibacterium (figure 3), with a distinct cluster formed by Bifidobacteriaceae including Bifidobacterium and Ruminococcaceae including Faecalibacterium in the analysis of similarity in the frequency of identification among samples in the clustering of bacterial families.

Double-hierarchical clustering analysis. The faecal samples from 20 patients at three time points for 36 dominant families are represented on a double-hierarchical clustering heat map. The clusters on the right side indicate similarity among the samples at the family level. Sample ID numbers 1–20, 21–40 and 41–60 on the left side represent those obtained at S1, S2 and S3, respectively. IDs 1, 21 and 41, and likewise 2, 22 and 42 and so on correspond to the same patient. The clusters at the bottom indicate the families showing similarity in the frequency of identification among samples. The Z-score column represents the relative ratio of abundance.
Change in the biomarkers regarding obesity/type 2 diabetes mellitus (T2DM) and their association with gut microbiota during the therapy
Among the clinical and laboratory data concerning obesity/T2DM examined in the present study (table 3), statistically significant decreases and increases were observed in the values of active ghrelin (P=0.003) and leptin (P=0.03), respectively, between S3 and S1. We therefore examined whether the change in the levels of those adipogenesis-regulating hormones was associated with the alteration of the ratio of B:F in each patient (figure 2). The rate of decrease in active ghrelin levels among patients with an increased B:F ratio was 14 out of 15, whereas the rate of decrease in active ghrelin levels among patients with a decreased B:F ratio was only 2 out of 5 (table 1). The difference in the rates between these two groups was statistically significant (P=0.03) by Fisher’s test. No significant association was found between the change in the leptin level and the B:F ratio.
Clinical and laboratory data regarding obesity/T2DM
Discussion
In recent studies of gut microbiota using high-throughput 16S rRNA gene sequencing, loss of diversity and marked short-term changes in several bacterial taxa have been a consistent finding after treatment with antimicrobials.17 In the present study using H. pylori-infected patients who were treated with first-line therapy using both amoxicillin and clarithromycin for 1 week, the alpha diversity in the stool samples showed no significant changes at 3 months after the therapy. Given that only a slight transient decrease in the number of bacteria was observed by a culturing method just after the therapy (see table 1), the antimicrobials used in the present study might have exerted only a moderate perturbing effect on the microbiota, thereby resulting in no marked decrease in the diversity of the gut microbiota after the therapy.
Of note, however, in the bacterial composition analysis at the phylum level, the B:F ratio significantly increased just after the therapy and remained increased even at 3 months after the therapy. Yap et al 18 also reported that the alpha diversity was similar between pre-eradication and 6 months posteradication in stool samples obtained from H. pylori-infected young adults treated with amoxicillin (1000 mg twice daily) and clarithromycin (500 mg twice daily), whose dose was pretty greater than that used in the present study. Those authors also observed not an increase but a decrease in the B:F ratio posteradication.
After external perturbation, such as antimicrobial treatment, the ecosystem of gut microbiota exhibits no change, resilience, adaptation or failing resilience.19 The robustness of the microbiota ecosystem is considered to be a major factor determining which of those responses the microbiota exhibit. The difference in the age and race between our subjects (Japanese, 42–79 years of age) and the subjects of Yap et al (Malaysian, 18–30 years of age) might induced in a difference in the robustness of the gut microbiota ecosystem, thereby resulting in different outcomes in the B:F ratio after antimicrobial treatment. In addition, differences in the dose of antimicrobials used for eradication and the duration of follow-up might also have affected the outcomes of these two studies. Furthermore, as the subjects without H. pylori infection were not included in our study, it is possible that some bias due to long-lasting H. pylori infection on the B:F ratio at S1 might be involved.
When analysing the existence of any similarities in the frequency of identification among samples (see figure 3), an opposite pattern of colonisation was found between Bifidobacteriaceae and Ruminococcaceae whose major genera were Bifidobacterium and Faecalibacterium, respectively. That is, a sample with a high density (=columns with red colour) of Bifidobacteriaceae contained a low density (=columns with blue colour) of Ruminococcaceae, and vice versa. This suggests that these two genera may share a common niche in the gut ecosystem. Thus, the administration of both genera together as probiotics may result in competition for nutrition and colonisation sites, despite their being considered beneficial bacteria for improving energy balance.20 21 Indeed, Faecalibacterium is known to be one of the major bacterial groups that produce butyrate in the human gut microbiota.22
In the present study, the gut microbiota after the eradication therapy showed a phenotype not of ‘obesity’ but of ‘lean’, which was represented by an increase in both the B:F ratio9 and an abundance of F. prausnitzii.22 Furthermore, the plasma level of the active form of ghrelin was significantly lower after eradication therapy than before the therapy. A statistical analysis demonstrated a significant correlation between such changes in the B:F ratio and the ghrelin level. The majority of circulating ghrelin is produced in the gastric mucosa and stimulates the appetite, thus increasing the fat mass deposition and body weight.3 10 Therefore, in energy homeostasis, the increase in the B:F ratio in the gut microbiota was comparable with the decrease in the plasma ghrelin level. It has been reported that the plasma ghrelin level is regulated by multiple factors, including food intake, body weight and gastric ghrelin production.23 Because the eradication of H. pylori is known to increase the production of ghrelin in the gastric mucosa,5 it appeared unlikely that the elimination of H. pylori caused the reduction in the plasma ghrelin level. Indeed, such reduction in the plasma ghrelin was observed even in the three patients in the present study who failed H. pylori eradication therapy. Therefore, some event other than the eradication of H. pylori itself may have caused the decrease in the plasma ghrelin level after eradication therapy in the present study, while it still needs further studies using sufficient number of H. pylori-infected subjects to exclude the H. pylori infection as a cause of the plasma ghrelin reduction.
Queipo-Ortuño et al 24 highlighted the association between the gut microbiota and appetite-regulating hormones using rat models with different nutritional conditions and levels of physical activity. In their study, plasma ghrelin level was significantly correlated with the quantity of several kinds of bacteria, including Bifidobacterium and Bacteroides. Also in the present study, both the plasma ghrelin level and the abundance of Bifidobacterium significantly decreased in the patients after eradication therapy. While we still need to clarify the relationship between changes in the B:F ratio and the ghrelin level after the treatment with antimicrobials, changes in the gut microbiota, such as B:F ratio and abundance of both Bifidobacterium and Faecalibacterium, might cause a reduction in the plasma level of ghrelin, as the direct and earliest target of antimicrobials would be the microbiota, not the hormone-secreting system. Moreover, Lin et al 25 reported that butyrate, one of the major short-chain fatty acids formed by gut microbiota such as Faecalibacterium, whose abundance actually enlarged in the present study, reduced the plasma ghrelin level in the murine system. It has been reported that the gut microbiota significantly influence the host energy balance by affecting the energy yield from foods and modulating diet-derived compounds that alter the host metabolic pathway.8 Taken together, we suggested that ghrelin, an appetite-regulating hormone of stomach origin, might be a novel factor by which the gut microbiota affect the energy balance of the host. Furthermore, both the gut microbiota composition and the plasma ghrelin level might be used as an earliest biomarker to foresee the visceral obesity or insulin resistance.
Why such a ‘lean’ phenotype was found in both the gut microbiota composition and plasma ghrelin level at 3 months after the eradication therapy in the present study bears further investigation. A lower plasma ghrelin level at 3 months after the eradication therapy was also reported in Japanese patients in other studies.5 6 In contrast, however, a decrease in the B:F ratio, a phenotype of obesity, was observed at 6 months posteradication, which is 3 months later than the time-point for our assay.18 This suggests that an assay at 3 months after the termination of therapy might be too early to accurately assess the resilience of gut microbiota to reversely fluctuate towards a ‘fat’ phenotype in vulnerable patients, which may have increased the ghrelin level and then the body weight later. As such, the short duration of follow-up after the eradication therapy may be one limitation associated with the present study.
References
Footnotes
Contributors HY, AyT and MM recruited the H. pylori-infected patients undergoing eradication therapy and performed biochemical examinations. ST and GO performed bacteriological, genetical and statistical analyses. YK was involved in the study design and drafting the manuscript. AtT was involved in the study design and data interpretation.
Funding This study was funded by Meiji Co, Ltd (Tokyo, Japan).
Competing interests None declared.
Ethics approval The ethics committee of Tokai University Hospital approved the study (15 R-160).
Provenance and peer review Not commissioned; externally peer reviewed.