

Abstract
Performance errors in conflict tasks often result from inappropriate action impulses, and are thought to signal the need for increased control over the motor system. However, errors may also result from lapses in sustained attention, which may require different monitoring and adaptation mechanisms. Distinguishing between the mechanisms of adaptation is important as both error types may occur intermixed. To this end, we measured EEG of healthy human subjects while they performed three variants of the Simon task in which errors were more likely to occur due to attentional lapses, failures of motor control, or both. Behavioral results showed that subjects exhibited less conflict effects and less impulsive errors in sustained attention compared with the other Simon conditions. Time-frequency analyses of EEG data showed that the sustained attention Simon condition, compared with the motor control Simon condition, was characterized by: (1) less error-related MFC theta (4–8 Hz) power and an absence of error-related MFC–DLPFC theta phase synchronization; (2) stronger error-related suppression of parieto-occipital alpha (8–12 Hz) power and stronger parieto-occipital–frontal alpha synchronization. A control experiment, using SART (the Sustained Attention to Response Test), confirmed that adaptation after attentional lapses involved posterior alpha power suppression, in addition to inter-regional frontal theta activity. Together, these results suggest that at least two cortical mechanisms exist for performance monitoring, and that different tasks and task-settings can recruit these mechanisms in a different way. Post-error brain dynamics thus consist of heterogeneous activity from multiple neurocognitive processes.
Introduction
The medial frontal cortex (MFC), which includes the anterior cingulate cortex (ACC), has long been implicated in performance monitoring (Gehring et al., 1993; Carter et al., 1998; Botvinick et al., 2001; Alexander and Brown, 2011). Among other cognitive control functions, it is thought to detect the occurrence of errors, and to work in concert with the dorsolateral prefrontal cortex (DLPFC) to subsequently enhance top-down control over the motor system to avoid future errors (Gehring and Knight, 2000; MacDonald et al., 2000; Kerns et al., 2004; Ridderinkhof et al., 2004a,b). It has been suggested that oscillatory activity in the theta (4–8 Hz) band may be the electrophysiological mechanism underlying these interactions (Luu and Tucker, 2001; Luu et al., 2004; Trujillo and Allen, 2007), reflected by midfrontal theta power and frontal intersite theta phase synchronization (Cavanagh et al., 2009). These and other recent findings (Hanslmayr et al., 2008, Nigbur et al., 2012) have corroborated the idea that the MFC could better be conceptualized as one important “hub” in a larger network that supports post-error adaptation (Cohen, 2011; Cohen and van Gaal, 2012).
In studying error processing, most of the above studies typically compare two conditions: errors and correct trials. However, qualitatively different kinds of errors may exist that result from and lead to distinct neurocognitive processes (Christ et al., 2000; Steinhauser and Kiesel, 2011; Ham et al., 2012). Importantly, because these different types of errors can be present in one task, but are behaviorally difficult to distinguish, their different patterns of error-related brain activity are averaged together, clouding interpretations of the specific neural mechanisms underlying error monitoring and adaptation.
In long tasks with repetitive trials in a non-arousing environment, the participant's level of sustained attention fluctuates over time (Smallwood and Schooler, 2006; Cohen and Maunsell, 2011): Subjects have attentional lapses that are manifest in increased response time variability (Weissman et al., 2006) and errors (O'Connell et al., 2009a,b). Fluctuations in sustained attention have been linked to alpha (8–12 Hz) activity over posterior parietal-occipital areas (Dockree et al., 2007; Sadaghiani et al., 2010; Macdonald et al., 2011). For example, increased pre-stimulus alpha power (O'Connell et al., 2009a,b) and post-response alpha suppression (Mazaheri et al., 2009) have been associated with errors in the Sustained Attention to Response Test (SART).
Given the above findings of midfrontal theta dynamics related to error monitoring in cognitive control and posterior alpha dynamics related to sustained attention variability, the goal of this study was to better characterize different error-related neural mechanisms within the same and across different tasks. First, we showed that subtle manipulations of the Simon task [used to study response conflict (Leuthold, 2011)] resulted in varying degrees of theta and alpha oscillatory activity after errors. Second, we showed that errors in the SART [used to study attention lapses (Robertson et al., 1997)] resulted in comparable theta but stronger alpha error-related dynamics. Together, these findings demonstrate that errors may recruit, in varying degrees, different co-occurring neurocognitive processes.
Materials and Methods
To elucidate theta and alpha oscillatory activity in relation to different types of performance errors, we conducted two experiments: Experiment 1 consisted of three different conditions of the Simon task in the same subjects, and Experiment 2 consisted of the SART and the Simon task in the same subjects (different subjects from Experiment 1). EEG data collection and analyses were similar for both experiments.
Experiment 1
Subjects.
Twenty-nine subjects (age 18–27, six male, six left-handed) from the University of Amsterdam community participated in exchange for 14 euros or course credits. Subjects signed an informed consent document and reported to have normal or corrected-to-normal vision. The study was approved by the local ethics committee; all procedures complied with relevant laws and institutional guidelines. Data from 10 subjects were removed due to either too few errors (below 30 in one or more conditions, corresponding with a required minimum error rate of 5% per condition) or performance at chance level for one or more stimuli. None of the subjects showed excessive EEG artifacts (see below), thus 19 subjects (four male, four left-handed) were included in the final analyses.
Task.
Subjects performed three versions of the Simon task (Simon and Rudell, 1967) that differed only in block length, predictability of trial type, and instructions. The following stimulus and timing parameters were constant across blocks (Fig. 1A). Subjects were instructed to press with, e.g., their left thumb after seeing a blue or yellow circle, and right thumb after seeing a red or green circle. The same colors were used for all subjects and color-response mapping was held constant throughout the three versions of the task (left vs right counterbalanced across subjects). Targets subtended 0.50 degrees visual angle (dva) and appeared for 34 ms 8.33 dva left or right from fixation. The inter-trial-interval (ITI) was 500 ms. A gray fixation cross (0.25 dva) was always present; all stimuli were presented on a black screen. Response conflict is induced when the location of the target stimulus corresponds with the incorrect response hand (e.g., if the blue target, which requires a left-hand response, appears right of fixation). These trials are termed incongruent; congruent trials are those in which the target appears in the same visual hemifield as the required response. One third of trials were incongruent. There was a 1000 ms window after target onset in which responses were accepted. Feedback on response speed was presented with the words “respond faster!” if subjects did not respond within 750 ms after stimulus onset, or “too fast, respond to the circle!” if subjects responded faster than 100 ms. Subjects performed a short practice block of 48 trials with randomized congruent and incongruent trials. Feedback on accuracy was presented only in this practice block, after each trial, with the words “wrong” or “correct.” Feedback was presented at fixation, for 1000 ms.

Task design and trial sequence. A, Simon task, Experiments 1 and 2. Colors used: red–green and blue–yellow, mapped to either left or right thumb (counterbalanced across subjects), and presented either left or right from fixation. In one third of trials position on the screen and required response was incongruent. These settings were consistent for the different Simon conditions. B, SART Experiment 2. Trials contained digits 1–9 presented in lower left of visual field. One ninth of trials were NoGo (digit 5). Other settings were similar to the Simon task.
The three versions differed in the following instructions and parameters. The General Simon condition consisted of two blocks of 300 trials with congruency randomized over trials, and a self-paced break in between blocks. Subjects were instructed to focus on both accuracy and speed. The Motor Control Simon condition consisted of 17 blocks of 36 trials with randomized congruency, and 20 s breaks in between blocks. Subjects were instructed to maintain their attention to the task during these short blocks, and to use the breaks to regain their attention. Moreover, subjects were instructed to focus more on speed than on accuracy. The Sustained Attention Simon condition consisted of two blocks of 312 trials with a fixed, predictable order of congruency, which was explicitly told to the subjects: two consecutive congruent trials were always followed by one incongruent trial, and a fixed sequence of left/right responses was repeated every 12 trials. In addition, subjects were instructed to focus on accuracy rather than speed. Subjects always performed the General condition first; the order of the Motor Control and Sustained Attention condition was counterbalanced across subjects.
The motivation behind these manipulations was to maintain similarity across conditions while “tipping the balance” of errors toward being produced by motor control failures (in the Motor Control condition) or attentional lapses (in the Sustained Attention condition). We believe that these mechanisms are mixed in most studies, and are less mixed with these manipulations. Therefore, we expect more quantitative than qualitative differences between the Simon conditions, resulting from the distribution of qualitatively different error types varying in degree.
Active cognitive control processes on the current trial are partly shaped by the type of and performance on the previous trial (Gratton et al., 1992; Kerns et al., 2004; Egner, 2007; Cohen and Cavanagh, 2011). Therefore, we divided trials into separate accuracy conditions, collapsing over Simon-congruency: correct trials following and preceding correct trials (cCc), correct trials following error trials (eC), and error trials following correct trials (cE). Behavioral analyses were done on all three trial categories; EEG analyses were done on cCc and cE trials. Because all subjects had more cCc than cE trials, we selected for each subject a sample of cCc trials with reaction times (RTs) around the mean RT of cE trials, and number of this sample matching the amount of cE trials. This trial selection procedure ensures that differences between Simon task variants cannot be attributed to trial count, signal-to-noise ratio, or reaction time.
Experiment 2
Subjects.
Seventeen subjects (age 19–23, three male, all right-handed) from the University of Amsterdam community participated for 14 euros or course credit. Subjects signed an informed consent document and reported to have normal or corrected-to-normal vision. The study was approved by the local ethics committee; all procedures complied with relevant laws and institutional guidelines. Data of two subjects were removed due to excessive channel and/or EMG artifacts.
Tasks.
The experiment consisted of two tasks: the General Simon task and an adapted version of the Sustained Attention to Response Test, or SART (Mazaheri et al., 2009; O'Connell et al., 2009a). The General Simon task was the same as the one used in Experiment 1. Subjects always performed the General Simon task first.
Stimuli in the SART consisted of the digits “1” through “9” and were presented randomly in gray color in the lower left visual field, with an eccentricity of 3.15 dva. Subjects were instructed to respond with their dominant hand to all digits (Go trials) except “5,” at which they should inhibit their response (NoGo trial). On each trial the digits varied randomly in size (0.84–1.17 dva) and font. This was to ensure that subjects processed the identity of the digits rather than focusing on specific perceptual features. A gray fixation cross (size 0.25 dva) was always present. Trial timing parameters and feedback on response speed were similar to the Simon task (see above and Fig. 1B). Subjects performed a short practice block of 24 trials. The SART contained a maximum of 6 blocks of 324 trials, where each digit was presented 36 times per block. The task ended after the second through fifth block if the subject had made >50 false alarms (erroneously responding on a NoGo trial) in total. Trial selection procedure of error and correct trials was similar to Experiment 1.
EEG data collection
EEG data were acquired at 512 Hz from 64 channels (using a BioSemi ActiveTwo system; biosemi.com) placed according to the international 10–20 system, and from both earlobes (used as reference). Offline, EEG data were high-pass filtered at 0.5 Hz and epoched from −1.5 to 2 s surrounding each trial (to avoid edge artifacts resulting from wavelet filtering, see below). All epochs were visually inspected and those containing EMG or other artifacts not related to eye-blinks were manually removed. After rejection, Experiment 1 contained on average 66 cE and 66 cCc trials (minimum/maximum across subjects: 33/131, 31/130, respectively). In Experiment 2, the Simon task contained on average 77 (35/109) cE and 79 (37/111) cCc trials, and the SART 50 (37/62) and 51 (39/63), respectively. Independent components analysis was performed on the remaining epochs using the eeglab package (Delorme and Makeig, 2004) in Matlab (The MathWorks). Components that contained oculomotor artifacts (e.g., blinks) or other artifacts that could be clearly distinguished from brain-driven EEG signals (e.g., a bridge between neighboring channels) were subtracted from the data. Subsequently, all EEG data were spatially filtered using the current source density (CSD) approach (Kayser and Tenke, 2006). CSD as used here is equivalent to the surface Laplacian, and has previously been applied to sharpening EEG topography and performing synchronization analyses (Cavanagh et al., 2009, 2010; Cohen et al., 2009; Cohen, 2011). CSD accentuates local effects while filtering out distant effects due to volume conduction [deeper brain sources that project onto multiple electrodes, thereby obscuring neurocognitively modulated long-range functional connectivity (Srinivasan et al., 2007; Winter et al., 2007)]. After CSD, EEG data in each epoch were time-locked to the button press.
EEG time-frequency decomposition
The response-locked epoched EEG time series were decomposed into their time-frequency representation with custom written Matlab routines (Cohen et al., 2008) by convolving them with a set of Morlet wavelets (ei2πtfe−t2/(2σ2), where i is the complex operator, t is time, f is frequency ranging from 1 to 50 Hz in 50 logarithmically spaced steps, and σ defines the width of each wavelet, according to 4/2πf). From the resulting complex signal, an estimate of frequency-band-specific power at each time point was defined as the squared magnitude of the result of the convolution Zt (real[zt]2 + imag[zt] 2), and an estimate of frequency-band-specific phase at each time point was taken as the angle of the convolution result. Power was subsequently decibel normalized (dB power = 10*log10[power/baseline]), where for each channel and frequency the condition-averaged power signal during an interval of −400 to −100 ms prestimulus served as baseline activity. Interchannel phase synchrony (ICPS) reflects the similarity between pairs of channels of their time–frequency phase values averaged over trials. ICPS is computed as follows:
 where n is the number of trials, Φjt and Φkt are the phase angles of electrodes j and k at each time point t. Thus, ICPS varies between 0 (no phase synchrony between channels) and 1 (identical phase angles between channels) for each frequency band and time point. Note that ICPS is different from other functional connectivity measures, such as the phase-lag index (Stam et al., 2007), but similar to the phase-locking value (Lachaux et al., 1999).
Selection of electrodes, frequency bands and time-windows of interest
For our statistical analyses, we started with a selection procedure that was orthogonal to potential condition differences. First, we inspected activity in the a priori chosen frequency bands of theta (4–8 Hz) and alpha (8–12 Hz), collapsed over Simon conditions of Experiment 1. To pick electrodes of interest, we next plotted error-related (cE–cCc) topographical activity at three subsequent time points after response (0 ms, 250 ms, 500 ms; see Fig. 4A). Note that this electrode selection procedure was thus purely based on the comparison of error versus correct trials, which should reveal error-processing regions regardless of Simon condition. This comparison revealed clear activity at electrode FCz for theta. In the alpha band, activity was more distributed over posterior parts of the scalp without clear local maxima. To cover bilateral parieto-occipital areas [known to be involved in error processing during attention tasks (Vanni et al., 1997)], we chose electrodes PO3/PO4 for our alpha analyses. Next, specific time windows were chosen based on the peak activity in time-frequency power plots of these electrodes for cCc, cE, and cCc–cE activity (see Fig. 4B). For ICPS analyses, we initially picked the same time-frequency windows and electrodes as used for the power analyses. FCz and the average of PO3 and PO4 thus served as “seeds” for theta and alpha synchronization, respectively. For Experiment 2 we then used these same time-frequency windows and electrodes for both power and ICPS analyses.
Statistical analyses
For each subject the average activity (power/ICPS) from these electrodes and time-frequency windows was computed and entered into 2 (cCc and cE trials) by 3 (Simon conditions) repeated-measures ANOVAs for Experiment 1, and 2 (cCc and cE trials) by 2 (Simon vs SART) repeated-measures ANOVAs for Experiment 2. In all ANOVAs, if the sphericity assumption was violated, Greenhouse–Geisser corrected p values are reported with original degrees of freedom. Additional two-tailed t tests were used to examine directional effects. Correlations between brain activity and behavior were computed with Spearman's ρ.
Results
Experiment 1
Behavior
On average, subjects responded correctly on 84.6% (±SEM, 1.05) of total trials. Accuracy differed across conditions (F(2,17) = 12.51, p < 0.001), with highest accuracy in the Sustained Attention condition. The three conditions also differed in RT (F(2,17) = 134.6, p < 0.001), with the General condition showing the slowest, the Motor Control condition intermediate, and the Sustained Attention condition the fastest responses. All conditions induced the “Gratton effect” (Gratton et al., 1992): a significant interaction between previous and current trial congruency for accuracy and RT in the General condition (respectively, F(1,18) = 62.19, p < 0.001; F(1,18) = 81.64, p < 0.001) and the Motor Control condition (F(1,18) = 58.39, p < 0.001; F(1,18) = 83.32, p < 0.001), and Sustained Attention condition (F(2,17) = 18.51, p < 0.001; F(2,17) = 21.20, p < 0.001). In general, incongruent trials following congruent trials had the lowest accuracy and slowest responses, which is in accordance with previous findings (Egner, 2007; Cohen and Cavanagh, 2011). However, conflict effects were lowest in the Sustained Attention condition as indicated by a significant interaction between condition and congruency-sequence for both accuracy (F(4,15) = 9.74, p < 0.001) and RT (F(4,15) = 7.45, p = 0.001).
This difference in degree of conflict was also reflected in response speed of error relative to correct trials. As can be seen in Figure 2A1, the General and Motor Control condition showed “error speeding” (defined by lower RT on cE compared with cCc trials) while the Sustained Attention condition showed the reverse pattern (trend toward trial-type by condition interaction: F(2,17) = 3.5, p = 0.059; significant error-speeding only in the General condition: t(18) = 2.8, p = 0.011). Error speeding has been explained as resulting from a competing, faster processing of the irrelevant stimulus location, which at incongruent trials leads to errors (Ridderinkhof, 2002; Burle et al., 2005). This is often investigated by the conditional accuracy functions (Gratton et al., 1992; van den Wildenberg et al., 2010), which here revealed that the Simon conditions indeed differed on these speed-accuracy dynamics (Fig. 2B, quintile by condition interaction: F(8,11) = 10.08, p < 0.001). Specifically, fast responses (i.e., first quintile of the RT-distribution) on incongruent trials were below chance level for the General (t(18) = −3.04, p = 0.007) and Motor Control (t(18) = −2.45, p = 0.025) condition, suggesting response capture by the irrelevant location (Ridderinkhof, 2002). In contrast, for the Sustained Attention condition, accuracy was above chance on fast trials (t(18) = 4.51, p < 0.001), suggesting that this condition elicited fewer “impulsive” errors. Importantly, all conditions showed posterror slowing (Fig. 2A2): eC trials (correct trials after error trials) were slower than cCc trials (main effect of trial type: F(1,18) = 14.82, p = 0.001; no differences between conditions).

Behavioral results from Experiment 1. A, RT effects according to condition and accuracy on the current and previous trials, reflecting error speeding (A1) and posterror slowing (A2). B, Conditional accuracy functions showing accuracy as a function of quintiles of the RT-distribution, for congruent (dashed line, open circles) and incongruent (closed line, filled squares) trials of the different Simon conditions. Error bars denote SEM. GE, General; MC, Motor Control; SA, Sustained Attention Simon condition.

Behavioral results from Experiment 2. A, RT effects according to condition and accuracy on current and previous trial, reflecting error speeding (A1) and posterror slowing (A2). B, Conditional accuracy functions showing accuracy as a function of quintiles of the RT-distribution, for Simon congruent (CG; black dashed line, open circles), Simon incongruent (IC; black closed line, filled squares), and SART (gray closed line, filled squares). Error bars denote SEM. SI, Simon task; SA, SART.
EEG: power
All electrodes used for in-depth analyses were selected based on a condition-orthogonal contrast (see Materials and Methods for details). Figures 4 and 5 show the main effects of trial type (cE–cCc) on oscillatory power for the three Simon conditions averaged together (Fig. 4) and for the conditions separately (Fig. 5), revealing a robust error-related midfrontal theta increase immediately after the response, and a later parieto-occipital alpha suppression effect. In a 50–300 ms post-response time window, cE trials elicited stronger theta power than cCc trials at electrode FCz (F(1,18) = 126.7, p < 0.001). This effect differed across conditions (F(2,17) = 3.97, p = 0.032), with the Sustained Attention condition showing the least error-related theta (Fig. 5A3). Follow-up t tests confirmed a significant difference in cE–cCc theta power between Motor Control and Sustained Attention (t(18) = 2.39, p = 0.028) in this time window.

Response locked oscillatory power averaged over the different Simon conditions in Experiment 1, for correct and error trials, and error-related activity (cE–cCc). A, Theta (4–8 Hz; left) and alpha (8–12 Hz; right) power over space, from top to bottom at 0 ms, 250 ms, and 500 ms after response. Black-white disks denote electrodes plotted in B. B, Power in dB relative to baseline for electrode FCz (left) and for pooled electrodes PO3/PO4 (right). Black line boxes in bottom row show time-frequency windows of interest used for ANOVA.
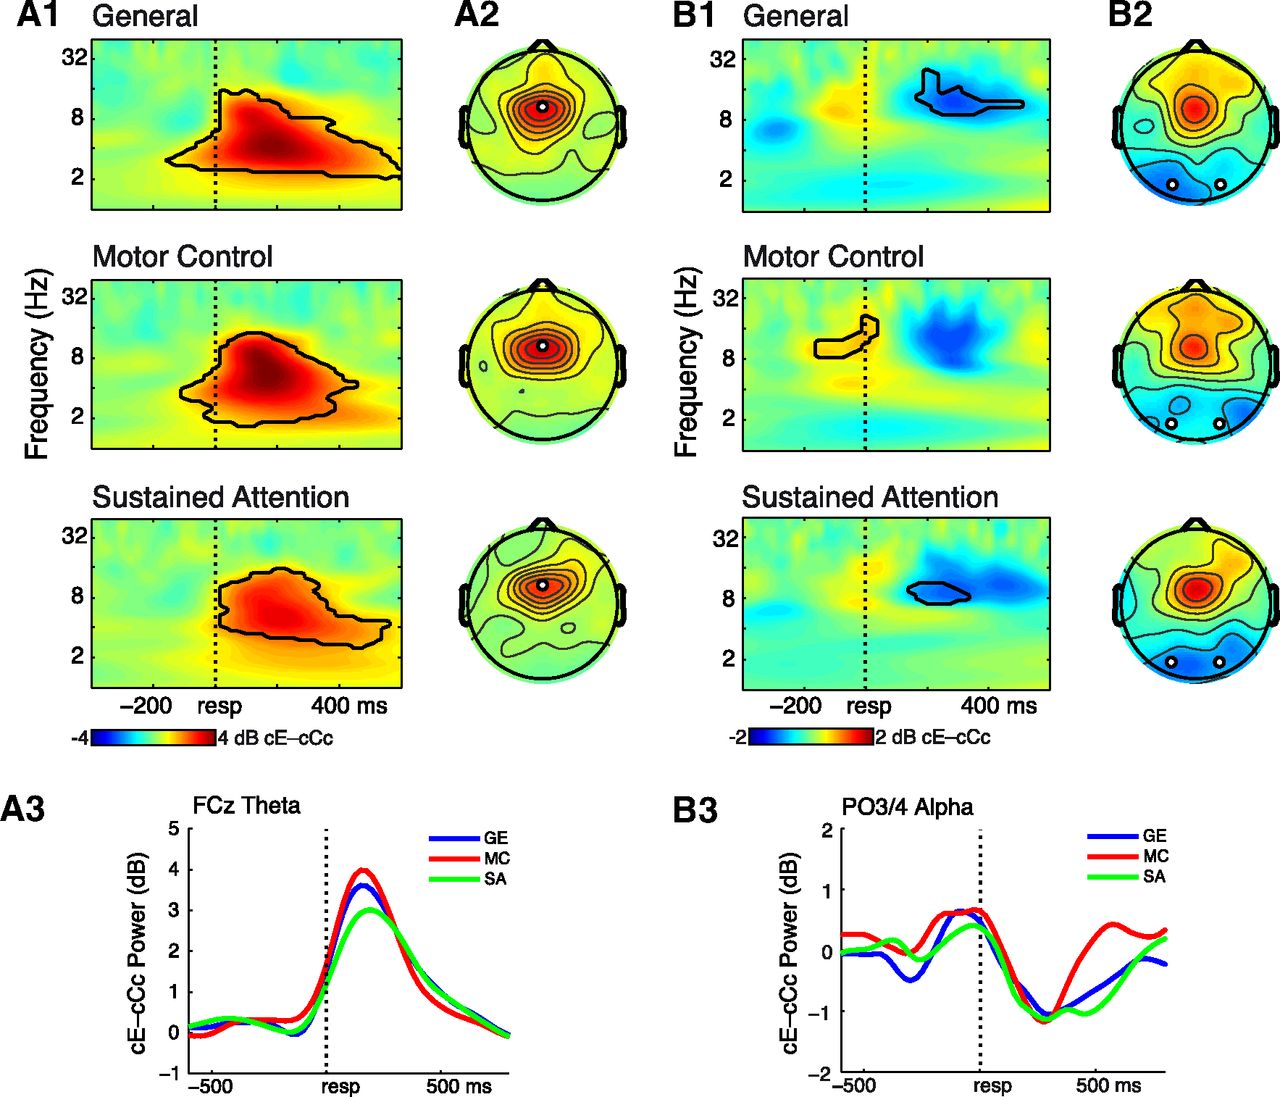
Error-related (cE–cCc trials) oscillatory power shows differential theta and alpha dynamics for the different Simon conditions in Experiment 1. A1, Time-frequency power plots for electrode FCz for the different conditions (rows). Black lines enclose regions of contiguous pixels that were significantly different from baseline at p < 0.0001, for at least 200 ms and three consecutive frequencies. B1, Same as in A1, for pooled electrodes PO3/PO4, with p < 0.001. A2, Topographical power plots for the theta band averaged over a postresponse time window of 50–300 ms. Black-white disks denote electrodes plotted in A1. B2, Same as in A2, for alpha 150–500 ms. A3, Line plots of FCz theta activity over time for the different conditions. B3, Same as in A3, for PO3/PO4 alpha.
At electrodes PO3/PO4, a time window of 150–500 ms postresponse exhibited stronger alpha suppression for cE trials than cCc trials (F(1,18) = 21.39, p < 0.001). There was no interaction with condition, although as can be seen in Figure 5B, the difference between conditions was in the duration rather than degree of error-related alpha suppression; these temporal dynamics were averaged out in the condition-averaging approach (see Materials and Methods). We thus performed an additional exploratory ANOVA on a 400–600 ms postresponse window, which revealed both a main effect of trial type (F(1,18) = 6.37, p = 0.021) and a significant interaction effect with condition (F(2,17) = 8.36, p = 0.001). A follow-up t test indicated that the Sustained Attention condition showed a more sustained alpha suppression than the Motor Control condition (t(18) = 3.41, p = 0.003; Fig. 5B3).
EEG: synchronization
We next examined whether in addition to power, error-related theta and alpha synchronization would also differentiate between the Motor Control and Sustained Attention condition. As “seed” electrodes for synchronization, we used the same electrodes as defined by the power analyses (FCz and the average of PO3/4). Thus, seed-electrode selection was also orthogonal to condition differences. In the same 50–300 ms window used for the analysis of theta power, a Simon condition contrast of cE–cCc theta ICPS showed general clusters of FCz-connectivity with lateral frontal and medial posterior sites. For Motor Control compared with Sustained Attention there was specifically higher theta synchronization with F5 and F6 and POz. Next, in the same 400–600 ms window used for the analysis of alpha power, we found for a Simon condition contrast of cE–cCc alpha ICPS, connectivity between PO3/PO4 and a right frontal cluster. Specifically, FC4 exhibited higher alpha synchronization for Sustained Attention compared with Motor Control (Fig. 6A1,B1).

Error-related (cE–cCc trials) interchannel phase synchronization shows differential long-range functional connectivity dynamics for the different Simon conditions in Experiment 1. A1, Topographical difference maps of FCz-seeded theta synchronization, for Motor Control more than Sustained Attention, over a 50–300 ms postresponse time window. Black-white disks denote target electrodes plotted in A2. B1, As in A1, PO3/PO4-seeded alpha synchronization for Sustained Attention more than Motor Control, 400–600 ms. A2, Line plots of error-related theta ICPS over time for the different conditions. B2, As in A2, for alpha ICPS.
Separate 2 (cE vs cCc) by 3 (Simon conditions) ANOVAs for theta and alpha confirmed these observations. Average FCz–F5/F6 theta synchronization within 50–300 ms postresponse was significantly higher at cE than cCc trials (F(1,18) = 16.81, p = 0.001), and this effect differed across conditions (F(2,17) = 6.70, p = 0.003). Figure 6A2 shows that this effect was highest for Motor Control (t(18) = 4.20, p = 0.001), and absent for Sustained Attention (t(18) = 0.97, p = 0.35), and the difference between these conditions was significant (t(18) = 3.47, p = 0.003). For long-range theta synchronization between FCz and POz, we also found within 50–300 ms a significant main effect of trial type (F(1,18) = 5.77, p = 0.027), and a significant interaction with condition (F(2,17) = 4.43, p = 0.019), which was driven by greater synchronization between these electrodes in Motor Control compared with Sustained Attention (t(18) = 2.63, p = 0.017). The latter condition did not show cE–cCc theta synchronization between these channels (t(18) = −0.85, p = 0.41; Fig. 6A2).
Subsequently, we examined frontoparietal network activity, quantified as alpha synchronization between electrodes PO3/PO4 and FC4. A similar ANOVA on average alpha ICPS within 400–600 ms between these electrodes initially did not give significant differences between cE and cCc trials (F(1,18) = 0.025, p = 0.88), nor was there an interaction effect with condition (F(2,17) = 2.67, p = 0.083). Note that the choice of time-window for this analysis was based on the exploratory power analysis described above. We thus conducted an additional exploratory ANOVA on a wider time window, upon inspection of the line plot in Figure 6B2 of alpha ICPS over time. Averaging over 200–700 ms, there was a significant trial type by condition interaction (F(2,17) = 5.22, p = 0.010), although there was no main effect of trial type. This partly resulted from initial lower ICPS for cE relative to cCc trials in Motor Control (200–500 ms, t(18) = −2.39, p = 0.028), followed by higher ICPS for Sustained Attention (500–700 ms, t(18) = 4.58, p < 0.001), within this time window, thus canceling out a main effect. Follow-up t tests confirmed that the difference between the two conditions within 200–700 ms was significant (t(18) = 2.89, p = 0.010). To evaluate the right-lateralized condition difference in alpha ICPS, the right plot in Figure 6B2 shows cE–cCc alpha ICPS between PO3/PO4 and FC3 with no clear differences between conditions. However, there was a main effect trial type (F(1,18) = 6.47, p = 0.020) reflecting lower average alpha ICPS between these channels for cE compared with cCc trials, 200–700 ms after response.
It has been argued that measured synchronization at the sensor level can in principle reflect spuriously coupled activity due to volume conduction from a single source (Nunez et al., 1997). Other more conservative measures of functional connectivity in EEG have been proposed, such as the phase-lag index (Stam et al., 2007). To control for this potential confound, we conducted a control analysis to show that the differences in phase angle between channels of interest, in the time-frequency windows with significant ICPS effects between Simon conditions, were not distributed around zero or π (which purely volume conducted apparent synchronization would predict). First, we computed for each subject, per Simon condition, the phase angle difference over time (−500 to 1000 ms) between the selected electrodes for theta (6 Hz; FCz–F5, FCz–F6, FCz–POz) and alpha (10 Hz; PO3–FC4, PO4–FC4), at the single trial (cE and cCc) level. Subsequently, we tested within-subject and over trials, whether these angles were significantly different from zero or π using the circular V-test (a modified version of the Rayleigh test for uniformity of circular data; see Fisher, 1996) from the circstat toolbox (Berens, 2009). Here, the alternative hypothesis states that angles are not uniformly distributed but instead have a specified mean direction. We used zero and π as mean directions; rejecting the null-hypothesis (p < 0.05) would thus be indicative of volume conduction. However, averaging over subjects, we observed only high p values (>0.50 for zero, >0.10 for π). In addition, our findings of no error-related theta interchannel synchrony in the Sustained Attention condition, and absence of error-related power effects in target electrodes, provides further evidence against volume conduction accounting for the synchronization results.
Cross-subject correlations
To test whether the above measures of error-related theta and alpha activity would share variance in terms of individual differences, we computed cross-subject Spearman's rank correlations for the different bands, brain measures, and behavioral results. First, we correlated power and ICPS in the same time-frequency windows that showed condition differences (see above) in these EEG measures. Only in the Motor Control condition, cE–cCc theta power at electrode FCz correlated positively across subjects with cE–cCc theta phase synchronization between FCz and F5/F6 (r(19) = 0.71, p = 0.001) and between FCz and POz (r(19) = 0.60, p = 0.007). In the General and Sustained Attention condition, these correlations were nonsignificant (all p > 0.05; Fig. 7A). Correlations with alpha band activity were not significant, nor were there correlations between alpha and theta error-related activity measures. These null effects are consistent with a previous study that found no significant correlation between post-error alpha power and ERN magnitude (Carp and Compton, 2009).

Cross-subject rank correlations for the different Simon conditions. A1, Error-related (cE–cCc) interchannel theta phase synchrony between FCz and F5/F6 correlates with error-related theta power at FCz only in the Motor Control condition. A2, Same as in A1, for FCz–POz ICPS. B, FCz theta power at error trials predicts reaction time on subsequent correct trials only in the General and Sustained Attention condition (lower RT rank means faster response).
In a next step, we examined whether oscillatory dynamics of theta and alpha on cE trials would predict reaction time performance on subsequent correct (eC) trials, which would reflect a neural mechanism underlying posterror performance enhancement (Cohen et al., 2009; Cavanagh et al., 2009; Manuel et al., 2012). Theta power over electrode FCz showed this relationship, however, surprisingly only in the General and Sustained Attention condition (r(19) = −0.61, p = 0.007; and r(19) = −0.48, p = 0.038, respectively; Fig. 7B). These negative correlations imply that subjects with on average higher FCz theta power at cE trials, responded faster on the next eC trial in these Simon conditions. This relation was not statistically reliable for the Motor Control condition, although the direction of the correlation was also negative (r(19) = −0.34, p = 0.16).
Experiment 2
Behavior
In the Simon task, subjects were correct on 81.7% (±SEM 1.9) of trials. In the SART subjects committed false alarms at 52.3% (±SEM 4.0) of all NoGo trials. Subjects responded faster in the SART than in the Simon task (t(14) = 8.83, p < 0.001; Fig. 3B). The Simon task elicited response conflict, as indicated by a significant congruency sequence (i.e., “Gratton”) effect on RT (F(1,14) = 24.06, p < 0.001) and accuracy (F(1,14) = 42.11, p < 0.001). In addition, errors in the Simon task were mostly elicited by the incongruent stimulus location at the fast end of the RT distribution (Fig. 3B, quintile by congruency interaction: F(4,11) = 58.55, p < 0.001). Both tasks showed error speeding (Simon: t(14) = 4.67, p < 0.001; SART: t(14) = 11.73, p < 0.001), which was stronger in the SART (trial-type by task interaction: F(1,14) = 5.71, p = 0.032). In addition, only the Simon task showed posterror slowing (t(14) = 4.17, p = 0.001; SART: t(14) = 1.79, p = 0.096).
EEG: power
As in Experiment 1, we observed strong error-related (cE–cCc) theta activity at electrode FCz, followed by posterior alpha suppression. As can be seen in Figure 8A, midfrontal theta power was highly similar across the two tasks (although in the SART, it also encompassed lower frequencies in the delta [∼2 Hz] range). An ANOVA on the same postresponse time window that we used for the theta analyses in Experiment 1 (50–300 ms) confirmed this (main effect of trial type: F(1,14) = 63.57, p < 0.001; no significant interaction with condition, F(1,14) = 1.27, p = 0.28). However, the SART did show a topographical distribution of theta activity that was slightly more anterior and less focal around FCz (Fig. 8A1). Indeed, post hoc t tests on all channels of error-related theta differences between Simon and SART revealed a spatial difference around AFz (p = 0.008; uncorrected for multiple comparisons).

Error-related (cE–cCc trials) oscillatory power shows similar theta but strongly differing alpha dynamics for Simon versus SART in Experiment 2. A1, Topographical power plots for the theta band averaged over a postresponse window of 50–300 ms, for Simon (top) and SART (bottom). Black-white disks denote electrodes plotted in A2. B1, Same as in A1, for alpha 150–500 ms. A2, Time-frequency power plots for electrode FCz for Simon (top) and SART (bottom). Black lines enclose regions of contiguous pixels that were significantly different from baseline at p < 0.0001. B2, Same as in A2, for pooled electrodes PO3/PO4. A3, Line plots of FCz theta activity over time for Simon (gray) and SART (black). B3, Same as in A3, for PO3/PO4 alpha.
However, the most notable difference between the tasks resided in posterior alpha suppression after errors compared with correct trials (Fig. 8B). In a time window of 150–500 ms after the response (same window used for alpha analyses in Experiment 1), the SART showed a stronger error-related (cE–cCc) decrease of alpha activity at electrodes PO3/4 than the Simon task (F(1,14) = 33.13, p < 0.001), which was also clearly revealed in the topographical distribution of error-related alpha (Fig. 8B1). Follow-up t tests confirmed that the alpha suppression effect was absent in the Simon task (t(14) = 1.18, p = 0.26), contrary to the alpha power results of the General Simon condition in Experiment 1.
EEG: synchronization
A contrast of cE–cCc theta ICPS revealed the same clusters of FCz-seeded connectivity as in Experiment 1 (Fig. 9A1). However, although the SART and Simon task did not seem to differ in terms of midfrontal theta power after errors, SART showed a stronger error-related increase in theta synchronization between FCz and F5/6 (F(1,14) = 14.27, p = 0.002), and FCz and POz (F(1,14) = 7.35, p = 0.017; same target electrodes and time window as in Experiment 1) than the Simon task. Surprisingly, and in contrast to Experiment 1, the Simon task did not show cE–cCc theta synchrony between these channels (t(14) = 0.42, p = 0.68, t(14) = 0.11, p = 0.92, respectively; Fig. 9A2).

Error-related (cE–cCc trials) interchannel phase synchronization shows differential long-range functional connectivity dynamics for Simon versus SART in Experiment 2. A1, Topographical difference maps of FCz-seeded theta synchronization, for SART more than Simon, over a 50–300 ms postresponse time window. Black-white disks denote target electrodes plotted in A2. B1, As in A1, PO3/PO4-seeded alpha synchronization for SART more than Simon, 150–500 ms. A2, Line plots of error-related theta ICPS over time for Simon (gray) and SART (black). B2, As in A2, for alpha ICPS.
Next, we examined whether similar frontoparietal alpha network activity that we observed in the Sustained Attention condition in Experiment 1, would also be present in the SART. However, in the same time window that showed the strong task difference in alpha power suppression, a clear pattern of PO3/4-seeded cE–cCc alpha ICPS was absent (Fig. 9B). Moreover, phase synchrony with FC4 (the target electrode found in Experiment 1) did not show an error-related effect (F(1,14) = 1.23, p = 0.29), nor an interaction with task (F(1,14) = 0.63, p = 0.44). A line plot of PO3/4-FC4 synchrony did seem to indicate stronger alpha connectivity for SART compared with Simon (Fig. 9B2, right), but an exploratory additional ANOVA on a −200 to 150 ms time window periresponse did not statistically confirm this (F(1,14) = 2.6, p = 0.13).
In addition, we performed the same control analysis as described in Experiment 1, to test whether ICPS was driven by volume conduction. The circular V-test again indicated that the theta and alpha phase angle differences between channels of interest were different from zero and π.
Cross-subject correlations
Similar to our approach for Experiment 1, we looked whether the above EEG and behavioral dynamics would correlate across subjects. Consistent with the theta ICPS findings, the average time-frequency window of 50–300 ms FCz theta power predicted FCz-F5/6 theta synchronization in the same time window only in the SART (r(19) = 0.56, p = 0.031) and not the Simon task (r(19) = 0.24, p = 0.39; Fig. 10). We did not find any statistical relationship between (post-)error RT and measures of power and synchrony.

Cross-subject rank correlations between theta power and theta ICPS for the two tasks in Experiment 2. Error-related (cE–cCc) interchannel theta phase synchronization between FCz and F5/6 correlates with error-related FCz theta power in the SART (right; black) but not in the Simon task (left; gray).
Discussion
In this study we demonstrated that performance errors can result in different patterns of midfrontal theta-band (4–8 Hz) and posterior alpha-band (8–12 Hz) oscillatory activity. The degree and distribution of these EEG dynamics depended on the task and subtle manipulations to a task. Within the Simon task, when demands on sustained attention were lenient due to short blocks with intervening breaks, errors were driven by the irrelevant stimulus location and were followed primarily by increased midfrontal theta power, and increased theta synchronization between midfrontal sites (FCz) and lateral prefrontal (F5/6) and posterior (POz) sites. In contrast, in longer blocks in which response conflict was predictable, such that sustained attention could easily lapse, errors were not “impulsive,” and elicited relatively less midfrontal theta and relatively more sustained parieto-occipital alpha power. Moreover, this condition did not show an error-related increase in frontal theta synchronization, but rather an increase in right frontal–posterior alpha synchronization. The SART, also sensitive to attention lapses, did not show this long-range alpha network activity, but errors did elicit a robust and widely distributed posterior alpha suppression response, together with increased midfrontal theta power and prefrontal theta synchrony. This latter effect was even stronger than in the Simon task. These findings generally support the idea that there are at least two cortical mechanisms for performance monitoring during cognitive control and attention tasks (Cohen and van Gaal, 2012).
Error-speeding and posterror slowing
In conflict tasks, errors are thought to result from a failure to exert cognitive control over the motor system, such that a faster bottom-up processing of the irrelevant stimulus location determines the selected response (De Jong et al., 1994; Ridderinkhof, 2002). However, this may depend on the amount of experienced conflict, and the demands on sustained attention. In Experiment 1, the Sustained Attention condition showed less conflict, and while there was a clear capture at the fastest trials of the incongruent stimulus location in the General and Motor Control condition, this was not the case in the Sustained Attention condition. In Experiment 2, in contrast, the SART showed strong error speeding, which is consistent with previous literature (Mazaheri et al., 2009; O'Connell et al., 2009a). In a “dull” task such as the SART, subjects get into an automatic response mode, resulting in decreased reaction time, with lapses leading to fast errors (Robertson et al., 1997). In addition, all Simon conditions (Experiment 1 and 2) showed posterror slowing, which is thought to be a consequence of the recruitment of adaptation mechanisms to avoid future errors (Ridderinkhof et al., 2004a; Hester et al., 2007). The SART did not show this effect: because of the infrequent occurrence of NoGo trials, there may have been less need for posterror adaptation on the subsequent trial (Hester et al., 2007).
The above patterns of results show that behaviorally, errors within and across tasks can show differences in RT and accuracy dynamics, indicating that different types of errors may exist that relate to variations in required cognitive control on the one hand, and sustained attention on the other.
Theta oscillations in a prefrontal network for performance monitoring and cognitive control
On a neural level, the existence of different error types was revealed by differential involvement of frontal theta and posterior alpha activity after errors. Our study adds to a growing body of evidence that theta oscillations may be the putative “language” of a prefrontal network (Cohen, 2011) centered around the MFC, in which action monitoring and top-down control mechanisms functionally interact to optimize performance (Gehring and Knight, 2000; MacDonald et al., 2000; Botvinick et al., 2001). Similar to our findings, other work has shown that errors in conflict tasks are followed by increased MFC theta power (Luu et al., 2004; Trujillo and Allen, 2007; Womelsdorf et al., 2010), as well as higher MFC–DLPFC theta synchronization (Wang et al., 2005; Cavanagh et al., 2009, 2010), reflecting local coordinated activity as well as long-range orchestrated functional connectivity. Moreover, we were able to show that these processes are not unique to conflict tasks, but are also involved after errors in a task that primarily captures attentional failures. This finding is consistent with another study that showed frontal theta activity after errors in the SART (Mazaheri et al., 2009). Medial and lateral frontal theta dynamics have been brought forward as the underlying physiological source of the ERN (Luu and Tucker, 2001). Similar to previous studies that showed the ERN to fluctuate depending on task dynamics (Maier et al., 2008; O'Connell et al., 2009a), we here demonstrate that the degree and distribution of frontal theta activity shows similar task and instruction-dependent sensitivity.
Alpha oscillations in parieto-occipital and right frontoparietal networks of sustained attention
Our general finding of a decrease in alpha power after errors is also in line with other studies (Carp and Compton, 2009; Mazaheri et al., 2009). It has been suggested that this change in alpha power reflects a refocusing of attention after a lapse (Macdonald et al., 2011). Similar to errors serving as signals to increase motor control to overcome conflict, errors due to lapses in sustained attention may serve as signals to increase task-related alertness on the next trial (Carp and Compton, 2009). We have found this “reorienting” alpha response to be more temporally sustained in a condition of the Simon task that was more vulnerable to lapses, compared with a condition that was more susceptible to location-driven conflict errors. Moreover, this effect was the most prevalent in the SART. In general, numerous studies have shown a relationship between decrease in alpha power and attention-related mechanisms, such as task-related alertness (Sadaghiani et al., 2010; Macdonald et al., 2011) and attentional demands (Ray and Cole, 1985). An increase in posterior alpha power has also been shown to predict errors in attention tasks before they occurred (O'Connell et al., 2009b; Bengson et al., 2012).
Moreover, in Experiment 1 we found increased posterror alpha synchronization between bilateral parieto-occipital sites and a right lateral prefrontal site in the Sustained Attention condition compared with the Motor Control condition. These alpha connectivity dynamics were less prominent in Experiment 2, although an earlier right-lateralized pattern could be recognized in the SART (data not shown). These observations fit previous literature. A right-lateralized frontoparietal network has been proposed to play a role in exerting top-down attentional control over lower sensory regions as a reorienting response (Corbetta and Shulman, 2002), which can be triggered by lapses in sustained attention (Weissman et al., 2006). Patients with right frontal lesions have been shown to exhibit sustained attention deficits (Rueckert and Grafman, 1996; Shallice et al., 2008). In addition to findings of anticipatory top-down modulation of sensory processing, reflected by right prefrontal modulation of parieto-occipital alpha activity (Capotosto et al., 2009; Zanto et al., 2010, 2011), we here thus suggest that a similar alpha network may be recruited after lapse-related errors, as a top-down refocusing of sustained attention.
Limitations
In contrast to clear and robust power effects in response to errors, some of our interchannel phase synchrony results were contrary to our predictions: most notably the absence of error-related theta synchrony in the Simon task of Experiment 2, and less clear right frontoparietal alpha connectivity in the SART. It is possible that these discrepancies were related to a relatively small number of trials per subject.
A second limitation is that the differences between the EEG signatures of errors in the different conditions/tasks were more quantitative than qualitative. Arguably, in most (if not all) conflict and attention tasks, errors result from temporary “failures” of different (and possibly qualitatively distinct) neurocognitive processes. In the present study, we tried to shift the balance of error-mechanisms by means of subtle manipulations and different tasks, but it is likely that both motor control failures and attention lapses contributed to errors in all conditions and tasks. Along similar lines, it is likely that other mechanisms can lead to errors, whereas we focused only on two.
Ideally, one could classify each error as being driven by conflict or attention lapse. Future studies using single-trial principle component analysis or classification-based techniques might better separate contributions of different error-processing mechanisms on a trial-to-trial basis. Such an approach might also better elucidate the relationship between these different mechanisms and behavioral posterror adaptation.
Conclusions
In this study, we aimed to characterize the involvement of different brain networks in response to errors. Overall, both theta and alpha frequency bands contributed to posterror EEG activity. By shifting the balance between two error types that we hypothesized to be present throughout a typical conflict task, and by directly comparing such a conflict task with a sustained attention task, we showed that not all errors are alike: different types of errors may coexist, each recruiting their own mixture of posterror electrophysiological processes. When investigating performance errors, one should consider what types of errors are being produced, and what patterns of neural activity might result.
Footnotes
J.v.D. and M. X C. are, and the present work was, supported by a Vidi grant from the Netherlands Organization for Scientific Research (NWO), awarded to M. X C. We thank the reviewers and Ali Mazaheri for their critical comments on an earlier version of this manuscript.
- Correspondence should be addressed to Joram van Driel, Department of Psychology, The University of Amsterdam, 1018 XA, Amsterdam, The Netherlands. j.vandriel{at}uva.nl
This article is freely available online through the J Neurosci Open Choice option.


