Article Text

Abstract
Introduction Health and care systems are complex and multifaceted, but most person-reported outcome and experience measures (PROMs and PREMs) address just one aspect. Multiple aspects need measuring to understand how what we do impacts patients, staff and services, and how these are affected by external factors. This needs survey tools that measure what people want, are valid, sensitive, quick and easy to use, and suitable for people with multiple conditions.
Methods We have developed a coherent family of short generic PROMs and PREMs that can be used in combination in a pick-and-mix way. Each measure has evolved iteratively over several years, based on literature review, user inputs and field testing. Each has has a common format with four items with four response options and is designed for digital data collection with standardised analytics and data visualisation tools. We focused on brevity and low reading age.
Results The results are presented in tabular format and as a taxonomy. The taxonomy is categorised by respondent type (patient or staff) and measure type. PROMs have subdomains: quality of life, individual care and community; PREMs have subdomains: service provided, provider culture and innovation. We show 22 patient-reported measures and 17 staff-reported measures. Previously published measures have been validated. Others are described for the first time.
Discussion and conclusions This family of measures is broad in scope but is not claimed to be comprehensive. Measures share a common look and feel, which enables common methods of data collection, reporting and data visualisation. They are used in service evaluation, quality improvement and as key performance indicators. The taxonomy helps to organise the whole, explain what each measure does and identify gaps and overlaps.
- patient-reported outcome measures
- patient satisfaction
- surveys
- attitude of health personnel
- diffusion of innovation
This is an open access article distributed in accordance with the Creative Commons Attribution Non Commercial (CC BY-NC 4.0) license, which permits others to distribute, remix, adapt, build upon this work non-commercially, and license their derivative works on different terms, provided the original work is properly cited, appropriate credit is given, any changes made indicated, and the use is non-commercial. See: http://creativecommons.org/licenses/by-nc/4.0/.
Statistics from Altmetric.com
- patient-reported outcome measures
- patient satisfaction
- surveys
- attitude of health personnel
- diffusion of innovation
Introduction
Surveys, completed by patients or staff, are widely used in tailoring care, quality improvement, evaluation and population health management. They need to cover the things that matter most to those completing them and other stakeholders. The challenge is to do this in a simple easy-to-use way, while recognising the complexity inherent in the health domain.1
Person-reported outcome measures (PROMs)2–4 and person-reported experience measures (PREMs) measure different things,5 with only weak correlation. PROMs measure people’s perception of their own situation; PREMs measure their perception of services provided. PROMs are a form of personal history and are of clinical value, but PREMs are usually anonymous, because people can be reluctant to criticise those they depend on. Individuals may choose to identify themselves in PREMs, but the default is not to.
PROMs and PREMs may be condition-specific or generic. Two-thirds of health and care expenditure is for people living with three or more chronic conditions,6 but most PROMs apply to only one condition, which limits their use. Different measures have been developed independently and do not work well together.7 For example, in some measures a high score is good, in others high is bad. Scale ranges vary, such as 0–1, 0–10, 0–48 or 0–100.
Generic measures work for all types of patients, treatments and conditions. They are based on the idea that people want similar things, such as good health and well-being, excellent service, supportive communities and organisations, care and innovations that meet their needs.
Care quality is assessed in terms of structure, process and outcome.8 Our focus is on outcome as perceived by patients and staff. Perceived outcome is only one aspect of a complex whole, although broader than the traditional definitions of PROMs and PREMs.9 However, it does not cover all aspects of health outcomes, experience and patient-centred care.10
Response rates are affected by perceived relevance and ease of use.11 Most measures require a higher reading age12 than the average reading age of the UK population, which is about 9 years.13
Background
This work has had a long gestation. During the 1970s, the author worked with Rachel Rosser to evaluate computer systems in a London hospital using a short staff-reported classification of disability and distress.14 Inter-rater reliability studies identified the importance of using clear, unambiguous wording.15
During the mid-2000s, interest in PROMs and PREMs increased, as exemplified by Darzi’s NHS Next Stage Review High Quality Care for All, which recommended their wide use.16 Unfortunately, existing tools were not well suited to routine use, having been used mainly in pharmaceutical clinical trials, where respondents have few time limitations and only one condition.
The author identified a need for a simple PROM that could be used on smartphones and tablets. This led to the development of the howRu health status measure, which evolved from Rosser’s classification. This was tested in a telephone survey of 2751 people living with long-term conditions, in comparison with 12-item Short Form Survey.17 It was also tested in comparison with 3-level version of EQ-5D in a hospital cardiovascular clinic,18 and in hip and knee replacement surgery.19
After the Stafford Hospital scandal, the financial crash and change of government, political interest turned to patient experience (PREMs). The howRwe patient experience measure was developed along the same lines as howRu to be quick and easy-to-use routinely. It was tested in an orthopaedic presurgical assessment unit.20 The howRu and howRwe measures were both used in a census of 24 000 care home residents in the UK, Australia and New Zealand.21 22
Person-centred care and new care models became a key focus during the mid-2010s. Wessex AHSN selected howRu and howRwe for use in the evaluation of the North East Hampshire and Farnham NHS Vanguard project, also known as Happy, Healthy at Home. This eventually used 17 different surveys with more than 2800 respondents. Explicit objectives included improved personal well-being and health confidence, which led to the development of the Personal Well-being Score (PWS) based on ONS4,23 and the Health Confidence Score (HCS).24Social prescribing and care navigation also attracted attention and evaluation funding, leading to related measures of loneliness, community cohesion and social determinants of health.
During the same period, Wessex AHSN was tasked with evaluating and promoting the spread of digital health innovation, which stimulated the development of innovation adoption measures.25 These built on the author’s prior work about how spread26 27 and interoperability28 are impacted by both technical and non-technical factors (eg, culture).
The aim of this paper is to describe the resulting family of generic measures, organised as a taxonomy. A taxonomy allows for measures to be viewed and compared, gaps identified and the body of work improved and developed further.
Methods
The author with colleagues has developed a family of short generic PROMs and PREMs to capture a broad range of patient and staff perceptions of quality of life, healthcare services, wider determinants of health, digital and service innovations. These measures share a common format and scoring scheme. They are picked and mixed as required to create longer surveys for different purposes in quality improvement, impact evaluation and as key performance indicators (KPIs).
All measures are generic, suitable for most situations and clinical conditions, irrespective of case-mix, across health and social care. They can be completed on paper, smartphone, tablet, PC or via text message or voice.
Using criteria set out in the literature,29–32 each measure was developed in a similar way.17 None of the work was commissioned formally or grant-funded. The author had full editorial control.
In outline, the approach used was as follows:
Recognise the need for a new measure, based on user feedback and other insights. All measures were developed to meet actual or perceived needs.
Review the relevant literature and identify key themes.
Develop prototypes, based on a common format of four items per measure and four response options per item.
Discuss, revise and field test with users, colleagues and other stakeholders.
Iterate, adapt, evolve and further test. This involved dozens or in some cases hundreds of iterations before all issues were resolved.
Evaluate the measure for distribution (eg, skewness and kurtosis), internal reliability and construct validity.
Publish in peer-review journal.
The common format, with four items (questions) and four response options, is not a rigid rule and exceptions may be allowed to the number of items or options, although none is shown in this paper.
The Health Confidence Score (figure 1) provides an example of the look and feel, showing the title, preamble and instructions, items (lines), options (columns), colour and emojis.24

The Health Confidence Score: an example of a measure.
Items
Each item measures perception of one characteristic or theme in a measurement domain. Most domains have a well-understood ideal. Item wording needs to capture different aspects of the domain in ways that people readily understand.
Particular attention was given to word count and readability. These were calculated using the word count and readability statistics included in Microsoft Word. In this paper, we use the text in the tables herein, including footnotes, with each item label treated as a separate sentence. The survey preamble and options are excluded, because the preamble is usually tailored to the local context and option repetition depends on administration mode (eg, the options should always be visible to the user). The readability measure is the Flesch Kincaid Grade (FKG), which estimates US school grade.33 As a guide, the reading age of a text is FKG plus five.
Options
The following option sets are used:
None, a little, quite a lot, extreme (none–extreme)
Strongly agree, agree, neutral, disagree (strongly agree–disagree)
Hardly ever, occasionally, sometimes, always (hardly ever–always)
Excellent, good, fair, poor (excellent–poor).
This list is extensible. For example, we could also use:
Agree, neutral, disagree, strongly disagree (agree–strongly disagree)
Strongly agree, agree, disagree, strongly disagree (strongly agree–strongly disagree).
Options are usually ordered left to right, from best to worst. We use colour coding and emoji (both of which are optional), from best (eg, green smiley face) to worst (eg, red sad face). Emoji are tailored to the meaning of each option set, using a choice from: grin, smile, neutral (straight mouth), unhappy and miserable.
All items are optional. In most cases the recall period is now. Many PROMs use recall periods with questions such as: “how often have you experienced X” during the last week or month. However, many people find recall difficult (eg, most people find it hard to remember what they had for dinner 2 or 3 days ago).34 These measures avoid specifying a recall period other than today or yesterday.
Scoring
A high score is always good, which aids consistent understanding of results. This rule is followed even when the name of an item or measure implies that it measures something undesirable.
For items about individuals, the scoring system is from 0 (worst) to 3 (best). For populations, the mean item score is transformed to a 0–100 scale using the formula: (mean item score)×100/3. For example, responding strongly agree to I know enough about my health scores 3 on the 0–3 individual scale and 100 on 0–100 population scale; disagree scores 0 on both scales.
Most measures comprise a group of four items. A summary score is calculated for each measure as the sum of the item scores. Assuming four items, at the individual level this gives a 13-point scale from 0 (4×worst) to 12 (4×best). For populations, the mean summary score is shown on a scale from 0 to 100, using the formula: (mean summary score)×100/12. A summary score is not calculated if any item score is missing.
Using a common 0–100 scale for item and summary mean scores enables direct comparison of the results. A mean score 100 occurs if all respondents chose the best option (the ceiling) and 0 if all chose the least desirable option (the floor). It is unlikely that an individual score will be confused with a population mean score, because they use different ranges.
Taxonomy
A taxonomy was developed as a way of organising and classifying the measures, to explain the range and scope of measures to others and to identify gaps and overlaps.
A taxonomy is a system for classifying multifaceted, complex phenomena according to common conceptual domains and dimensions.35 It is a hierarchy of things or concepts in which each node (other than the root) has a single parent and any number of sibling and child nodes. Each node is a specialisation or sub-class of its parent (inheritance).
The development of the taxonomy followed an iterative process similar to that used to develop its components. Key criteria were simplicity, coherence and inheritance.
Patient and public involvement
Many patients, health staff and members of the public took part in focus groups during the development of these measures. They helped test and refine early versions of the measures. Most focus groups were informal. Papers which describe the development and validation of specific measures provide more details of patient and public involvement for those measures.
This paper does not report identifiable data about any individuals or groups.
Results
The taxonomy
The results use the taxonomy as an organising principle or framework. Figure 2 shows the top levels.
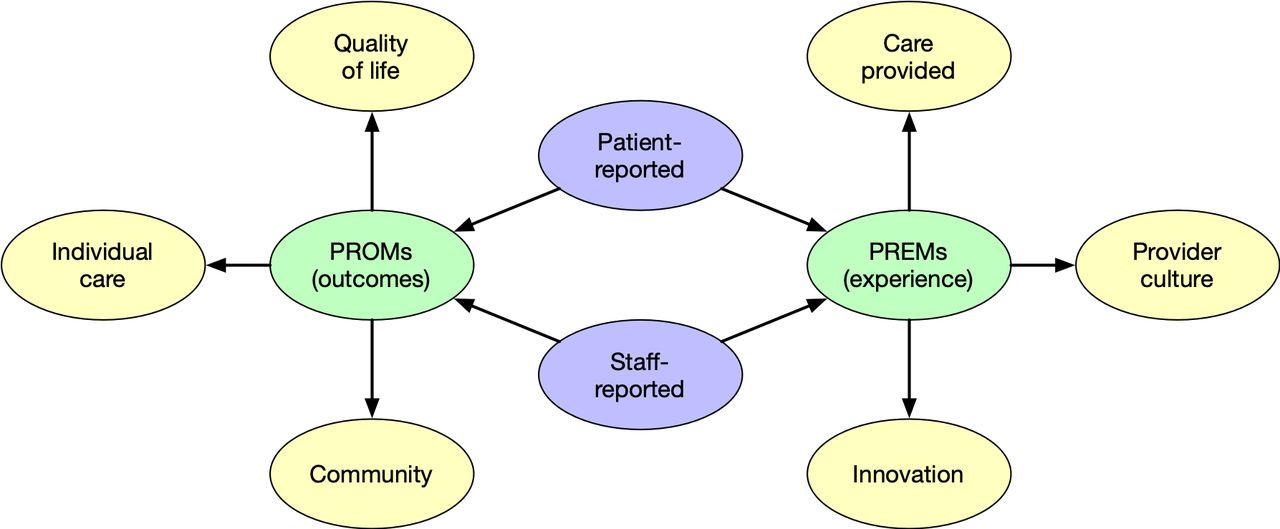
Top levels of the taxonomy. PREMs, person-reported experience measures; PROMs, person-reported outcome measures.
Patient-reported and staff-reported measures cover the same domains, but there are important differences between them. It helps to consider these roles separately. Patients are subjects of care, but staff provide care (eg, clinicians, admin staff and volunteers) within an organisational structure. Staff see many patients and the data collection process is usually simpler. Many staff-reported measures were adapted from patient-reported measures.
At the next level, the two broad categories of measure are person-reported outcome measures and person-reported experience measures.
Person-reported outcome measures
PROMs refer to the impact on individuals as perceived by the rater. They include measures of:
Quality of life
Individual care
Community
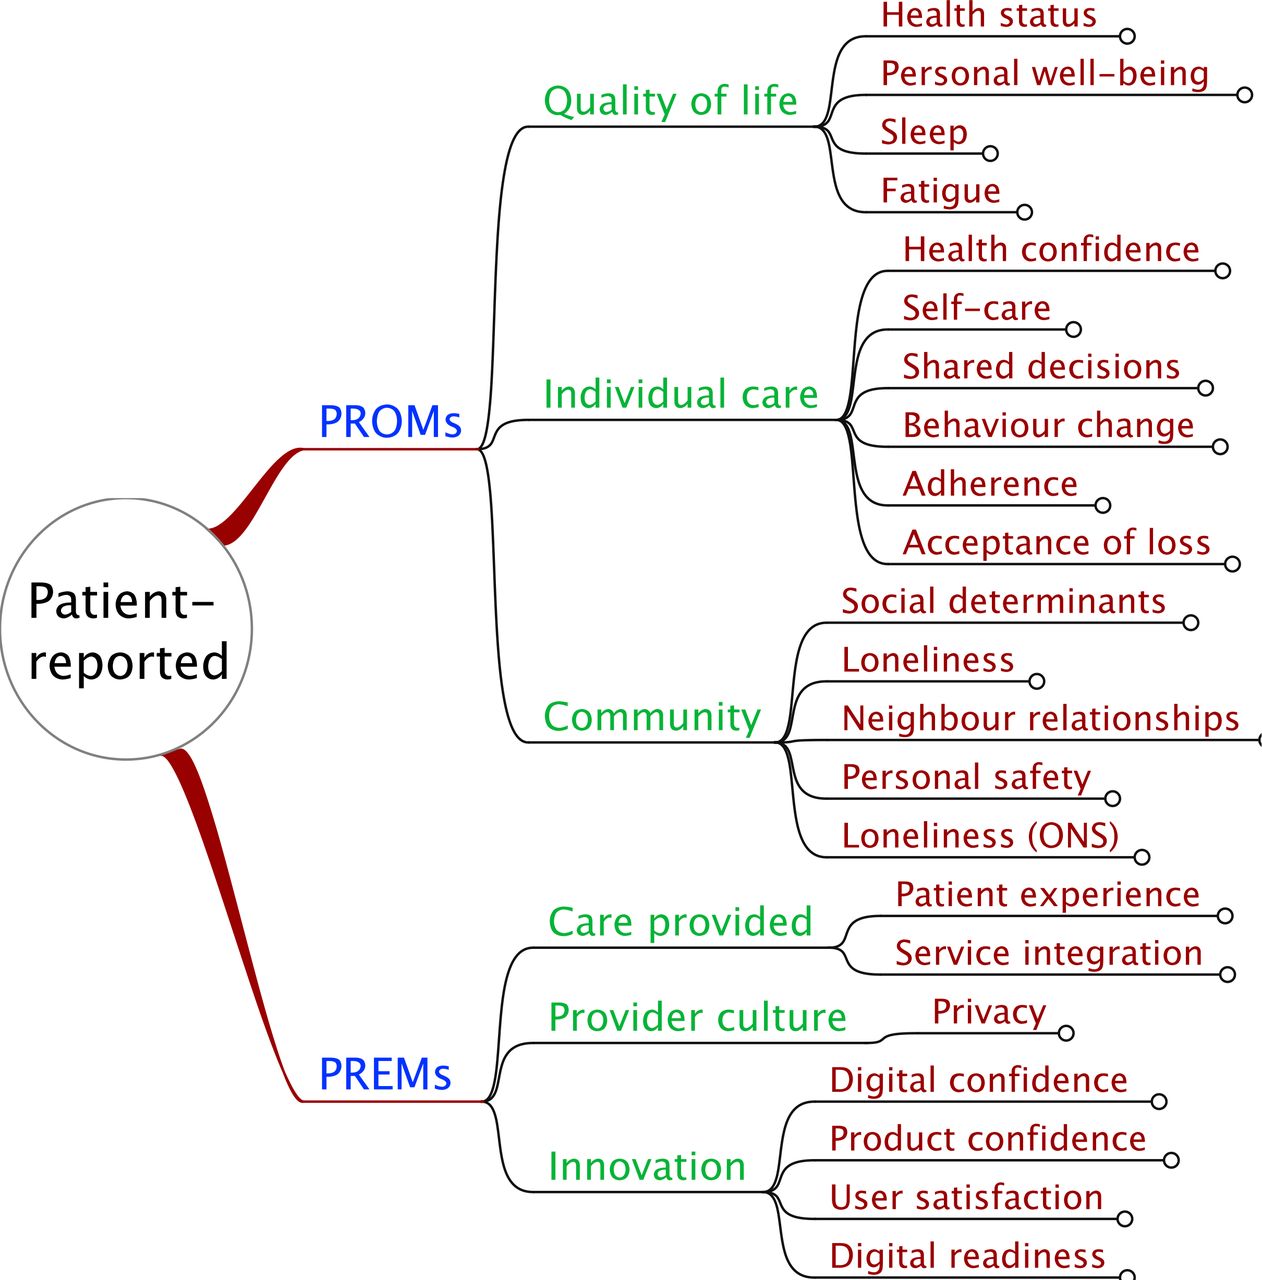
Quality of life measures include people’s health status, personal wellbeing, fatigue and sleep patterns. These are usually about patients, recorded by patients themselves or proxies on their behalf.
Individual care measures include health confidence, shared decision-making, self-care, behaviour change, adherence to treatment (eg, medication) and acceptance of loss. Individual care is typically based on interactions between patient and clinician (staff); both groups have their own perception of the outcome, which may differ.
Community measures include external and environmental factors such as social determinants of health, loneliness, neighbour relationships and personal safety. This is mainly related to how and where people live.
Person-reported experience measures
PREMs measure people’s perception of the service provided. There are three domains:
Care provided
Provider culture
Innovation
Care provided covers both individual services and the way that services work together. Patients and staff have views about the quality of care provided.
Provider culture measures aspects of each health and care organisation’s policies and practice. Staff have more direct knowledge and experience of the culture than patients.
Innovation focuses on the impact of specific innovations, such as digital health applications and new ways of working. Staff are invariably involved and patients less frequently.
Tables
Details of each measure are shown in tables 1–4.
Patient-reported outcome measures
Patient-reported experience measures
Staff-reported outcome measures
Staff-reported experience measures
Each table is set out with six columns:
Name: a short easy to understand name or label. The name is usually positively worded, but not always. For example, the health status (howRu) measure has an item for pain or discomfort. Here, the best (highest) score comes from having no pain. The English language is better at describing some aspects negatively.
Options: the response options easure how much the respondent currently perceives some thing to be a problem. Many measures ask about agreement with positively worded statements using a scale from strongly agree to disagree.
Text used in survey: text as presented to the respondent. In practice each survey also contains a preamble. This is not shown here, because it is usually context-specific and contains locally-specific instructions and context.
Alias: a short unique alias name used in computer processing. This does not contain spaces; it uses UpperCamelCase to separate natural words and component parts.
Words (FKG): the number of words and Flesch Kincaid readability grade.
Notes: brief description and reference to a publication about each measure or the most influential source that influenced its development.
Patient-reported measures
Figure 3 shows patient-reported outcome and experience measures.

Summary of patient-reported outcome (PROMs) and experience (PREMs) measures.
Staff-reported measures
Staff-reported outcome and experience measures are summarised in figure 4.

Summary of staff-reported outcome and experience measures. PROMs, patient-reported outcome measures; PREMs, patient-reported experience measures.
Staff-reported outcome measures are described in table 3. Staff-reported experience measures are described in table 4.
Table 5 summarises the number of measures by rater (patient-reported and staff-reported) and type (PROM or PREM). The expanded taxonomy is provided as a online supplementary file 1.
Supplemental material
: Expanded taxonomy of patient-reported and staff-reported R-Outcomes measures.Summary count of measures
Discussion
The need for generic measures with a broad scope is increasingly recognised, in particular for older people with long-term conditions.36 This taxonomy is, as far as we know, the most comprehensive, coherent framework or taxonomy of short generic measures that has been published. It is unusual in covering both patient-reported and staff-reported measures as well as PROMs and PREMs. It also covers external factors that affect health and well-being, and those that affect the spread of health innovations.
A possible limitation of our approach is that it is based primarily on the work of a single author. The measures were not developed as part of a grant-funded research programme in an academic setting, nor for use in clinical trials. Some people may consider this to be a strength on the basis that theories should emerge from bottom-up, empirical experimentation. However, each measure has been strongly influenced by existing theories and paradigms.
Four response options may also be regarded as a limitation, but this is not our experience. The best option (the ceiling) can be thought of as being as good as it gets. If used appropriately this does not produce a ceiling effect, whereby the measure is unable to detect valuable improvements. A floor effect (the worst option) is more problematic, because things can always get worse. In general, if a respondent is at the floor, this calls for remedial action. Intermediate options can be regarded as being less good than the ceiling and less bad than the floor, respectively.
Answering any survey question involves four cognitive steps: (1) understand the question; (2) retrieve relevant information from memory; (3) judge which response option fits best and (4) responding in a way that fits the judgement. There is always a risk that raters may satisfice by doing one or more of these suboptimally, to save effort. This can give rise to a number of effects such as acquiescence bias, primacy effect and non-differentiation. This risk is greater in surveys answered in private, where there is no other person present to sense-check the responses, if a survey is long or difficult, seen as a chore or not regarded as relevant.37
The response options form an ordinal scale, which suggests that non-parametric statistics should be used.38 However, interval or ratio scales ares needed for health economic calculations, such as quality-adjusted life year or Load calculations.39 We have explored the generation of multi-attribute interval weightings using pairwise comparisons with the PAPRIKA(Potentially All Pairwise RanKings of all possible Alternatives) method.40 In the absence of such weightings, we ascribe unweighted integer values to these options to calculate mean scores for item and summary scores of populations. In ideal situations (eg, people in good health), the distributions of these measures are skewed to the top, but summary scores for people with long-term conditions show a distribution which is close to normal.17 23 24 In practice, we find that parametric and non-parametric statistical tests produce very similar results.
It is useful to identify the minimally important difference (MID) between two sets of measurements. Half a SD is a widely used criterion at the individual level.41 So, for a summary score, if SD=20 on 0–100 scale (which is typical), the MID=0.5 (SD)=10. For populations, sample size (n) is a key variable, so if n=64 and SD=20 the 95% CI is ±1.96(SD/√n)=±4.9.
Carers or informal care givers form a special case, sharing aspects of both patients and staff; they are not discussed here, but will be considered in a future paper. There is no prohibition on people using measures that are not explicitly designed for them. For example, any measure may be completed by a proxy, but if so this should be recorded.
Four of these measures (health status, health confidence, personal well-being and experience) have been validated psychometrically at the time of writing.17 20 24 24 Five have been described in the literature (digital confidence, user satisfaction, innovation readiness, innovation process and behaviour change),25 three have been described in the specific context of residential care homes (work well-being, job confidence and service provided)42 and the process is underway for others. We encourage other validation studies.
Practical implementation always needs to consider the whole end-to-end process, not only what measures to use and why, but who, where, when and how.43 This includes ensuring that people are asked to complete surveys, that all the stakeholders involved understand what is being asked and why and that all aspects of survey management, including supporting technology and analytics, are properly resourced. Results may be reported at the individual level to tailor individual care, or aggregated to measure the performance of specific services or user needs.
These measures have been used with success in commissioning services and in the evaluation of new care models,44 social prescribing,23 care home services21 22 42 and in digital health evaluation, including self-care for people with diabetes and detection of atrial fibrillation (AF).
Innovation measures have been mapped to the Nonadoption, Abandonment and failure to Scale-up, Spread and Sustain framework (NASSS), which uses the lens of complexity theory to explain and avoid failures of digital health innovations.45
PROMs may be thought of as patient history, form part of the clinical record and inform patient care. However, identifiable data are subject to strict information governance, requiring compliance with the General Data Protection Regulation (GDPR), Health Insurance Portability and Accountability Act (HIPAA) and similar laws and regulations.46 In practice, to avoid issues of information governance, many PROMs are collected anonymously.
Widespread use of PROMs and PREMs requires integration with electronic health records and other health IT systems. This needs semantic interoperability using standards such as Fast Health Interoperability Resources (FHIR) and coding schemes such as Logical Observation Identifiers and Codes (LOINC) and Systematised Nomenclature of Medicine Clinical Terms (SNOMED CT).28 47 FHIR Questionnaire and Questionnaire Response resources support the use of surveys in day-to-day care and clinical research.48 LOINC supports the structure and content of assessment surveys.49 LOINC and SNOMED CT (UK Edition) codes have been allocated for some measures (eg, howRu and HCS)17 24 and applications for the others are underway.
Conclusions
This paper describes a family of generic PROMs and PREMs for routine use and in evaluation. This family of measures has a broad scope but is not claimed to be comprehensive.
The measures are described in tables and organised as a taxonomy. The taxonomy is categorised by respondent (patient or staff) and type (PROMs or PREMs). We describe 22 patient measures and 17 staff measures. Some are described here for the first time. These measures may be used to help tailor individual care, and at aggregate level for evaluation and accountability.
PROMs are grouped under categories for quality of life, individual care and community. PREMs have categories for service provided, provider culture and innovation. All of the measures share the same form, with four items with four response options. The measures are short with low reading age. They can be used to build short questionnaires for different purposes, using common survey management, data analyics, data visualisation and reporting tools. This flexibility allows practitioners to select measures on a pick-and-mix basis to meet their local needs.
Lay summary
This paper describes a family of short generic PROMs and PREMs, designed for use in combinations in a pick-and-mix way. PROMs cover quality of life, individual care and community; PREMs cover service provided, provider culture and innovation. Common properties of these measures include specialty-independence, brevity, ease of use, low reading age, a common format, data collection, reporting and data visualisation methods. They are used in tailoring care, quality improvement, service evaluation and as KPIs.
Acknowledgments
The author would like to thank all the people who have contributed to the development of these measures and this taxonomy. In particular, to members of the Insight team at Wessex AHSN, Dr Helen Seers and the anonymous reviewers who have helped improve this paper greatly.
References
Footnotes
Twitter @timbenson
Contributors The author takes full responsibility for this manuscript.
Funding There was no specicific grant for this research from any funding agency in the public, commercial or non-profit sectors.
Competing interests TB is a director and shareholder in R-Outcomes Ltd, which provides survey and evaluation services using these measures. Please contact R-Outcomes Ltd if you wish to use these measures (https://r-outcomes.com).
Patient and public involvement Patients and/or the public were involved in the design, conduct, reporting or dissemination plans of this research. Refer to the 'Methods' section for further details.
Patient consent for publication Not required.
Provenance and peer review Not commissioned; externally peer reviewed.
Data availability statement Data sharing not applicable as no datasets generated and/or analysed for this study.