Article Text

Abstract
Introduction As the health system seeks to leverage large-scale data to inform population outcomes, the informatics community is developing tools for analysing these data. To support data quality assessment within such a tool, we extended the open-source software Observational Health Data Sciences and Informatics (OHDSI) to incorporate new functions useful for population health.
Methods We developed and tested methods to measure the completeness, timeliness and entropy of information. The new data quality methods were applied to over 100 million clinical messages received from emergency department information systems for use in public health syndromic surveillance systems.
Discussion While completeness and entropy methods were implemented by the OHDSI community, timeliness was not adopted as its context did not fit with the existing OHDSI domains. The case report examines the process and reasons for acceptance and rejection of ideas proposed to an open-source community like OHDSI.
- public health
- medical informatics
- information systems
This is an open access article distributed in accordance with the Creative Commons Attribution Non Commercial (CC BY-NC 4.0) license, which permits others to distribute, remix, adapt, build upon this work non-commercially, and license their derivative works on different terms, provided the original work is properly cited, appropriate credit is given, any changes made indicated, and the use is non-commercial. See: http://creativecommons.org/licenses/by-nc/4.0/.
Statistics from Altmetric.com
Introduction
Observational research requires an information infrastructure that can gather, integrate, manage, analyse and apply evidence to decision-making and operations in an enterprise. In healthcare, we currently seek to develop, implement and operationalise learning health systems in which an expanding universe of electronic health data can be transformed into evidence through observational research and applied to clinical decisions and processes within health systems.1 2
Leveraging large-scale health data is challenging, because clinical data generally derive from myriad smaller systems across diverse institutions and are captured for various intended uses through varying business processes. The result is variable data quality, limiting the utility of data for decision-making and application. To ensure data are fit for use at both the granular, patient-level and the broader, aggregate population-level, it is important to assess, monitor and improve data quality.3 4
A growing body of knowledge documents abundant data quality challenges in healthcare. Liaw et al examined the completeness and accuracy of emergency department information system (EDIS) data for identifying patients with select chronic diseases (eg, type 2 diabetes mellitus, cardiovascular disease and chronic obstructive pulmonary disease). They found that information on the target diseases was missing from EDIS discharge summaries in 11%–20% of cases.5 Furthermore, an audit confirmed just 61% of diagnoses found in a query of the EDIS for the target conditions. Studies among integrated delivery networks and multiple provider organisations show similar results. A study of data from multiple laboratory information systems transmitting electronic messages to public health departments found low completeness for a number of data critical to surveillance processes.6
Given poor data quality in health information systems, researchers as well as national organisations advocate for developing tools to enable standardised assessment, monitoring and improvement of data quality.3 4 7 8 For example, in the report from a National Science Foundation workshop on the learning health system, key research questions called for developing methods to curate data, compute fitness-for-use measures from the data themselves and infer the strength of a data set based on its provenance.9 Similar questions were posed by the National Academy of Medicine in its report on the role of observational studies in the learning health system.10
In this case report, we describe our experience extending an open-source tool, designed to facilitate observational studies, to support assessment of data quality for use cases in public health surveillance. First, we describe the tool and our use case within the discipline of public health. Next, we describe the data quality measurement enhancements we developed for the tool. Finally, we discuss our efforts to integrate the enhancements into the open-source tool for the benefit of others.
Methods
Observational Health Data Sciences and Informatics (OHDSI)
OHDSI (pronounced ‘Odyssey’) is a multistakeholder, interdisciplinary collaborative to bring out the value of health data through large-scale analytics.11 The OHDSI collaborative consists of researchers and data scientists across academic, industry and government organisations who seek to standardise observational health data for analysis and develop tools to support large-scale analytics across a range of use cases. The collaborative grew out of the Observational Medical Outcomes Partnership12 13 with an initial focus on medical product safety surveillance. The OHDSI portfolio also includes work on comparative effectiveness research, as well as personalised risk prediction.14 15
To date, the collaborative has produced a body of knowledge on methods for analysing large-scale health data. These methods have been embodied through a suite of tools available as open access software (available at https://www.ohdsi.org/analytic-tools/) that researchers and industry scientists can leverage in their work. The common data model (CDM), which harmonises data across electronic medical record systems, is one example.12 Another example is ACHILLES, which is a profiling tool for database characterisation and data quality assessment.16 Once data have been transformed into the CDM, ACHILLES can profile data characteristics, such as the age of an individual at first observation and gender stratification. The ACHILLES tool operationalises the Kahn framework,17 a generic framework for data quality that consists of three components: conformance, completeness and plausibility.
Extending OHDSI in support of syndromic surveillance
Our project sought to extend the OHDSI tools to support syndromic surveillance, an applied area within public health that focuses on monitoring clusters of symptoms and clinical features of an undiagnosed disease or health event in near real-time allowing for early detection as well as rapid response.18 A public health measure for the US meaningful use programme, syndromic surveillance has been adopted by a number of state and large city health departments.19 Although adopted and used, syndromic data quality can be poor and could benefit from monitoring and improvement strategies.20–22
Based on a thorough review of the literature as well as focus groups with syndromic surveillance experts, we focused on developing three data quality metrics that did not already exist within OHDSI. First, we developed methods for calculating the completeness of key data useful for surveillance, including age, race and gender. Second, we built methods for measuring the timeliness with which syndromic data had been captured into the OHDSI environment. Third, we developed methods for analysing the information entropy of the patient’s chief complaint or reason for visit. Each metric was developed and tested using the instance of OHDSI at the Regenstrief Institute. We further sought to commit our code to the OHDSI project, coordinating our development efforts with the OHDSI community.
Extending OHDSI requires developing scripts to retrieve data from the CDM, scripts to analyse the retrieved data, and enhancing the interface that displays the retrieved or analysed data. Retrieving data from the CDM involves constructing Structured Query Language scripts that query the OHDSI data store. At Regenstrief, the OHDSI data store is an Oracle database configured to support the CDM (see figure 1). Once retrieved, data can be displayed to users in ATLAS, a unified interface for data and analytics. Modifying the ATLAS WebAPI enables developers to simply display data retrieved from the CDM or perform analyses of the data, which are then displayed to the user as reports.

Technical architecture for the data analytics environment. Data are sent from the source hospitals to the health information exchange. The data are replicated at the Regenstrief Institute, where they are extracted, transformed and loaded into the common data model. Once in the OMOP data store, the data can be queried by researchers and assessed for data quality. ETL, extract, transform, load; INPC, Indiana Network for Patient Care; INPCR, INPC for research; PHESS, Public Health Emergency Surveillance System; OHDSI, Observational Health Data Sciences and Informatics; OMOP, Observational Medical Outcomes Partnership.
To test the functions we developed for OHDSI, we extracted, transformed and loaded data from admission, discharge and transfer messages received from 124 hospitals for the Indiana Public Health Emergency Surveillance System, Indiana’s syndromic surveillance system (see figure 1).23 The messages spanned the years 2011–2014 and represented 9 014 601 emergency department encounters for 5 407 055 unique patients. Once transformed into the CDM, the data were loaded into the OHDSI database. The patient’s chief complaint is stored in the CDM as an observation.
The syndromic data were retrieved and analysed using the ATLAS tool. A cohort was defined as all patients with an encounter between 1 January 2011 and 31 December 2014, where the patient possessed an observation type of ‘chief complaint’ (CONCEPT_ID=38000282). Only the first chief complaint observation for a patient was returned. Once extracted from the OHDSI database, the cohort was analysed using the added functionality in ATLAS and available to users in reports for review.
Functionality developed to facilitate syndromic data quality assessment
Completeness
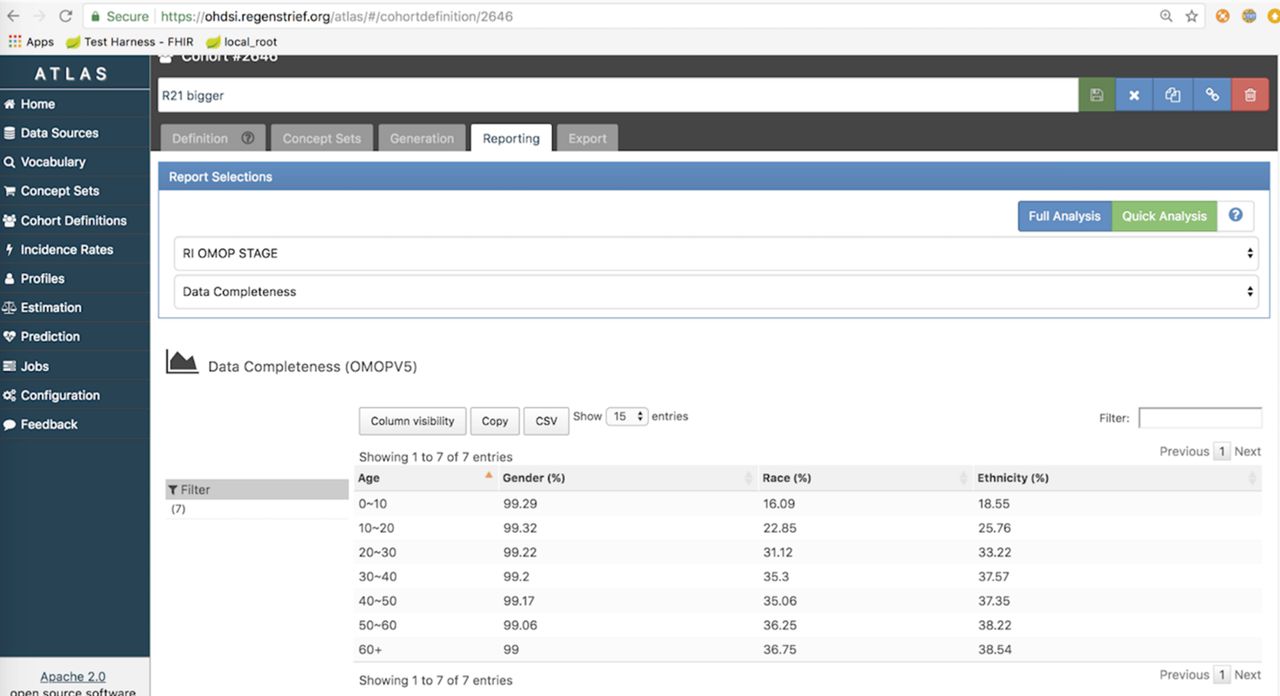
Based on prior work,3 6 24 public health agencies strongly desire to have complete data on age, gender, ethnicity and race. This is because public health agencies are tasked with examining and reporting on health disparities. Therefore, we modified ATLAS to calculate the completeness of these data fields as defined by the CDM. Completeness was measured as the proportion of patients with a corresponding value stored in the OHDSI database for each field. We further modified the ATLAS WebAPI to visualise the completeness measures. Figure 2 depicts completeness of data for race, ethnicity and gender stratified by age.

Screenshot of the OHDSI ATLAS tool displaying data completeness of the age variable for a population. OHDSI, Observational Health Data Sciences and Informatics.
Timeliness
Timeliness is a critical data quality metric as timely information about population health is necessary to inform responses to potential disease outbreaks. Therefore, we modified ATLAS to calculate the timeliness of records added to the OHDSI CDM database. Timeliness was measured as the difference, in days, between the date of an observation about a given patient stored in the source EHR system and the date when the observation was created within the CDM data store. This measure essentially represents the ‘delay’ (measured in days) between when data were first generated and when data were added to the OHDSI instance running at Regenstrief. To enhance ATLAS, we added a new data element to the CDM. Specifically, we created a column labelled ‘row_created_db_time’ in the ‘observation’ table. This field enables calculation of the difference between this date timestamp and the observation date. ATLAS was further modified to display the timeliness metric as a line chart visualisation that displays the average ‘delay’ over time for observations in the cohort.
Information entropy
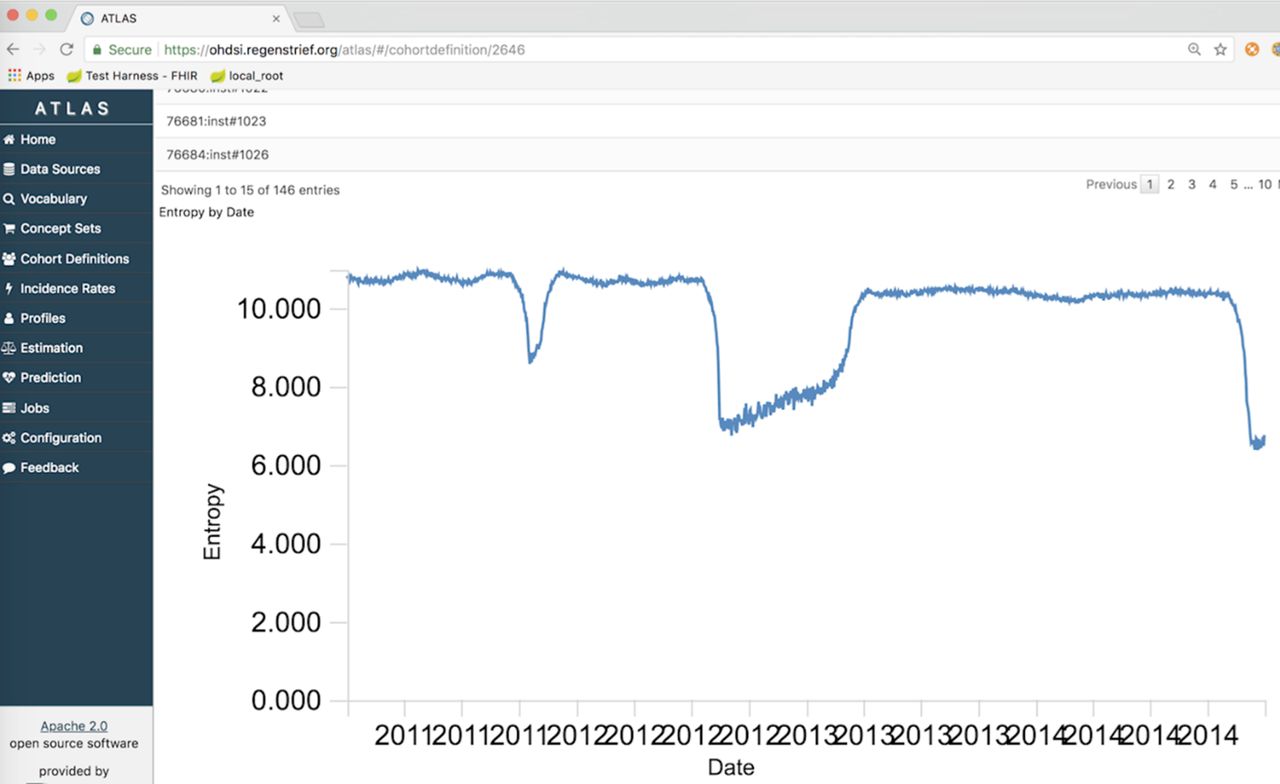
A final characteristic of data quality we developed for OHDSI was information entropy. Information entropy is the average rate at which information is produced by a stochastic source of data. We hypothesised the metric would be useful for monitoring changes in the information communicated by a data source (eg, hospital, emergency department) to a health department. Shannon's definition of entropy, when applied to an information source, can determine the minimum channel capacity required to reliably transmit the source as encoded binary digits. The formula can be derived by calculating the mathematical expectation of the amount of information contained in a digit from the information source. We used the metric to examine the amount of information represented in a patient’s chief complaint, which can also be referred to as the reason for visit. If monitored over time, changes in entropy may signal a change in the information coming from a given health facility. Detection of a change might indicate an emerging health threat. Entropy of chief complaints is depicted in figure 3.
Information entropy of patient chief complaints aggregated across multiple emergency departments from 2011 through 2014.
Discussion
Making enhancements in OHDSI available to others
Because OHDSI is a community collaborative built around a set of open-source tools and ideas, we sought to ensure the functionality developed to support syndromic surveillance was available to others. To that end, we engaged with the community when developing each function. Our lead developer (CW) engaged the ‘CDM and Vocabulary Development Working Group’, as well as the ‘ATLAS & WebAPI Working Group’ and the ‘Architecture Working Group’ to facilitate discussion and adoption of the new functions. The CDM and architecture groups were necessary as we requested a new data element to be created. New feature requests were submitted to each group. Requests were scheduled for discussion at a regular conference call, which were documented on the working group wiki site.25 After approval of the change request, CW developed and tested the code locally within the Regenstrief development environment. Investigators BED and SJG reviewed the new functions and reports. Once developed, the OHDSI team reviewed then merged the code into the OHDSI GitHub repository. Our functions were then available to others for immediate use during the next release of the OHDSI tools.
In the end, functions to calculate completeness of certain demographic fields, as well as information entropy of the chief complaint field, were adopted by the OHDSI community. Users with ATLAS and the WebAPI (V.2.3 and higher) can run a full cohort analysis, which generates the completeness and entropy measures as standard reports. The changes extend the existing tool set, as well as more fully operationalise the Kahn et al17 framework for data quality adopted by OHDSI.
Timeliness was ultimately rejected by the OHDSI community and therefore is not part of ATLAS or the WebAPI. The discussion and decision of the OHDSI community for this proposed functionality can be found online.26 While testing revealed the timeliness, measurement could be performed and visualised, the community did not perceive the function as valuable to the broader OHDSI community. Most uses of OHDSI centre on observational studies that utilise EHR data extracted retrospectively at regular time intervals (eg, quarterly) from their source. Therefore, timeliness in most cases will be of little interest since it is a fixed difference between the date of the ETL process and the date of the observation.
While epidemiologists need to monitor the timeliness with which data are reported to public health, this assessment is pertinent to the operational syndromic system and data feeds. Once extracted from HL7 messages, transformed to the CDM and loaded into an OHDSI platform, timeliness also becomes fixed and difficult for the epidemiologist to interpret or act on. In our examinations of timeliness for the millions of encounters, there was a singular, linear trend for timeliness based on the date of the ED visit. It was impossible to detect any kind of broken data feed or system downtime using the timeliness report in ATLAS. Tools to assess timeliness are better suited upstream in the data collection and management process within a public health department.
Lessons for the broader informatics community
This case illustrates an important theory relevant to biomedical informatics applications: data quality as ‘fit for use’ in a biomedical context. Information science theory defines data quality as a set of dimensions characterising how well data are fit for use by consumers.27 28 These dimensions include, among others, accuracy, granularity, completeness and timeliness. When the context of data use changes, what constitutes good data quality (eg, which characteristics are important to the user) will change concurrently. This case study illustrates fit for use for the data characteristics of completeness and timeliness. With respect to completeness, the context of use for epidemiologists, as well as observational researchers, is the same. In both cases, the user is interested in the proportion of patients or observations with a missing value in the record. Therefore, the OHDSI community saw value in adopting this data characteristic as a component of the OHDSI tool set. Because the contexts of use are different for public health surveillance versus observational research, a timeliness measure did not have value and was therefore rejected from the OHDSI tools.
The case further illustrates the importance of involving a diverse group of end users in the development of system functionality. In this case, the investigators engaged practising surveillance experts who would presumably be the end users of the new functions in OHDSI in accordance with informatics best practices.29 However, the team did not engage the existing user base of the OHDSI platform. Initial conversations with key members of OHDSI leadership indicated that all three functions would be of interest to the community. Yet, when conversations moved to actual change proposals, the community identified clear reasons why the timeliness component would not be of interest. The lesson for others is that a broader set of users is necessary to ensure new functions for a system will meet the needs of everyone and not just those for whom a new form, new decision support rule or new analysis might be initially targeted to serve.
This project sought to extend an existing open-source platform for use by a new community of users who also care deeply about data quality. There remains high value in adapting existing infrastructure and tools to support expanded use cases rather than to just create independent tools for use by a niche group. However, doing so requires careful consideration of new and existing users. Since our project began, OHDSI has begun to more systematically address data quality challenges as illustrated by the recently released Book of OHDSI.30 The book reviews data quality challenges, general data quality theory and profiles the tools available in OHDSI for addressing data quality. We are hopeful OHDSI and the book will continue to advance data quality theory and practice. Public health and other subdisciplines in biomedical informatics need the support to transform data into knowledge and action.
Acknowledgments
The authors thank the epidemiologists in local and state health departments, as well as employees of the National Syndromic Surveillance Program, for their input and feedback on the functionalities developed for assessing surveillance data quality. We further thank the active, engaged members of the OHDSI community for their efforts to review and discuss the ideas as well as code our team brought to the community.
References
Footnotes
Contributors BED and SJG conceived of and designed the project. JDD contributed to the study concept as well as its execution. CW and TF provided technical guidance on the project. CW created and tested all of the code developed for the project, and she served as the team liaison to the Observational Health Data Sciences and Informatics community. JLW served as the project manager, herding team members to move the project forward. BED wrote the initial draft of the manuscript.
Funding Research reported in this abstract was supported by the National Library of Medicine of the National Institutes of Health under Award Number R21LM012219. The content is solely the responsibility of the authors and does not necessarily represent the official views of the National Institutes of Health.
Competing interests None declared.
Patient consent for publication Not required.
Provenance and peer review Not commissioned; externally peer reviewed.