Article Text

Abstract
The spread of severe acute respiratory syndrome coronavirus-2 (SARS-CoV-2) has been unprecedented in its speed and effects. Interruption of its transmission to prevent widespread community transmission is critical because its effects go beyond the number of COVID-19 cases and deaths and affect the health system capacity to provide other essential services. Highlighting the implications of such a situation, the predictions presented here are derived using a Markov chain model, with the transition states and country specific probabilities derived based on currently available knowledge. A risk of exposure, and vulnerability index are used to make the probabilities country specific. The results predict a high risk of exposure in states of small size, together with Algeria, South Africa and Cameroon. Nigeria will have the largest number of infections, followed by Algeria and South Africa. Mauritania would have the fewest cases, followed by Seychelles and Eritrea. Per capita, Mauritius, Seychelles and Equatorial Guinea would have the highest proportion of their population affected, while Niger, Mauritania and Chad would have the lowest. Of the World Health Organization's 1 billion population in Africa, 22% (16%–26%) will be infected in the first year, with 37 (29 – 44) million symptomatic cases and 150 078 (82 735–189 579) deaths. There will be an estimated 4.6 (3.6–5.5) million COVID-19 hospitalisations, of which 139 521 (81 876–167 044) would be severe cases requiring oxygen, and 89 043 (52 253–106 599) critical cases requiring breathing support. The needed mitigation measures would significantly strain health system capacities, particularly for secondary and tertiary services, while many cases may pass undetected in primary care facilities due to weak diagnostic capacity and non-specific symptoms. The effect of avoiding widespread and sustained community transmission of SARS-CoV-2 is significant, and most likely outweighs any costs of preventing such a scenario. Effective containment measures should be promoted in all countries to best manage the COVID-19 pandemic.
- mathematical modelling
- epidemiology
- health systems
This is an open access article distributed in accordance with the Creative Commons Attribution Non Commercial (CC BY-NC 4.0) license, which permits others to distribute, remix, adapt, build upon this work non-commercially, and license their derivative works on different terms, provided the original work is properly cited, appropriate credit is given, any changes made indicated, and the use is non-commercial. See: http://creativecommons.org/licenses/by-nc/4.0/.
Statistics from Altmetric.com
Summary box
What is already known?
The SARS-CoV-2 pandemic is worldwide, affecting all countries and with everyone at risk of infection and death. However, countries have had different infection rates, and outcomes have suggested a main role for socioecological factors in its transmission, and personal vulnerabilities in determining its outcomes.
Non-pharmaceutical interventions present the best approach to contain the outbreak. Failure of containment leads to a significant increase in cases and deaths, with mitigation measures overwhelming health system capacities.
What are the new findings?
The countries in the World Health Organization (WHO) African Region have a lower risk of exposure—varied for each country—than other parts of the world. This suggests a lower rate of transmission in the region.
Only 22% of the population would be infected in the first year, with widespread community transmission, with fewer numbers of severe cases and deaths compared with that seen in other countries due to different personal vulnerabilities in the countries. However, the increase in hospitalisations and care needs and impact on morbidity and mortality of other conditions would have significant effects due to limited capacity to mitigate against the effects of the disease.
What do the new findings imply?
The success of the containment measures is critical for the region as their health systems are not designed to mitigate against the implications of widespread community transmission of SARS-COV-2.
Countries of the WHO African Region need to expand capacity, particularly of their primary hospitals, to mitigate the implications of widespread community spread of SARS-CoV-2. Basic emergency care needs to be included in primary care systems.
Introduction
The spread of the severe acute respiratory syndrome coronavirus-2 (SARS-CoV-2) and its resulting coronavirus disease of 2019 (COVID-19) has been unprecedented in speed and impact, contributing to widespread socioeconomic disruption. It has spread to all regions of the world, with 3 018 681 cases and 207 973 deaths reported in the World Health Organization (WHO)’s 100th situation report by 29 April 2020.1 The report showed that 45 of the 47 countries in the WHO African Region had cases, although fewer than expected. The WHO African Region is comprised of 47 member states from the African continent. These do not include Djibouti, Egypt, Libya, Morocco, Somalia, Sudan and Tunisia. The region had 0.77% of the worldwide cases even though it represents 13.7% of the global population, and 0.43% of deaths, with a case fatality rate of 3.88%, compared with 9.19% in the European region and 6.89% globally.
Containment and mitigation
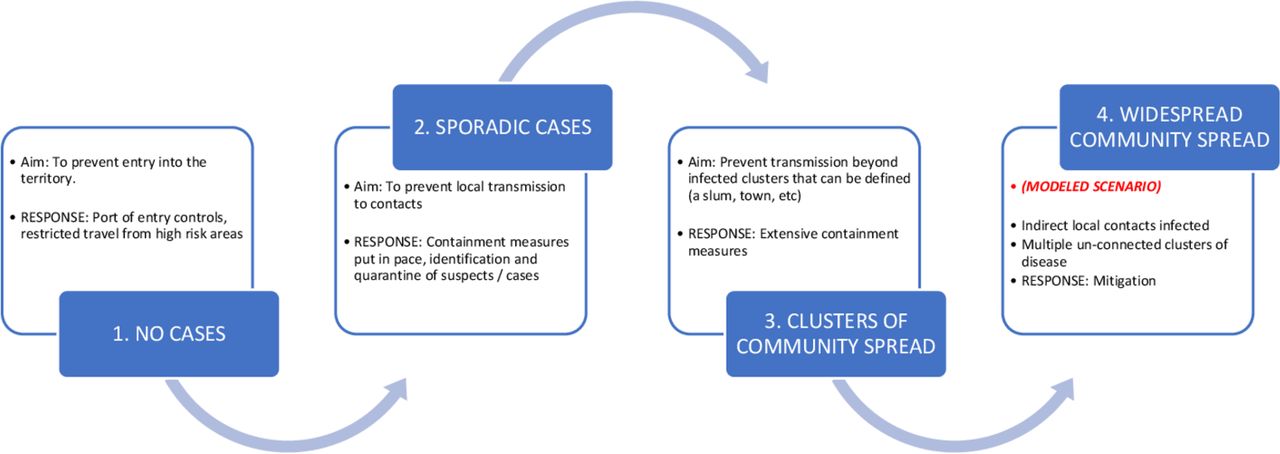
As with other infectious diseases, transmission of SARS-CoV-2 is a function of three attributes: sources of infection, routes of transmission and susceptibility of individuals to infection.2 Most current infection is from other humans, and the greater the exposure the higher the probability of infection. There are four distinct phases of infection intensity for SARS-CoV-2, of increasing possibility of exposure of a susceptible person: (1) sporadic cases (isolated cases primarily from persons known to have recently travelled, with the population at risk largely limited to contacts with the cases); (2) local transmission (additional cases from persons who can be traced to known cases, with the population at risk being the networks to which the cases belong); (3) clustered community transmission (additional cases are from persons who cannot be traced to known cases, but are within a definable cluster, such as a city, slum or large event, with possible exponential increases in cases within the clusters; the population at risk is the persons in the cluster to which the cases belong); and (4) widespread sustained community transmission (additional cases are from multiple, unconnected clusters and self-propagating with exponential increases of cases across these many clusters, with the population at risk being most of the population of the country or territory of interest) (figure 1).

Phases for SARS-COV-1 transmission in a country/territory. Source: produced by the authors for this publication.
The modes of transmission for SARS-CoV-2 are varied. Person‐to‐person transmission is documented, through respiratory droplets, contact and fomites,3 in addition to the possibility of zoonotic, nosocomial, faecal-oral and aerosol mechanisms.4–6 These routes of transmission are thought to be influenced by the socioecological context—the bio-geo-physical variables influencing spread of disease, such as population density, weather, population mobility, social behaviour and others—and build a complex picture of transmission influences.7 8 Finally, looking at susceptibility to SARS-CoV-2, older age, male sex and the presence of chronic comorbidities are associated with more severe disease and mortality.9–12
Control therefore is premised on addressing these attributes of transmission through containment measures aimed at avoiding widespread and sustained community transmission. Where these fail, costly mitigation measures are needed to reduce resultant morbidity and mortality. As seen in Europe and the USA, these measures place significant strain on health system capacities due to the inability to cope with the increased demand, with negative effects on other health services due to the diversion of essential supplies, staff and financial resources to the mitigation measures. In contrast with Europe and the USA, many countries in the WHO African Region have implemented containment measures early, primarily focused on physical distancing and improved hygiene practices. Physical distancing measures have been introduced through lockdown of schools, markets, places of worship and other locations to limit clustering mostly to the home. On the other hand, hygiene practices have focused on behavioural practices for improved hand hygiene, face contact, regular disinfection and other mechanisms aimed at reducing person-to-person spread. These containment measures have been introduced and enforced differently depending on perceptions of risk, balanced against enforcement capacity and socioeconomic implications.
Given the fewer events relating to SARS-CoV-2 in Africa, there have been efforts to predict how the pandemic would evolve, leading to varied estimates of impact and projected mortality.13–18 There are two reasons for this: knowledge of the virus transmission characteristics is still evolving and the prediction models are not adequately reflecting the socioecological factors. The unique context of a country or territory influences disease transmission.7 8 This may contribute to the different transmission dynamics seen in countries that have more mature SARS-CoV-2 outbreaks, with cases and deaths quite varied. These socioecological factors may play a role in the early pattern of SARS-CoV-2 transmission in many African countries—with slower transmission, fewer cases, less severe infections and fewer deaths than other parts of the world. Underreporting of cases is another possible contributor, but that alone would not explain the unique transmission dynamics in the region as some countries, such as South Africa, with better reporting systems would have outbreaks similar to those seen in the badly affected countries, which they do not, and conversely, we would not see relatively many cases in countries such as Cameroon and Burkina Faso with similar detection capacities to their peers.1
We therefore designed a model that uses both virus transmission characteristics and country specific socioecological factors to predict the most likely outcome of widespread and sustained community transmission of SARS-CoV-2.
What current epidemiological and statistical evidence tells us
Seven coronaviruses are now known to be associated with disease in humans, and present with clinical similarities to infections by other pathogens, including rhinovirus and influenza A.19 As symptoms tend to be mild in most people, they are prone to spreading extensively, eventually afflicting persons who may be susceptible to severe disease and leading to their known mortality effects.20
Genome sequencing has shown that SARS coronaviruses merit classification as a new group within the family of Coronaviridae.20 21 The spike protein of SARS-CoV-2 has undergone several mutations that heighten the probability of human cell infection.22 Human transmission is further amplified by asymptomatic carriers, enabling further undetected spread.20 23
Predictive models exist to capture transmission dynamics24–28 focused on different elements, such as the effects of lockdown measures,28 specialised equipment needs25 26 and projections on the speed of spread.24 27 The differential spread and impact show that influences beyond the characteristics of the virus are significant, in both determining transmission and its effects in terms of disease severity. The virus is currently understood to be highly transmissible, with various estimates for the basic reproductive number (R0) ranging from 0.41 to 2.39,29 but some estimates are as high as 6.49.30 This is higher than other coronaviruses, justifying strict containment measures.31–33
Estimates of attack rate vary in different studies, depending on the numerator and denominator used. According to the official WHO China Joint Mission Report on SARS-CoV-2, an attack rate of 3–10% was calculated, based on infection rate within a household as a cluster of exposed persons.20 Another analysis suggested an attack rate of 11.2–14.9% within households, but a rate of 6.6–9.7% across the population at risk during the infection.34 These are based on comparing reported cases against clusters of at risk persons. Lower attack rates have been estimated when the whole population in a country is considered susceptible as opposed to a specific cluster, with this ranging from 0.0899% (Canada) to 0.288% (Italy) of the population.35
Multiple pharmaceutical and non-pharmaceutical interventions (NPIs) have been used to slow the rate of infection, with varying degrees of success.36 37 Lockdown measures and effective hygiene practices have shown the most promise but are more difficult to enforce the more advanced a country’s disease transmission phase is. They are however still effective in reducing new infections, even in the event of widespread sustained community transmission.28 31 38 39
Current evidence classifies infected persons as being asymptomatic, or symptomatic with mild, moderate, severe or critical disease.4 40 Mild disease is associated with non-debilitating symptoms and no radiology features; moderate disease with fever, respiratory symptoms and radiological features; severe disease with either tachypnoea or oxygen saturation <93% or PaO2/FiO2 >300 mg; and critical disease with respiratory failure, septic shock or multiorgan failure.4 41
On the other hand, the number of asymptomatic infections is still not well estimated. In the early stages of an outbreak, it is difficult to determine this as detection is biased towards clinically severe disease.42 The number of asymptomatic cases is best determined from population based seroepidemiology data that provide more accurate numbers of infected persons.43 44 The current testing in many countries that is focused on symptomatic suspects and their contacts represents this bias, and implies asymptomatic cases will be underrepresented among cases. This experience was also documented with the recent MERS-CoV outbreak that showed increasing identification of asymptomatic case numbers over time as surveillance and testing strategies expanded.45 Initial evidence at the beginning of the pandemic suggested that only 1–5% of cases were asymptomatic.20 An analysis of early data suggested 86.1% of cases are undocumented, and given the bias towards clinical cases, suggested a potentially large number of asymptomatic cases.23 As testing is increased to wider populations, we see an increase in asymptomatic SARS-CoV-2 infections being detected, such as in South Korea46 47 and Germany.48 Testing strategies not focused on symptomatic patients or contacts also show high levels of asymptomatic cases, such as the findings from testing of flight returnees to China, reflecting up to 80% asymptomatic cases.49 Studies to ascertain the number of COVID-19 cases being identified suggest the SARS-CoV-2 ascertainment rate as 2.22–35.58%, indicating that many non-severe cases are not reflected in reported cases.37 However, the actual rate of asymptomatic cases can only be determined from seroepidemiology tests to find actual numbers of infected persons. Early results from these studies carried out in multiple places point to the total number of infections being up to 90 times the number of reported cases. We see infection in 30% of the population in Chelsea, Massachusetts, 14% in Heinsberg, Germany, 11% in Stockholm, Sweden, 21% in New York City, USA and 2–4% in Santa Clara County, California, USA, all of which point to asymptomatic cases of 50–95% of total reported ones.50 51 As of 20 April 2020, the WHO estimated that 2–3% of the global population are infected (150–230 million persons) compared with 2 314 621 reported cases, according to its 91st situation report, translating to only 1.5–2% of estimated cases reported.52 53
Evidence shows that among symptomatic cases, the probability of having mild, moderate, severe or critical disease is approximately 40%, 40%, 15% and 5%, respectively.5 9 Hospitalisation rates vary depending on hospitalisation policy and capacity, but it is estimated that 30% of symptomatic patients need hospitalisation, with case fatality highest for critical cases (up to 89% without intervention) and 49% for severely ill patients. The infection mortality rate, however, is estimated at <0.1%.42 54
These different states and probabilities allow us to build a model for infection in the WHO African Region, with appropriate assumptions tested through sensitivity analyses.
Methods
Infectious diseases are typically modelled using the conceptual model of a flow of population between four states: susceptible (S), exposed (E), infectious (I) and removed (R). We based our model on this concept, parameterising it to SARS-CoV-2 to incorporate the socioecological parameters that influence its transmission. We considered susceptible persons to be the whole population as there is no evidence of inherent immunity. We however do not expect every person to be susceptible at the same time, with various country specific factors influencing individual susceptibility and leading to the differential numbers of cases. We consolidated these into a ‘risk of exposure (RoE)’ that allows us to identify a subset of the susceptible persons who will be exposed to infection at a given time. This subset that we classified as the exposed persons differs from the SEIR model, where the exposed are defined as pre-symptomatic persons. Our model defines I as infected persons among the exposed population, as opposed to infectious. The attack rate represents the probability of an exposed person becoming infected. We considered ‘infected’ to be ‘infectious’, but incorporated a pre-symptomatic latent phase within the model to cater for the pre-symptomatic period for all infected persons, irrespective of severity.20 These infected persons were captured as the source of new transmissions in the model, thereby closing the loop. The removed population are the absorbing states of either recovery or death.
Based on markovian assumptions,55 56 we modelled the evolution of the disease using transition states and fitted a stochastic Markov chain model representing where any member of a population could exist at a given time. Each of these Markov states, denoted  with
with  , is associated with probabilities of transitioning to the next allowable state:

where A ⊂ S denotes a subset of states, and  refers to a sequence of random variables indexed by a variable
  which forms a discrete time random process, where
  . K refers to the invariant distribution for the Markov chain.
The distribution of the population, X, is represented across the Markov states.  gives the initial distribution of the Markov chain; the subsequent distribution of
  would be dependent on the distribution of
  . This conditional distribution of
  given
given  is described by:

where  is utilised to denote the
  application of
K
, an invariant distribution
application of
K
, an invariant distribution  for the Markov chain is a density satisfying the equation:
where  refers to both the distribution and density of the random variable.
Considering the still evolving evidence on the probabilities of transitioning between states, sensitivity analysis was conducted based on the range for each probability representing best or worst case, and a 10% deviation where there was no range from the literature.
Transition states
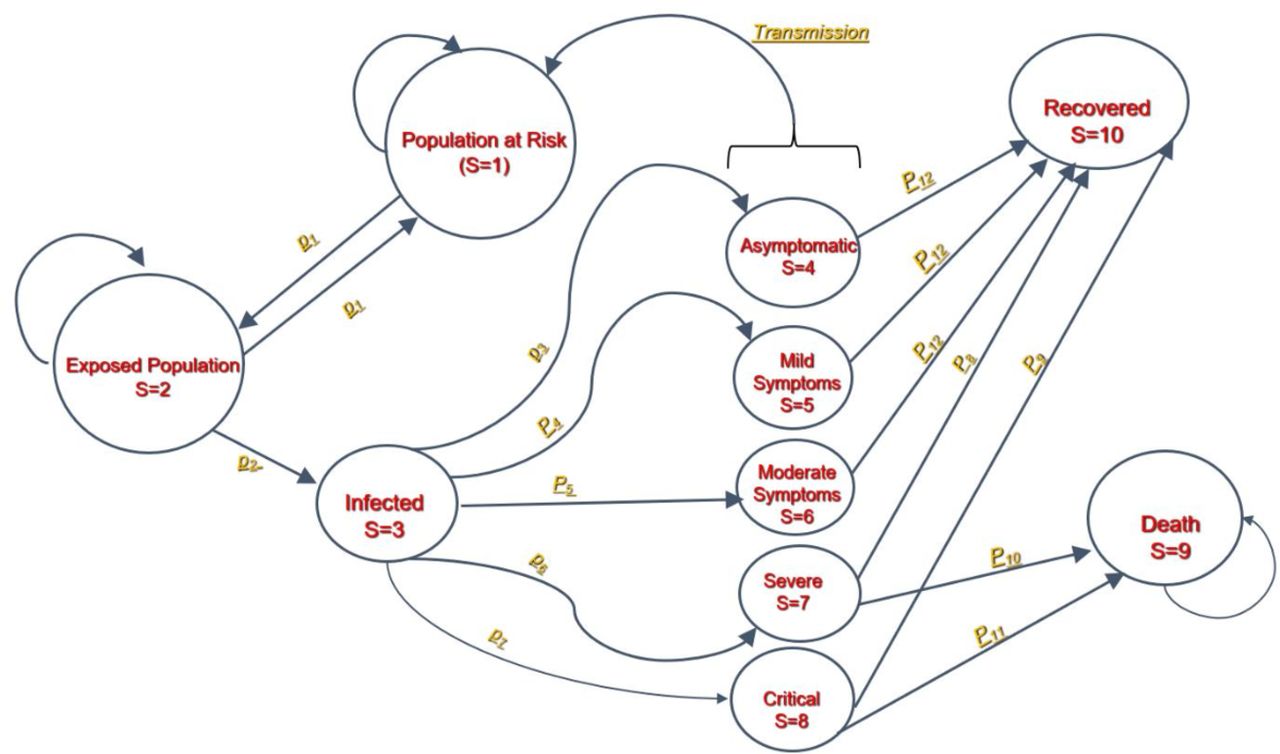
Ten states were defined. In a scenario of widespread and sustained community transmission, a country’s population is deemed susceptible (S1, the initial Markov state), while the exposed population (those at risk of getting infected at any given time) are the next Markov state, S2. Those who get infected are the next state (S3). If not infected, they will return to the previous Markov state (S2) to face a continued risk of exposure.
What happens to an infected person is represented by five mutually exclusive Markov states: asymptomatic (S4), mild symptoms (S5), moderate symptoms (S6), severe symptoms (S7) or critical symptoms (S8). These represent the final states for a case, and are not point-in-time descriptions. Infected persons are the source of transmission for the susceptible population.
The final absorbing states are death (S9) or recovery (S10), with distribution based on probabilities adjusted for existing vulnerabilities.9 57
The model recognises that the states are time dependent. The infection has an incubation period of 1–14 days, with an average of 7 days.20 We therefore aligned the model cycle length to 7 days to reflect this time dependency. The simulation was repeated every 7 days for 52 weeks to produce the results. To account for the fact that persons entering each Markov state may not enter at the same time during the cycle, we applied a half cycle correction.56 The different transition states and probabilities are summarised in figure 2.

Transition states and probabilities for SARS-CoV-2.
Transition probabilities
We defined transition probabilities for movement across the different Markov states, to obtain the actual numbers of persons in each state at a given time. These are based on current knowledge of SARS-CoV-2 infection. The prevalence of infection is taken to be the same in countries given the scenario is one of widespread sustained community transmission. This implies transmission is occurring across multiple clusters and is self-propagating and characterised by exponential growth in cases from multiple unconnected clusters. This is similar to the transmission that was occurring in Northern Italy, the USA and the UK before they instituted lockdown measures.
To better explore the role of contextual factors, we derived a probability to reflect the given population that is at risk of getting infected at a given time—RoE. This is different from the risk of infection as it identified the subset of the susceptible population that is at risk of infection (but not infected) at a given time, based on contextual specificities in a country. We used four contributory factors based on the knowledge of socioecological effects on disease transmission7 and coronavirus transmission modalities.
Gathering factor (gf). The tendency for people to cluster together, creating opportunities for transmission. The higher the ‘gathering’ tendency in a country, the higher the factor and its contribution to the RoE. People cluster during their activities of daily living, in the home, work/school or social environments. We used the following indicators based on data availability to reflect these: household size; number of children in school per capita; per cent of the population living in slums; and per cent of the population living in urban areas. We considered but did not include alcohol consumption per capita (as a proxy for social gathering) as most countries do not have recent or available data on this indicator. The normalised values for the applied indicators were averaged to produce a country specific gf.
 , where
refers to the
i
th gathering factor and
n
refers to the total number of factors.
, where
refers to the
i
th gathering factor and
n
refers to the total number of factors.Weather factor (wf). Although the influence of seasonality on SARS COV-2 is not clear,58 weather is a recognised socioecological factor affecting transmission of disease caused by other coronaviruses.59 Early studies also suggest that humidity and temperature could potentially affect the activity and transmissibility of SARS-CoV-2.60–64 We therefore included precipitation as a contributor to the RoE, being the only indicator relating to these with data across the countries in the region.
Distribution factor (df). Countries differ in the ease of movement of an exposed person, thus varying the extent to which an infected person can spread the virus from one location to another. We used permanent road network per square kilometre and vehicle density as proxy indicators for distribution factor. Both were applied as a country may have a limited road network (due, for example, to low population) but with heavy utilisation, or vice versa.
Sanitation and hygiene practices (sh). The mainstay of prevention of SARS-COV-2 is hygiene practices. It was therefore deemed that the effectiveness of a population’s hygiene practices would influence the RoE. The percentage of people using at least basic sanitation services—that is, improved sanitation facilities that are not shared with other households—was used as a proxy for hygiene practices.


We recognise that these factors are distributed unevenly in each country, and so the results should only be used at the national level, because extrapolation to the sub-national level would depend on the specific values for each of the sub-national units.
Examining the relationship across these factors, the gf and df were assumed to behave in an interactive way, as clustering and distribution are related, while the wf and sh were assumed to be additive. Hence the product of gf and df was then averaged with the wf (precipitation) and sh to derive the estimated RoE for each of the countries.

We considered applying more weight to the gathering and hygiene factors, and less to the weather factor due to the uncertainty of the influence of weather factors on the speed of transmission. However, there was no evidence to guide weighting criteria. We therefore maintained an equal weighting to the contribution of the four factors.
Other factors are being explored to explain the differential transmission, such as possible cross immunity with other coronaviruses or BCG vaccine,65 and population behavioural characteristics. The model allows for the RoE to be updated when evidence on these becomes conclusive.23
The remaining transition probabilities relate to the probability of an exposed person becoming infected, the attack rate, an infected person becoming either asymptomatic or falling into one of the defined symptomatic states, and the probability of recovery or death.
The attack rate represents the transition probability from S2 to S3 states. We used the average value of 6.5%, based on the 6.6% overall rate found in the community transmission,34 with 3–15% representing the two extreme values from the literature for best and worst case scenarios, respectively.
The model incorporates the NPIs relating to the distancing and hygiene measures a country has implemented to reduce the attack rate. Ten NPIs are included: seven distancing ones (closure of schools, formal workplaces, markets and social entertainment places, together with restrictions on inter city travel, social gatherings such as burials and public transportation) and three hygiene practices (enforcement of regular handwashing and safe hygiene practices). The attack rate can then be customised for each country based on which NPIs had been introduced, and how much they have been implemented. The more the NPIs and higher their implementation, the greater the effect of reducing he country’s attack rate.
From S3, the probabilities of transitioning to one of the five states are based on the literature. We applied an estimate of 80% of cases (allowing 10% variation for best and worst case scenarios) being asymptomatic based on the emerging literature of asymptomatic proportions. We applied sensitivity analysis to explore how this varies, reflecting the still emerging evidence. For symptomatic cases, we applied the proportions of 40%, 40%, 15% and 5% representing the mild, moderate, severe and critical forms of the disease, respectively. This categorisation translates to 88% of infected persons not realising they are infected with COVID-19 (have mild/no symptoms), while 4% will have severe/critical disease requiring specialist intervention. The remaining 8% will have moderate but non-life threatening symptoms. For recovery following infection, we applied 100% of asymptomatic, mild and moderate cases, 50% of severe cases and 12% of critical cases.2
Regarding hospitalisation, assuming 30% of symptomatic cases require hospitalisation,66 we considered all severe and critical cases would need hospitalisation, and applied the remainder to moderate cases who would be hospitalised (25%). The initial probabilities associated with each transition are shown in table 1. The values in the model differ for each country, based on its context specific information.
Parameter values for transmission dynamics of SARS-CoV-2 in the World Health Organization African region
Factoring in vulnerabilities
The final application of socioecological factors was with biological aspects influencing disease progression. Current evidence suggests that COVID-19 is more severe among older people, men, and people with underlying chronic health problems.9 57 Given the difference in these parameters in the WHO African countries compared with Europe and China where most probability assumptions have been developed, we applied an adjustment factor based on the relative difference in selected vulnerabilities between a country and Europe (it was not possible to get reference values for Wuhan, China). In deriving this vulnerability adjustment factor, data on tuberculosis prevalence, diabetes prevalence, HIV prevalence, total alcohol consumption per capita, smoking prevalence and protein energy malnutrition were considered as most likely to cause differences in infection outcomes. However, of these, HIV and diabetes prevalence were the only ones with an interpretable pattern on severe and critical cases. This is possibly because some of these estimates are also modelled. Tuberculosis and HIV prevalence are highly correlated across countries due to the comorbid nature of the two diseases; therefore, the tuberculosis effect is not lost, particularly in countries with a high prevalence of HIV. As a result, we factored in three vulnerabilities: per cent population >65 years, prevalence of HIV as a proxy for chronic communicable conditions and prevalence of diabetes as a proxy for chronic non-communicable chronic conditions. We did not consider sex, as we also assumed this was double counting of the vulnerabilities (men are more prone to these risk factors). These proxy indicators for vulnerability were assumed to contribute to the mortality pattern in a proportional manner, based on their respective burdens in each country. The indicator values per country were normalised between 0 and 1 and then averaged to yield a vulnerability adjustment factor.

where  refers to the normalised specific vulnerability factor. On average, the age factor reduces, HIV prevalence increases, and diabetes prevalence is largely similar to numbers with severe/critical disease; however, these trends vary by country.
In populating the model, data were triangulated from multiple sources. The population parameters were obtained from the United Nations Population Division database.67 Data on school populations (tertiary, secondary and primary), prevalence of HIV, prevalence of non-communicable diseases, percentage of the population older than 65 years, average annual precipitation, road network and the proportion of population using at least basic sanitation were obtained from the World Development Indicators database.68 The results are specific for each country, with the model run for a 52 week period. Please see the online supplementary material for further information. Neither patients nor the public were directly involved in the design of the study as it was primarily analytical.
Supplemental material
Results
Risk of exposure in countries in the WHO African Region
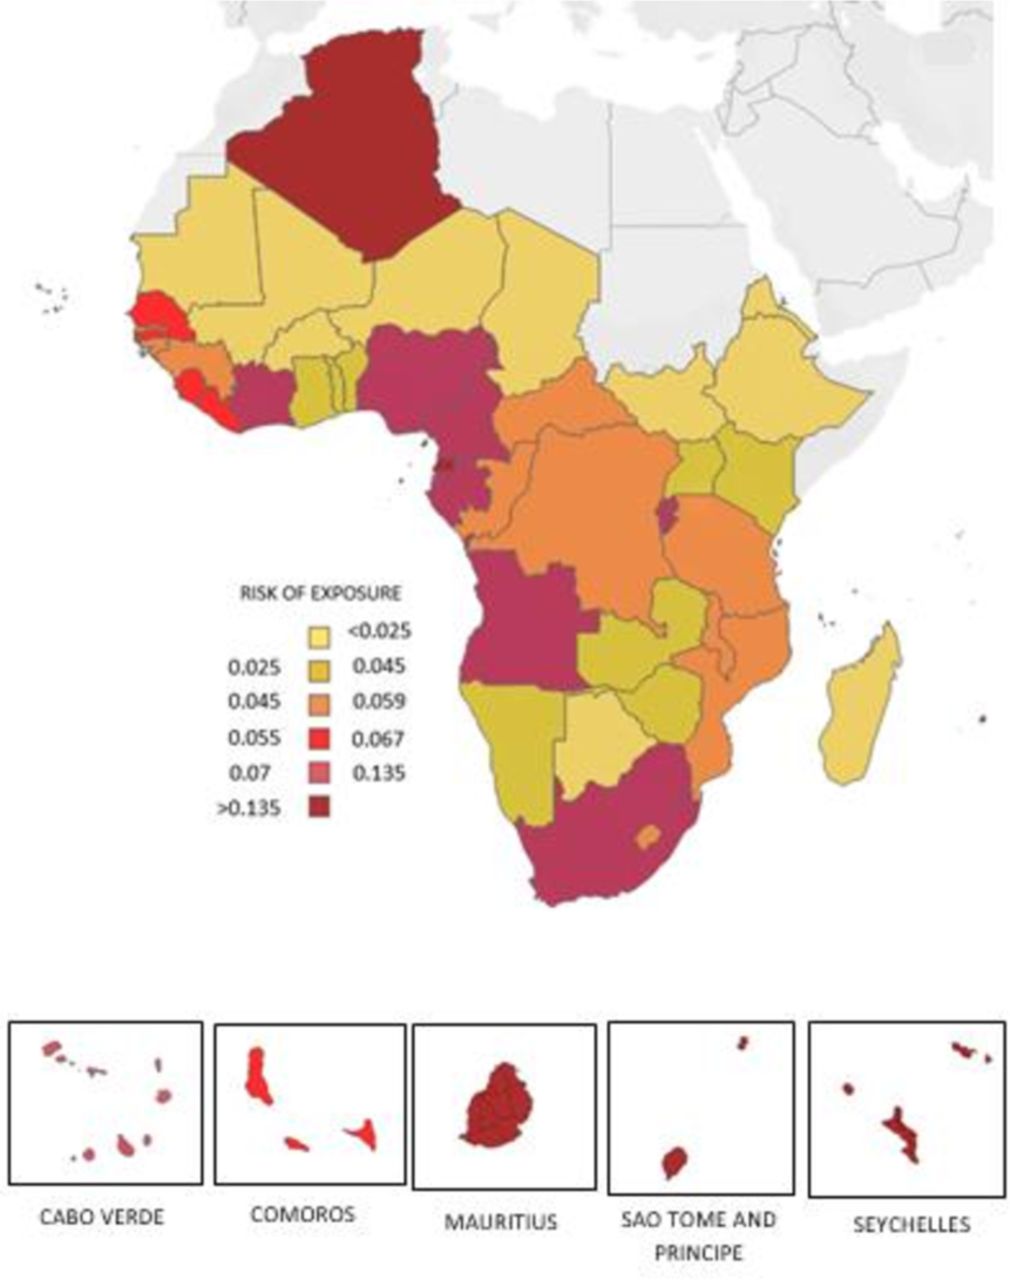
The RoE ranged from 0.002 to 0.461 for the Africa Region, with the relative values shown in figure 3. The RoE was higher in small states, whether island or mainland Africa, with these being seven of the top 10. These countries face the highest risk of transmission as their exposed population is high. Mauritius had the highest RoE. South Africa, Cameroon and Algeria were the only large countries among the top 10 highest RoE. The lowest RoE was mainly observed in sparsely populated countries, with Niger, Mauritania and Chad having the lowest RoE. Eritrea, Ethiopia, South Sudan and Madagascar were among the lowest 10 RoE countries that are relatively more densely populated than the other low RoE countries.

Risk of exposure of the population in countries in the World Health Organization African region.
Expected impact of COVID-19 in the WHO African Region
We present the 1 year prediction of the implications arising from widespread community transmission of SARS-CoV-2 in each WHO African country, which would result from failure of the containment measures (table 2). From the model, the region would have 223 281 401 (166 016 889–275 695 204) persons infected, representing 22% (16–26%) of the population. There would be 36 967 532 (28 953 415–44 071 349) symptomatic cases, with 150 078 deaths (82 735–189 579). The estimated infection mortality rate would be 0.06% (0.05–0.07%). A total of 4 637 240 additional hospitalisations (3 592 443–5 529 368) would occur, of which 139 521 would be severe cases, requiring oxygen (81 876–167 044), and 89 043 critical cases, requiring ventilation support (52 253–106 599). The model strength is in provision of country specific values based on their attributes of disease transmission.
Predicted implications over 52 weeks of widespread community transmission of SARS-CoV-2 by country in the World Health Organization African Region
Sensitivity analysis
Given the high uncertainty with several probabilities, it is important to see how the predictions change when varied. We specifically explored variations in four probabilities: RoE, specifically the gathering factor, as this had the least empirical evidence supporting its inclusion; the attack rate value; the effect of NPIs; and the proportion of asymptomatic cases. We used the number of deaths as the proxy for results (150 078 (82 735–196 645)). We tested the effect on the overall number of deaths when each of the indicators constituting the gathering factor was removed (figure 4).

Impact of different variables, constituting the gathering factor, on overall deaths.
None of the indicators constituting the gathering factor significantly changed the results when eliminated, and the total number of deaths remained within the projected range. Children in primary school had the largest positive change (2.3%, 3758 deaths), while the proportion of the population living in slums had the largest negative change (3.2%, 4778 deaths). Similarly, changing the proportional implementation of the NPIs did not change the results significantly. Reducing the implementation effectiveness of NPIs to 75%, 50%, 25% and 0% changed the number of deaths by 3.8%, 7.5%, 11.1% and 14.7%, respectively. Implementing lockdown interventions only, without improved hygiene practices, increased deaths by 6.4%, while only hygiene practices without any lockdown interventions increased them by 8.5%.
Furthermore, changing the attack rate did not have an effect on the results, and raising it did not increase the results beyond the reported best and worst case ranges. An increase to 60% on the attack rate augmented the number of deaths to 166 148, which lies within the range of the best and worst cases of the results.
Finally, the proportion of asymptomatic cases was varied to see what proportion it needs to be for the study results to change. The model is based on 80% of infected persons being asymptomatic, or 88% if asymptomatic and mild disease patients are combined. To remain within the range of possible results predicted by the model, the proportion of asymptomatic cases ranges between 74% and 89% (or 84.4–93.4% of persons having asymptomatic/mild disease).
Discussion
Comparability with current knowledge
The results suggest a slower rate of infection compared with other areas of the world, together with lower mortality rates among the infected. The calculated reproduction rate, R0, of 1.7 overall (range 1.5–1.8 depending on country), is within the known range for COVID-19 of 0.41–2.39,29 and consistent with that from an earlier model.28 This suggests that while the rate of infection is slower, the outbreak would continue until R0 drops to <1.
The probabilities used were corroborated in the sensitivity analysis, where the ones with the most uncertainty of evidence were shown to still predict the study results, even when extensively varied. The range of asymptomatic cases for which the results are sensitive (74–89%, or 84.4–93.4% of asymptomatic/mild persons) is plausible given the data emerging from the seroepidemiological studies. This could also contribute (together with possible low reporting) to the very low numbers of cases seen within the WHO African Region. At the time of writing, 25 of the 47 countries in the region had fewer than 100 cases.
The RoE is also aligned with what is seen with SARS-CoV-2 in the region. The top 10 countries with the highest RoE are seven small states, where transmission is easier due to size, together with South Africa, Algeria and Cameroon. As of 30 April, the top three countries with the most cases were South Africa (5350), Algeria (3848) and Cameroon (1806).
The model predicts fewer deaths primarily because of the effects of the RoE, reducing overall cases in the first year. The correction made for regional vulnerabilities also further reduces the proportion of severe/critical disease observed in the African Region. The effect of the vulnerability correction is attributable to a younger population and the region’s similarity in non-communicable disease burden with other affected countries. High access and use of interventions targeted at chronic communicable diseases also reduce the potential impact of these factors. The region will have fewer deaths, but occurring more in relatively younger age groups, among people previously considered healthy, due to undiagnosed non-communicable diseases. We already see this picture emerging based on the characteristics of persons affected in the African Region compared with other regions.
The case fatality for COVID-19 is still difficult to estimate globally, as countries are using different testing strategies for identification of cases and have different RoE. However, the infection mortality rate estimate of 0.06% is consistent with the current expectations of it being <0.1%.42 We expect the regional infection mortality rate to be lower because of the vulnerability index. However, the case fatality rate, particularly when based on deaths among known cases with moderate to critical symptoms, may be high due to weaker mitigation measures, especially pertaining to care of severe and critically ill persons.
Impact on health system capacity
Deaths due to COVID-19 will not significantly change crude death rates; the regional crude death rate is 8.9/1000 persons.69 It will, however, lead to more deaths from other conditions due to changing health seeking behaviours among the population, who may perceive health service delivery areas as hotspots of infection, diversion of time, money and other health resources and/or overwhelmed health services unable to cope.70–72 Predicted hospitalisations would lead to an additional 69 550 600 bed days assuming 15 day admissions, translating to 60 bed days per 1000 persons, ranging from 284 in the Seychelles to 2 in Niger. These hospitalisations would be widespread, with some occurring in areas where access to services is poor and inaccessible to the most disadvantaged.
The creation of special COVID-19 service areas to reduce nosocomial infections would be difficult to establish and sustain in the African Region. Facilities would need to be effectively prepared with diagnostic and functional triage systems, many of which are currently ineffective. Tertiary care capacity is also limited, due to an historical focus on provision of a limited set of primary care mother and child interventions, at the expense of basic emergency interventions.73 Given the low coverage of service provision units and death reporting, coupled with diagnostic challenges, many cases may also go undocumented.
These system capacity challenges highlight the need to ensure the success of the containment measures to avoid the need for mitigation measures that, despite the relatively fewer cases expected in the region, will be difficult to institute. These containment measures, specifically physical distancing, should be implemented in the context of Africa’s unique socioeconomic challenges and limited economic safety nets.74 They nonetheless are already appearing to be effective, with cases stagnating/reducing in some countries, such as South Africa, despite its high RoE, at the time of writing.
Challenges in building the model
Effective predictive modelling relies on the development of assumptions and availability of quality data. Both presented challenges for the development of a model useful for countries in the region. Innovative ways of overcoming these challenges therefore had to be used and have been presented through this paper. The region lacks data in many areas, relying on values modelled with different assumptions that make it difficult to use for this purpose. As a result, selection of indicators to be used was not only based on the indicators’ appropriateness, but also the availability of reliable data across the countries. Different indicators were tested, especially in the generation of the RoE and the regional vulnerability factor, to arrive at those used. A focus on capacity for locally generated data is urgently needed for countries in the region.
Conclusion
The picture we have modelled is based on a scenario of widespread and sustained community transmission of SARS-CoV-2 in each country of the WHO African Region. It introduces unique ways of overcoming traditional challenges with modelling in the region, specifically in improving accuracy in the number of infections and capturing the effect of a different disease burden. The model predicts that the region’s unique socioecological context is contributing to reductions in the number of cases, with infections spread over a longer time period. Its specific vulnerabilities are also changing the numbers, age focus and nature of events arising from infection in most countries. Moving forward, more analysis and research, particularly around refinement of the RoE and vulnerability adjustments within each country, would allow for further improvement in estimates.
References
Supplementary materials
Footnotes
Handling editor Seye Abimbola
Twitter @karamagih
Contributors This analysis is a result of multidisciplinary, cross team effort comprising experts of the World Health Organization Regional Office for Africa with skills in epidemiology, statistics, public health, emergency response and health systems. MRM conceived the study and JWC coordinated its execution and internal review. HCK led the technical team and the health systems related analytics. JAA and HK led the statistical analytics. BD led the data consolidation, together with AS and RT-O. BI, MY and ZY led the emergency response inputs, while PT and HCK led the health systems inputs. AT, FZ and FCK led the epidemiology information and carried out the overall technical review.
Funding The authors have not declared a specific grant for this research from any funding agency in the public, commercial or not-for-profit sectors.
Map disclaimer The depiction of boundaries on this map does not imply the expression of any opinion whatsoever on the part of BMJ (or any member of its group) concerning the legal status of any country, territory, jurisdiction or area, or of its authorities. This map is provided without any warranty of any kind, either express or implied.
Competing interests None declared.
Patient and public involvement Patients and/or the public were not involved in the design, conduct, reporting or dissemination plans of this research.
Patient consent for publication Not required.
Provenance and peer review Not commissioned; internally peer reviewed.
Data availability statement Data are available upon request. Data used in the study are from publicly available and verified databases from the United Nations agencies depending on the indicator. The tool consolidating and analysing these data is publicly available with all countries of the World Health Organization African Region and upon request.