Article Text

Abstract
Objective Mild cognitive impairment and dementia are common non-motor features of Parkinson's disease (PD). The aim of this study was to characterise grey matter changes associated with clearly defined stages of cognitive impairment in PD using structural MRI.
Methods 96 PD subjects were classified using detailed cognitive testing as PD with normal cognition (PD-N, n=57), PD with mild cognitive impairment (PD-MCI, n=23) or PD with dementia (PD-D, n=16); 34 controls matched for mean age and sex ratio also participated. Grey matter volume differences were evaluated using voxel based morphometry of grey matter segments derived from T1 weighted 3 T MRI, and multiple linear regression assessed the relationship between cognitive and motor impairments and grey matter concentration.
Results Compared with controls, no grey matter differences were found in PD-N. PD-MCI showed limited grey matter atrophy in the temporal, parietal and frontal cortex as well as the bilateral caudal hippocampus, amygdala and right putamen. PD-D subjects exhibited far more extensive atrophy in regions involved in PD-MCI but also had reduced grey matter volume in other large areas of the temporal lobe (including the parahippocampi), the intracalcarine and lingual gyri, posterior cingulate gyrus, frontal regions and bilateral caudate. Grey matter loss in PD correlated with global cognitive score but not motor impairment in most of these regions.
Interpretation Marked grey matter atrophy occurs in PD with dementia but far less extensive changes are evident in PD-MCI. Some grey matter atrophy precedes the development of dementia but may be accelerated once frank dementia begins.
Statistics from Altmetric.com
Introduction
Cognitive impairment is common in Parkinson's disease (PD), with a cumulative dementia prevalence of 75–90%.1 Those meeting criteria for mild cognitive impairment (PD-MCI; ie, no dementia) may be at increased risk for dementia and thus targets for early intervention.2 Contributions to cognitive decline in PD include alpha-synuclein and Alzheimer's pathology, and neurotransmitter (dopaminergic, cholinergic) changes, which can be associated with brain atrophy.3 Structural brain imaging of PD subjects may provide a robust in vivo method of identifying macroscopic cerebral atrophy associated with cognitive decline.
While relatively consistent evidence points to grey matter atrophy in PD with dementia (PD-D), the presence and extent of similar changes found in PD without dementia is uncertain. Investigations employing structural MRI analysed by visual inspection, region of interest and whole brain voxel based morphometry (VBM) methods have reported grey matter atrophy associated with dementia in PD in the basal ganglia, medial temporal and limbic areas, as well as other cortical regions.4–8 Some studies defining a single ‘non-dementia’ group of PD subjects have reported atrophy in the medial temporal lobe,4 7–10 amygdala,7 frontal regions6 10 and cerebellum.11 In contradistinction, others have found no significant atrophy in PD without dementia.12–15 There is, however, general agreement in the value of identifying the stage of mild cognitive impairment before the onset of functional impairments that characterise dementia.2 16–18 An accurate characterisation of PD-MCI may have a substantial effect on the prognosis of individuals and the outcomes of treatments aimed at delaying or preventing dementia in PD. The possible inclusion of participants with PD-MCI within a single ‘non-dementia’ group may be a confound in imaging studies.
The separation of non-demented PD subjects into PD-N and PD-MCI in recent investigations has shown promise in identifying underlying structural brain changes prior to dementia in PD. However, small sample size and lack of consistent criteria for defining cognitive impairment complicate the interpretation of these structural imaging results and perhaps explain inconsistent findings. Some studies have identified grey matter atrophy in PD-MCI patients in the temporal lobe (including the hippocampus and parahippocampus), frontal regions and cerebellum, relative to healthy individuals or PD patients without cognitive impairment.10 19 20 In contrast, other studies have reported either no or unreliable grey matter changes in PD-MCI compared with controls or PD-N.5 21 22 Thus far, only two studies have directly compared PD-N, PD-MCI and PD-D groups,5 21 with both identifying significant atrophy in PD-D, a trend towards atrophy in PD-MCI and no atrophy in PD-N.
The proportion of non-dementia cases classified as MCI can vary markedly with different criteria, and thus clearly separated and well defined groups of PD-N, PD-MCI and PD-D are needed to elucidate the relationship between cognitive impairment and atrophic change across the full spectrum of cognitive impairment in PD.16–18 In addition to differences in MCI criteria, relatively restricted evaluation of the extent and range of cognitive impairments has been common in previous structural imaging studies. We therefore assessed a large group of PD patients using criteria based on detailed neuropsychological testing and functional evaluation that results in a relatively small overlap in terms of global cognitive performance between PD-N, PD-MCI and PD-D.18
Methods
Subjects
A convenience sample of 104 participants meeting the UK Parkinson's Disease Society's criteria for idiopathic PD23 was recruited from the Movement Disorders Clinic at the Van der Veer Institute for Parkinson's and Brain Research, Christchurch, New Zealand, from May 2007 to March 2010. Volunteers representative of the full spectrum of cognitive status in PD were invited to participate. The control group comprised 39 healthy volunteers matched to the whole PD sample for mean age, years of education and sex ratio. Exclusion criteria included atypical parkinsonian disorder or other CNS disorder; previous history of other neurological conditions including moderate or severe head injury, stroke, learning disability or vascular dementia; and major medical illness in the previous 6 months. Neuroradiological screening excluded five PD and two control participants due to: moderate or severe white matter disease (one control, four PD), marked cerebral atrophy (one PD) and cerebellar infarcts (one control). A further three PD subjects were excluded due to motion corrupted MR images. Demographic, clinical and cognitive measures of the excluded PD subjects did not differ significantly from those of the whole PD group. Three control subjects met criteria for mild cognitive impairment and were excluded. Analyses were conducted on the remaining 96 PD and 34 control subjects. This sample provides a reasonable representation of the local community of PD patients, including the full spectrum of cognitive impairments, as our Movement Disorders Clinic assesses the majority of patients in the region. All subjects gave written consent, with additional consent from a significant other when appropriate. The Upper South Regional Ethics Committee of the New Zealand Ministry of Health approved the study.
Diagnostic criteria and assessment
Disease severity was assessed using the Unified Parkinson's Disease Rating Scale (UPDRS: part III, motor).24 Comprehensive neuropsychological testing classified PD patients as either cognitively normal (PD-N; n=57), with mild cognitive impairment (PD-MCI; n=23) or with dementia (PD-D; n=16).18 Dementia diagnosis was based on the Movement Disorders (MDS) Task Force criteria.25 PD-MCI cases had unimpaired functional activities of daily living but scored 1.5 SDs or more below normative data on at least two measures within at least one of the four MDS Task Force cognitive domains (executive function; memory; attention, working memory and speed of processing; and visuospatial/visuoperceptual function).18 The presence of memory complaint as volunteered by the participants was not used as part of the MCI criteria as this may not be a critical impairment in PD,25 and because objective measures of memory impairment were employed. The neuropsychological battery included: executive function—letter, action and category fluency, category switching, Trails B and Stroop interference; attention, working memory and speed of processing—digits forward and backward, digit ordering, map search, Stroop colour and word reading, and Trails A; learning and memory—California Verbal Learning Test-short form short and long delay recall, and the Rey–Osterrieth complex figure short and long delay; and visuospatial/visuoperceptual function—judgement of line orientation, fragmented letters and Rey–Osterrieth complex figure copy.
While the proportion of PD patients classified as PD-MCI depends on the specific criteria used,18 the relative proportion of PD-N and PD-MCI are within the range expected2; the proportion of PD-D reflects the involvement of patients at the earlier stages of dementia. Our MCI criteria provided clear separation between patients with relatively normal cognition (PD-N), PD-MCI and PD-D (table 1), unlike, for example, a criterion of one measure at −1.5 SD within one domain.18 Global performance for each participant was expressed by an aggregate z score obtained by averaging the standardised scores within each cognitive domain and then taking the mean of these four domain scores. Participants completed the Geriatric Depression Scale and the significant other was interviewed for Neuropsychiatric Inventory; one PD-MCI and five PD-D patients experienced hallucinations, as indicated by the Neuropsychiatric Inventory. Brief measures of global cognitive status were also administered but not used to specify group membership (standardised Mini-Mental State Examination26; Montreal Cognitive Assessment27). All subjects classified as PD-D using the MDS Task Force criteria also showed decreased global mental status judged by the Montreal Cognitive Assessment (median 17; range 10–23). Thirty-nine PD subjects had not commenced anti-parkinsonian medication—that is, were drug naïve. The remaining 57 PD participants were assessed and imaged on medication, without any disruption to their usual drug regimen.
Demographic, clinical and global imaging details of each group
MRI acquisition
Structural MR images were acquired with a T1 weighted, three-dimensional spoiled gradient echo (SPGR) acquisition (TE/TR=2.8/6.6 ms, TI=400 ms, flip angle=15°, acquisition matrix=256×256×170, FOV=250 mm, slice thickness=1 mm, voxel size=0.98×0.98×1.0 mm3) on a 3 T General Electric HDx scanner with an eight channel head coil. Subjects were instructed to remain as still as possible during scanning.
MRI data preprocessing
We used SPM5 (Wellcome Department of Cognitive Neurology, University College London, UK) in Matlab 7.6.0 (R2008a, Mathworks, Massachusetts, USA) to perform unified segmentation and normalisation of each T1 weighted SPGR image. Unified segmentation performs tissue classification by warping the prior images to the study images. PD and control samples under investigation were substantially older than the group of brains used to create the priors provided with SPM5. To facilitate more accurate segmentation/normalisation and to minimise any possible bias associated with age, tissue priors from a probabilistic elderly brain template were used.28 Segmented normalised grey matter maps (at a resolution of 1 mm3 isotropic) were modulated; this procedure preserves the actual volume of a given voxel by adjusting the signal proportional to the amount of warping. Lastly, the images were smoothed to improve signal to noise, to ensure that the assumptions underlying Gaussian random fields theory were met and to account for any spatial normalisation imperfections.29 Smoothing kernels utilised in previous PD voxel based studies range from 4 to 12 mm.5 6 11 Smoothing the grey matter segments causes the residuals to approach a normal distribution, an assumption required for VBM.29 Using the SPMd toolbox,30 we found that 25.1% (at 8 mm smoothing), 22.5% (at 10 mm) and 21.8% (at 12 mm) of voxels within the brain exhibited a non-normal distribution of residuals. Images with 10 mm smoothing were utilised for all comparisons because they had fewer voxels violating the assumption of normally distributed residuals and maintained a reasonable degree of spatial resolution. Manually traced intracranial volume (ICV) on the axial view of the un-normalised SPGR images was used as a covariate in subsequent analyses.
Demographic and imaging analyses
Clinical and cognitive measures and global grey matter volume divided by ICV were compared across the groups (controls and PD cognitive groups) in Matlab using one way ANOVAs or Kruskal–Wallis tests (when a non-parametric test was required). Regional group differences in grey matter concentration were evaluated by VBM.29 Smoothed, modulated and normalised grey matter images were analysed by ANCOVA in SPM5, to assess group differences (control/PD-N/PD-MCI/PD-D), with age, sex, years of education and ICV as covariates. Pairwise comparisons (one tailed t tests) were used to evaluate grey matter differences between controls and individual PD cognitive groups (controls >PD-N, PD-MCI, PD-D, respectively). A second ANCOVA restricted to only the PD groups was used to add motor impairment (UPDRS-III) as a covariate. The subsequent comparisons were: PD-N >PD-MCI, PD-N >PD-D and PD-MCI >PD-D.
Multiple regression assessed the relationship between grey matter concentration and continuous measures of cognition (aggregate z score, derived from an average of four cognitive domain scores) and motor impairment (UPDRS-III) in the PD group, with age, sex, years of education and ICV as covariates. We hypothesised a positive correlation between voxel-wise grey matter concentration and cognitive z score, and a negative correlation with motor impairment (UPDRS-III). Grey matter atrophy between drug naïve PD-N (n=35) and PD-N receiving anti-parkinsonian medication (n=24) was also examined. All results were corrected for multiple comparisons using false discovery rate (FDR corrected, p<0.05).
Results
Demographic and clinical details, and global imaging values for each group are presented in table 1. A significant difference between groups was found for grey matter volumes (corrected for ICV; F3,126=11.1; p <0.001), with a modest reduction in PD-MCI and more atrophy in PD-D (Tukey's HSD post hoc comparisons). Receiver operating characteristic analysis of aggregate z score across the four cognitive domains produced an area under the curve of 0.98 for the PD-N versus PD-MCI groups; for PD-MCI versus PD-D, 0.95; and PD-N versus PD-D, 1.0.
Voxel based morphometry
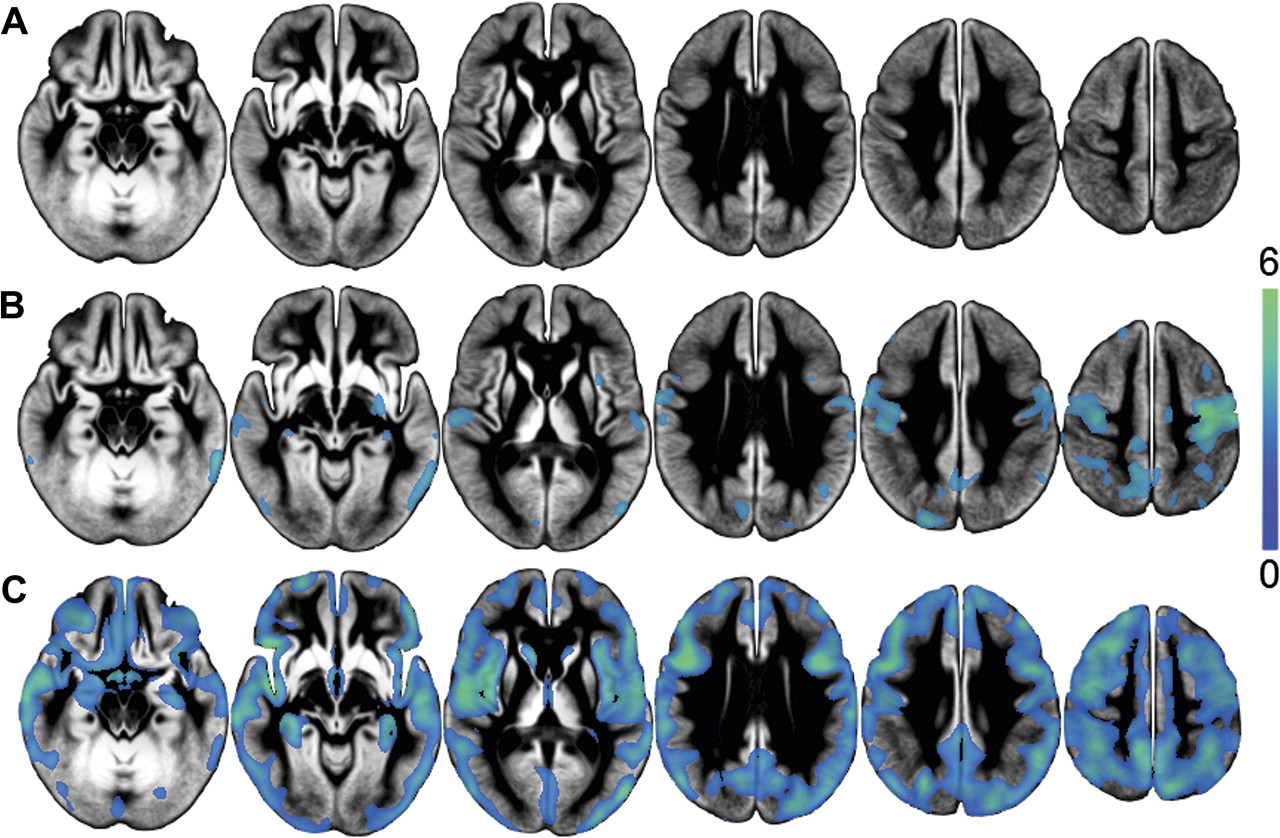
The PD-N group showed no significant atrophy compared with controls (figure 1A; FDR, p<0.05). In the PD-MCI group, reduced grey matter concentration was clearly evident in bilateral pre- and post-central gyri, with relatively restricted changes evident in the precuneus, superior and middle frontal gyri, superior lateral occipital cortex, temporal regions (including right Heschl's gyri, right insula, superior and inferior temporal gyri, and the planum temporale), as well as the bilateral amygdala, caudal hippocampus and right putamen (figure 1B). PD-D subjects exhibited far more extensive grey matter atrophy in the regions involved in PD-MCI but also had reduced grey matter concentration in other large areas of the temporal lobe, intracalcarine and lingual gyri, posterior cingulate gyrus, prefrontal and frontal regions, and bilateral caudate and parahippocampi (figure 1C).

Regions displaying any areas of significant grey matter atrophy in patients with (A) Parkinson's disease with normal cognition (PD-N), (B) Parkinson's disease with mild cognitive impairment (PD-MCI) and (C) Parkinson's disease with dementia (PD-D), relative to controls, displayed on the study specific average grey matter image in neurological convention (left on image is left of brain). Significant clusters (false discovery rate (FDR) corrected, p<0.05) indicate atrophy in PD-MCI (corrected t value >2.84) and PD-D (t >2.06). Colour bar displays t statistic scale. Slices displayed are z=(−18, −8, 7, 27, 37, 52). In PD-MCI, amygdala atrophy occurred between z=−15 and z=−10 (not shown on figure 1B).
The UPDRS-III was used as a covariate for comparisons across the PD groups to determine the degree to which grey matter differences were specific to cognitive changes. No significant areas of atrophy occurred in PD-MCI (figure 2A; FDR, p<0.05) in comparison with PD-N. When compared with PD-N, the PD-D group exhibited less extensive volume reduction in many of the same regions that had already been identified in the comparison with controls (figure 2B). The intermediate nature of the PD-MCI group was apparent from the finding that this group also showed no significant grey matter differences by comparison with the PD-D group (not shown). There were no grey matter differences between drug naïve PD-N and those PD-N on medication.

Blue–green colour indicates any areas of significant atrophy in (A) Parkinson's disease with mild cognitive impairment (PD-MCI) and (B) Parkinson's disease with dementia (PD-D) relative to Parkinson's disease with normal cognition (PD-N) (false discovery rate (FDR), p<0.05), after covarying for Unified Parkinson's Disease Rating Scale part III, age, sex, years of education and intracranial volume. Only PD-D exhibited significant atrophy, with reduced volume in cortical regions and the right caudate (t >2.36).
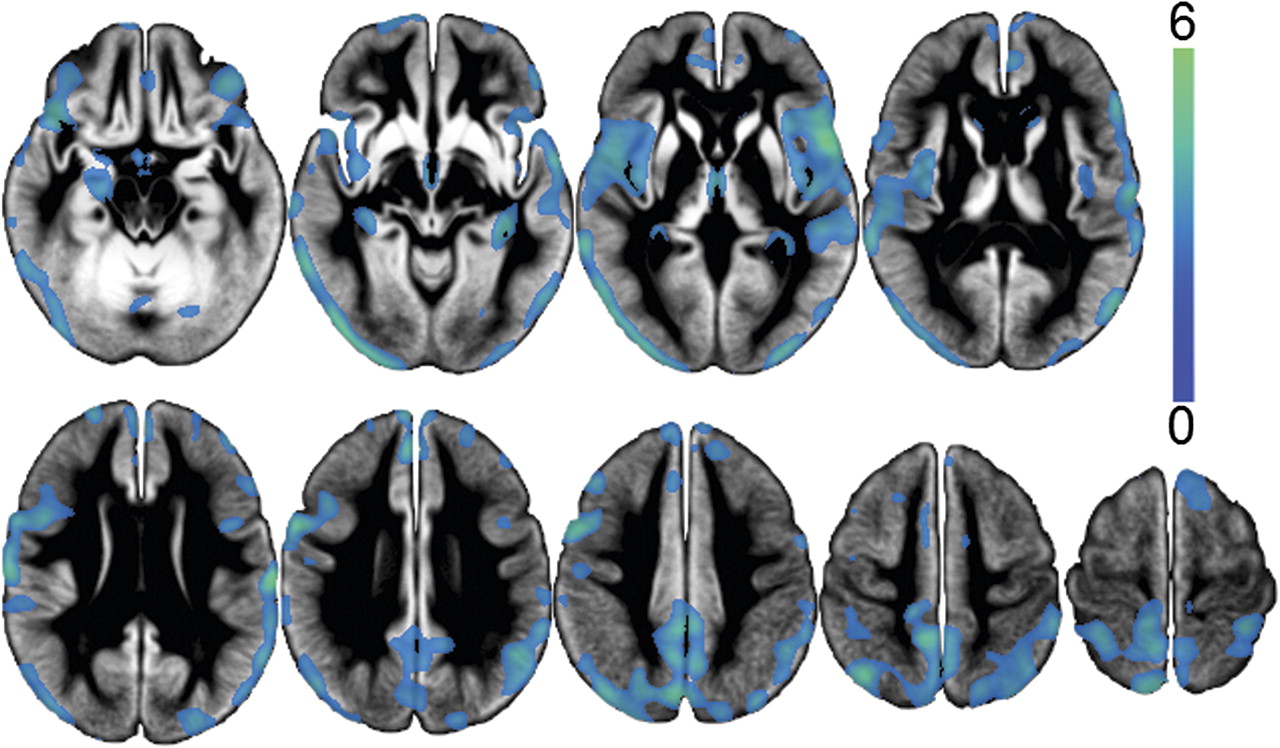
There was a significant correlation between aggregate cognitive z score in the PD group and cerebral atrophy in the bilateral posterior cingulate and precuneus cortex, superior parietal lobule, lateral occipital cortex, superior, middle and inferior frontal gyri, precentral gyri, insula cortex, Heschl's gyri, central opercular cortex, superior and middle temporal gyri, hippocampi, parahippocampi, medial thalamic region and left amygdala (figure 3; FDR, p<0.05). Correlation between grey matter concentration and UPDRS-III (covarying for cognitive score) was observed only at a relaxed statistical threshold of p<0.001 uncorrected, and then only in the right middle frontal gyrus (not shown).
Clusters represent areas where a significant association exists between atrophy and cognitive z score in the Parkinson's disease (PD) group (false discovery rate (FDR), p<0.05, t >2.54), after covarying for motor impairment, age, sex, years of education and intracranial volume. Significant association was primarily limited to the cortex. The first slice displayed is z=−18 with each subsequent slice 10 mm superior.
Normality of residuals
Normality of voxel residuals is assumed for GLM voxel based analyses. Supplementary figure 1 (available online only) shows the spatial distribution of voxels with non-normal residuals overlaid on areas of significant PD-D atrophy relative to controls, using a 10 mm kernel. There was little overlap with regions of significant atrophy; most non-Gaussian voxels occurred in the cerebellum, middle cingulate cortex and precentral gyrus. Hence the conclusions derived from the GLM voxel based analyses appear to be robust.
Discussion
Within a large sample of PD patients covering the full spectrum of cognitive impairment, which included classification as PD-N, PD-MCI and PD-D using comprehensive neuropsychological and functional assessment, PD-D exhibited widespread grey matter atrophy relative to controls, PD-MCI showed limited atrophy and the PD group with relatively preserved cognition (PD-N) had no detectable atrophy. We also identified a significant association between cognition (aggregate cognitive z score) and grey matter atrophy in PD in a number of cortical areas. There was no such relationship with motor severity.
Our findings of cortical and subcortical atrophy in PD-D relative to both controls and PD-N are consistent with, but generally more extensive than, previous findings.4–7 These earlier studies employed the general dementia criteria found in the Diagnostic and Statistical Manual of Mental Disorders IV,31 which are less sensitive than the MDS Task Force criteria for PD-D.32 To our knowledge, ours is the only VBM study to adhere to the recent Movement Disorders PD specific dementia criteria.25
Unlike the current study, three previous volumetric studies investigating PD-MCI5 21 22 have reported no significant grey matter atrophy relative to controls but this disparity may reflect both the smaller sample sizes and their use of different criteria to establish cognitive impairment. The PD-MCI subjects described by Dalaker and colleagues22 were newly diagnosed, drug naïve and were subject to less stringent classification criteria (1.5 SD below norms in one measure of verbal memory, attention–executive function or visuospatial function); the authors mention that these patients were less cognitively impaired than in previous studies. Using the same criteria, the same group demonstrated a trend towards atrophy in the temporal and frontal regions in more established patients,5 or only a non-significant trend towards caudate atrophy in PD-MCI relative to controls.21 Atrophy in the frontal and temporal regions was identified by Meyer and colleagues20 who used MCI criteria requiring subjective memory or cognitive complaint, unimpaired activities of daily living and a score of <42 on the combined Mini-Mental State Examination and Cognitive Capacity Screening Examination. Two further investigations identified primarily medial temporal but also frontal, occipital and cerebellar atrophy in small samples of non-demented PD patients with cognitive impairment, not specifically defined as MCI.10 19 We suggest that mild grey matter degeneration might signal a critical point in the early stages of progression towards dementia, at least in PD-MCI patients who satisfy more conservative criteria (1.5 SD below normative data on at least two measures in at least one of the four MDS cognitive domains). More marked changes in grey matter concentration seem to reflect progression once frank dementia is apparent.
We detected no significant loss of grey matter in the PD-N group relative to controls, paralleling previous studies that specifically characterised a PD group with normal cognition.5 21 22 The exception is Nishio et al,10 who described atrophy in the frontal, perisylvian and occipital regions in those with a Clinical Dementia Rating of 0. However, we have found that Clinical Dementia Rating scores may provide relatively poor discrimination between PD-N and PD-MCI groups.18
MRI studies of ‘non-demented’ PD, wherein those with MCI were not necessarily distinguished from those with normal cognition, have reported atrophy in the medial temporal lobes, amygdala, frontal regions and cerebellum.4 6–9 11 In contradistinction, others have reported no significant MRI detectable atrophy in non-demented PD populations.12–15 These variable findings are likely due to the cognitive heterogeneity in these ‘non-demented’ groups whereby patients with neuropsychological deficits consistent with a classification of MCI may or may not have been included with those whose cognition fell within the normal spectrum.
To date, reports of the association between grey matter atrophy and neuropsychological deficits in PD have focused on the hippocampus and amygdala in particular, as well as limbic areas and the temporal cortex.7 9 11 22 The association between cognitive z score and grey matter atrophy identified in the present study was more distributed and included the posterior parietal (precuneus), lateral occipital, orbito-frontal, dorsolateral prefrontal cortex and amygdala. Our use of an aggregate, neuropsychological derived z score derived from 20 measures in 14 tests across the four cognitive domains provided a comprehensive assessment of cognitive status. The use of this more sensitive cognitive measure may have facilitated the identification of more extensive cerebral atrophy in PD related cognitive decline in the current study.
Cognitive impairment in PD is most likely due to a combination of both functional (eg, neurotransmitter and other biochemical) and structural (eg, neuronal and synaptic) loss.3 There is a correlation between cognition and density of Lewy bodies and neurites in the hippocampus and amygdala in PD.33 Additionally, parahippocampal Lewy body density is greater in PD-D than in non-demented PD.34 Braak stage, defined by the accumulation of Lewy bodies and neurites in a series of ascending brain regions, also correlates with level of cognitive impairment,35 suggesting that alpha-synuclein accumulation may play an important role in the development of atrophy and dementia in PD. A recent positron emission tomography study36 has identified significantly more cholinergic dysfunction in PD-D than in PD without dementia, in widespread cortical areas that coincide with regions identified as atrophic in our study. The convergence of these findings suggests that cholinergic dysfunction and atrophy may parallel each other in the development of dementia in PD.
The distribution of grey matter atrophy in PD-D in the present study coincides with regions of hypoperfusion described by others in relation to PD related dementia (eg, Firbank and colleagues37). The current study indicates relatively little grey matter loss in PD-MCI. However, evidence exists for both unchanged38 and decreased metabolism39 in PD-MCI. It therefore remains a pertinent question whether the relationship between grey matter atrophy and hypoperfusion/hypometabolism present in PD-D holds in PD-MCI.
One longitudinal MRI investigation identified decreased brain volume over 12 months in PD-D compared with non-demented PD and controls but no significant association between rate of atrophy and cognitive decline.40 Their negative finding may be due to a relatively small PD-D sample size (n=13), the brief inter-scan interval and the use of the relatively insensitive Mini-Mental State Examination. However, a second longitudinal study reported grey matter volume loss over 25 months in both PD-D and non-dementia PD41 and, most recently, Camicioli and colleagues42 reported ventricular enlargement and global grey matter atrophy over a 36 month period in PD patients showing cognitive decline. These longitudinal observations are consistent with the cross sectional data reported in the current study. It will, however, be pertinent to follow the present cohort over time to look for progression changes as cognition declines further.
VBM is a powerful technique for unbiased hypothesis testing across the whole brain but has underlying assumptions.30 The VBM investigations cited herein did not specify the distribution of the residuals of the general linear model. Although 22.5% of voxels in the present study did not conform to model assumptions (with the 10 mm smoothing kernel), we demonstrated minimal overlap with voxels exhibiting significant atrophy. That the only substantial overlap occurred in the left orbito-frontal area—suggesting that the apparent atrophy in this single region may be spurious—indicates that our findings of slight atrophy in PD-MCI and widespread atrophy in PD-D are reliable.
In summary, in a well characterised PD dementia group (PD-D), there was widespread grey matter atrophy that was more extensive than reported in most previous studies. A PD group with mild cognitive impairment (PD-MCI) also showed atrophy, albeit to a lesser extent, while no atrophy was detected in the PD group with normal cognition. Detailed neuropsychological testing permitted classification into the separate cognitive groups (normal cognition, MCI and dementia) and supports our conclusion that cerebral atrophy does not necessarily accompany PD per se. Longitudinal follow-up of this cohort will be important to clarify the utility of structural MRI in describing and predicting PD related cognitive decline.
Acknowledgments
We thank Ms Saskia van Stockum for assistance in the preparation of the figures.
References
Supplementary materials
Supplementary Data
This web only file has been produced by the BMJ Publishing Group from an electronic file supplied by the author(s) and has not been edited for content.
Files in this Data Supplement:
- Download Supplementary Data (PDF) - Manuscript file of format pdf
Footnotes
Funding This work was supported by the Neurological Foundation of New Zealand, the Canterbury Medical Research Foundation and the Neurology Trust.
Competing interests None.
Ethics approval The study was approved by the Upper South Regional Ethics Committee of the New Zealand Ministry of Health.
Provenance and peer review Not commissioned; externally peer reviewed.