Article Text

Abstract
Objectives To estimate the incidence and prevalence of multiple sclerosis (MS) by age and describe secular trends and geographic variations within the UK over the 20-year period between 1990 and 2010 and hence to provide updated information on the impact of MS throughout the UK.
Design A descriptive study.
Setting The study was carried out in the General Practice Research Database (GPRD), a primary care database representative of the UK population.
Main outcome measures Incidence and prevalence of MS per 100 000 population. Secular and geographical trends in incidence and prevalence of MS.
Results The prevalence of MS recorded in GPRD increased by about 2.4% per year (95% CI 2.3% to 2.6%) reaching 285.8 per 100 000 in women (95% CI 278.7 to 293.1) and 113.1 per 100 000 in men (95% CI 108.6 to 117.7) by 2010. There was a consistent downward trend in incidence of MS reaching 11.52 per 100 000/year (95% CI 10.96 to 12.11) in women and 4.84 per 100 000/year (95% CI 4.54 to 5.16) in men by 2010. Peak incidence occurred between ages 40 and 50 years and maximum prevalence between ages 55 and 60 years. Women accounted for 72% of prevalent and 71% of incident cases. Scotland had the highest incidence and prevalence rates in the UK.
Conclusions We estimate that 126 669 people were living with MS in the UK in 2010 (203.4 per 100 000 population) and that 6003 new cases were diagnosed that year (9.64 per 100 000/year). There is an increasing population living longer with MS, which has important implications for resource allocation for MS in the UK.
- Multiple Sclerosis
- Epidemiology
This is an Open Access article distributed in accordance with the Creative Commons Attribution Non Commercial (CC BY-NC 3.0) license, which permits others to distribute, remix, adapt, build upon this work non-commercially, and license their derivative works on different terms, provided the original work is properly cited and the use is non-commercial. See: http://creativecommons.org/licenses/by-nc/3.0/
Statistics from Altmetric.com
Background
Individuals with multiple sclerosis (MS) can experience high levels of disability and impaired quality of life for prolonged periods. The costs of the disease in the UK, including health and social care and productivity losses, are high and correlate with disease severity.1 ,2 It is important to have accurate and up to date information on the prevalence of MS in the UK in order to understand the impact of this disease and to ensure that adequate resources are provided nationally and regionally for people affected by MS. National studies have been carried out in the past, but recent data are lacking.3–6 To address this need, work on compiling an online national MS register began in 2011 (http://www.ukmsregister.org). A dedicated Scottish National MS Register for incident MS cases was established in 2010.7
The General Practice Research Database (GPRD) is a longitudinal database containing details of patients’ demographics, medical diagnoses, referrals to consultants and hospitals, and primary care prescriptions from a representative sample of general practices in the UK.8 Two previous studies have used the GPRD to study the epidemiology of MS in the UK, the first reporting for the period 1993–2000.6 A more recent study investigated the prevalence of MS between 2000 and 2008 stratified by age, sex, geographical region and calendar year.7
Methods
Study design
This was a population-based study using the GPRD. The study protocol was reviewed and approved by the Independent Scientific Advisory Committee (ISAC) of GPRD. No further ethical approval is required for studies using GPRD that do not involve patient contact.
Hypothesis
This was a descriptive study. Its aim was to estimate the incidence and prevalence of MS by age in men and women and to describe secular trends and geographic variations within the UK between 1990 and 2010.
Study population
The study population included all patients with acceptable data who contributed follow-up time to the database after 1990. GPRD defines a patient's data as unacceptable if there is evidence of poor data recording, non-contiguous follow-up or if their registration with the practice is temporary. Eligible follow-up time for each patient started with their practice's ‘up-to-standard’ (UTS) date or the patient's date of registration with the practice if this was later. GPRD applies standard criteria to define the date at which any individual practice's data become ‘UTS’ to ensure quality of data.
The first 2 years of follow-up time for each patient were treated as a screening period, and incidence and prevalence rates were calculated for follow-up time after the screening period. We chose this screening period because preliminary analyses showed that incidence rates were high in the first 2 years of follow-up and prevalence rates were low, particularly in the first year. This is probably due to inclusion of patients with prevalent disease whose initial diagnosis pre-dated the computerisation of their practice's records.
The follow-up period ended with the earlier of either their transfer-out date or their practice's last data collection date.
Outcomes
For GPRD, Read codes for confirmed diagnoses of MS (ie, codes beginning F20) were used. For Hospital Episode Statistics (HES) the International Classification of Diseases (ICD10) code for MS (G35) was used. Incident cases were defined as the first occurrence of a code for MS if it occurred after the 2-year screening period.
Statistical analysis
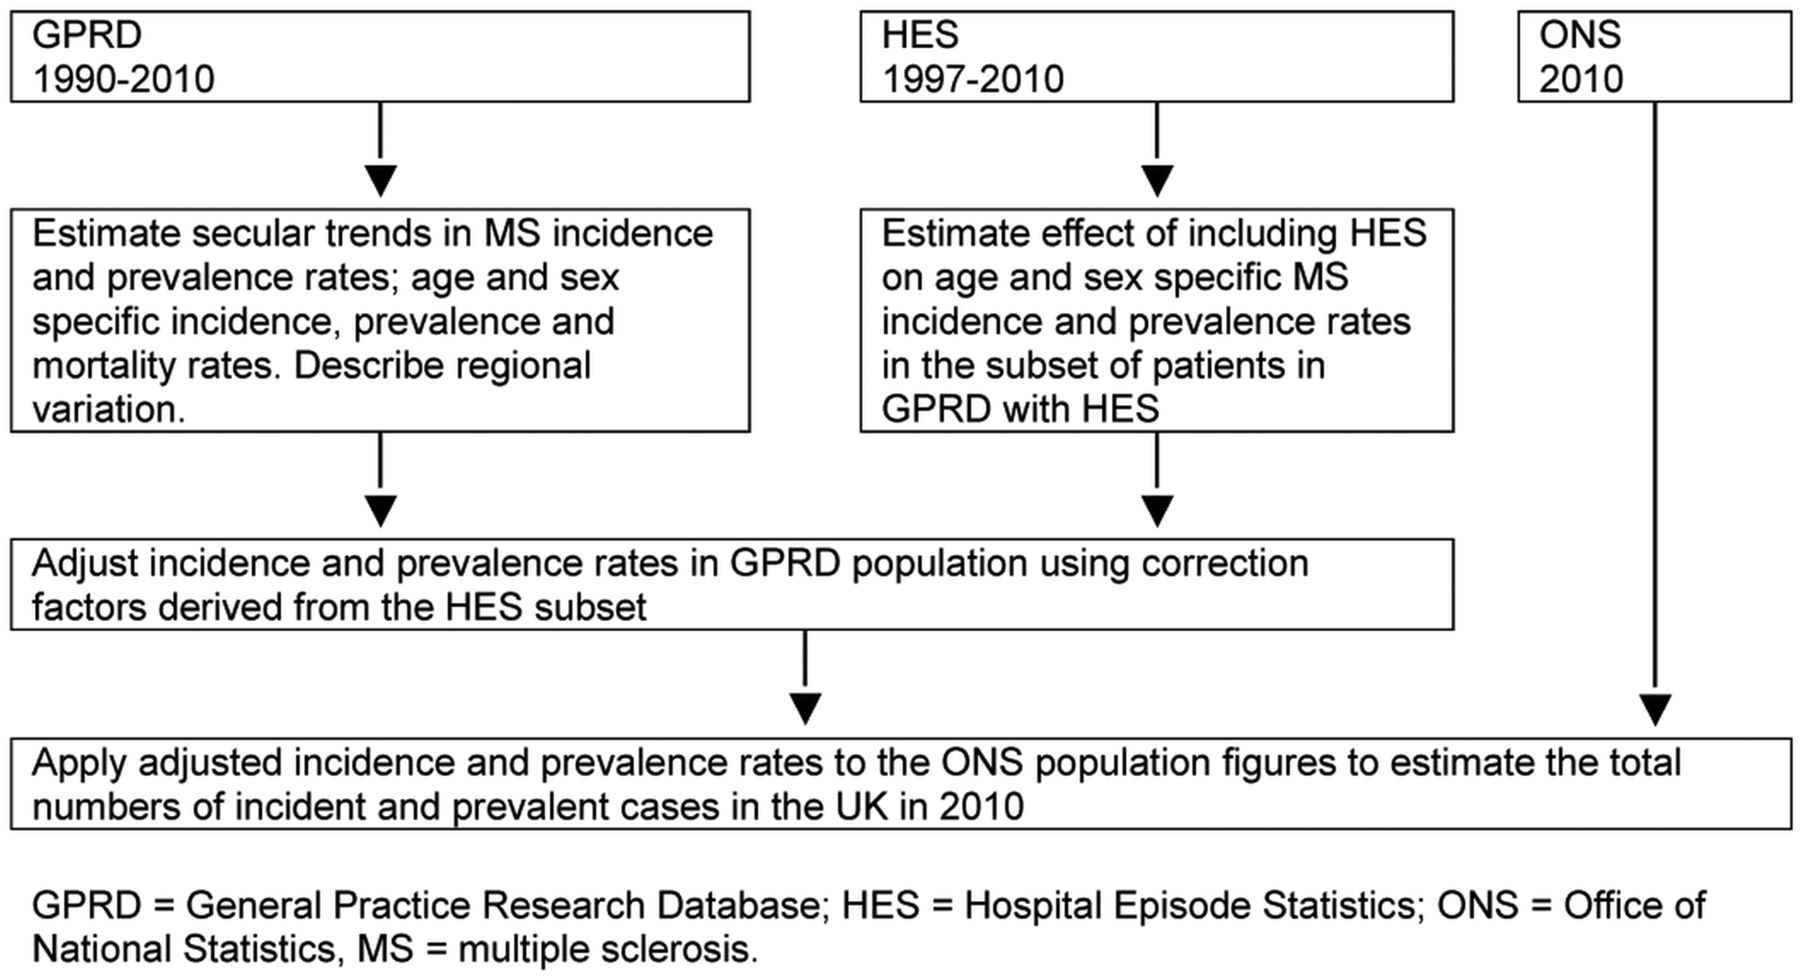
The analysis plan is shown in figure 1.

Analysis plan. GPRD, General Practice Research Database; HES, Hospital Episode Statistics; ONS, Office of National Statistics; MS, multiple sclerosis.
GPRD
For every patient, the number of days of follow-up available on the GPRD was calculated for each year from 1990 to 2010. We determined whether patients had any prior diagnosis of MS in the GPRD on the 1st January each year and, if not, whether any incident diagnosis occurred during the year.
Incidence rates were estimated from Poisson regression models with log(time at risk) as an offset variable. Prevalence rates were estimated from logistic regression models. The explanatory variables in the models were age, year and region. Geographical regions were defined as Scotland, Wales, Northern Ireland and the 10 Strategic Health Authorities of England. Data for men and women were analysed separately.
Mortality rates were analysed using logistic regression models.
Hospital episode statistics
HES data were available for about 44% of patients in the GPRD from 1997 to 2010. We estimated the prevalence and incidence of MS in these patients over this period of time using GPRD data only, as described above. We compared these rates with those calculated for the same patients using the additional diagnoses obtained from HES. Age-specific rates of under-recording of MS in the GPRD were estimated from inverse polynomials fitted to the ratios of cases identified from HES and the GPRD together versus the GPRD alone. These rates were used to adjust estimates of incidence and prevalence rates for the whole GPRD population.
Office for National Statistics
We applied these adjusted age-specific and gender-specific incidence and prevalence rates to population statistics obtained from the Office for National Statistics (ONS) for the UK population to estimate the absolute numbers of new and prevalent cases of MS in the UK population in 2010.9 We obtained sex-specific and age-specific mortality rates for England and Wales in 2000 and 2010 from the ONS10 and used them to calculate period life expectancy at birth in those years. To estimate the numbers of incident and prevalent cases of MS in the UK population in 2010 for men and women in each decade of life, we calculated incidence and prevalence rates in the entire GPRD population and applied age-specific correction factors to account for under-reporting in GP records alone. We applied the corrected rates in 2010 to the total national UK population based on ONS figures.9
Results
The numbers of patients with UTS follow-up time on the GPRD increased from 1.1 million in 1990 to at least 4.0 million between 2006 and 2010. The GPRD population included about 8% of the UK population in 2010, and their age and sex distributions were similar to those of the whole population (table 1).
Age and sex distributions of the UK population (ONS) and the GPRD population in 2010
Secular trends
The prevalence of MS increased by about 2.4% per year (95% CI 2.3% to 2.6%) in men and women over the study period (figure 2A) and reached 285.8 per 100 000 in women (95% CI 278.7 to 293.1) and 113.1 per 100 000 in men (95% CI 108.6 to 117.7) in 2010. The prevalence rates that are below the trend line in the early 1990s may be an artefact due to patients being first diagnosed before their entry to the database, despite the 2-year screening period. There was no change in MS prevalence in patients below the age of 50, but annual rates of increase were over 4% in patients aged ≥60 years (figure 2B).
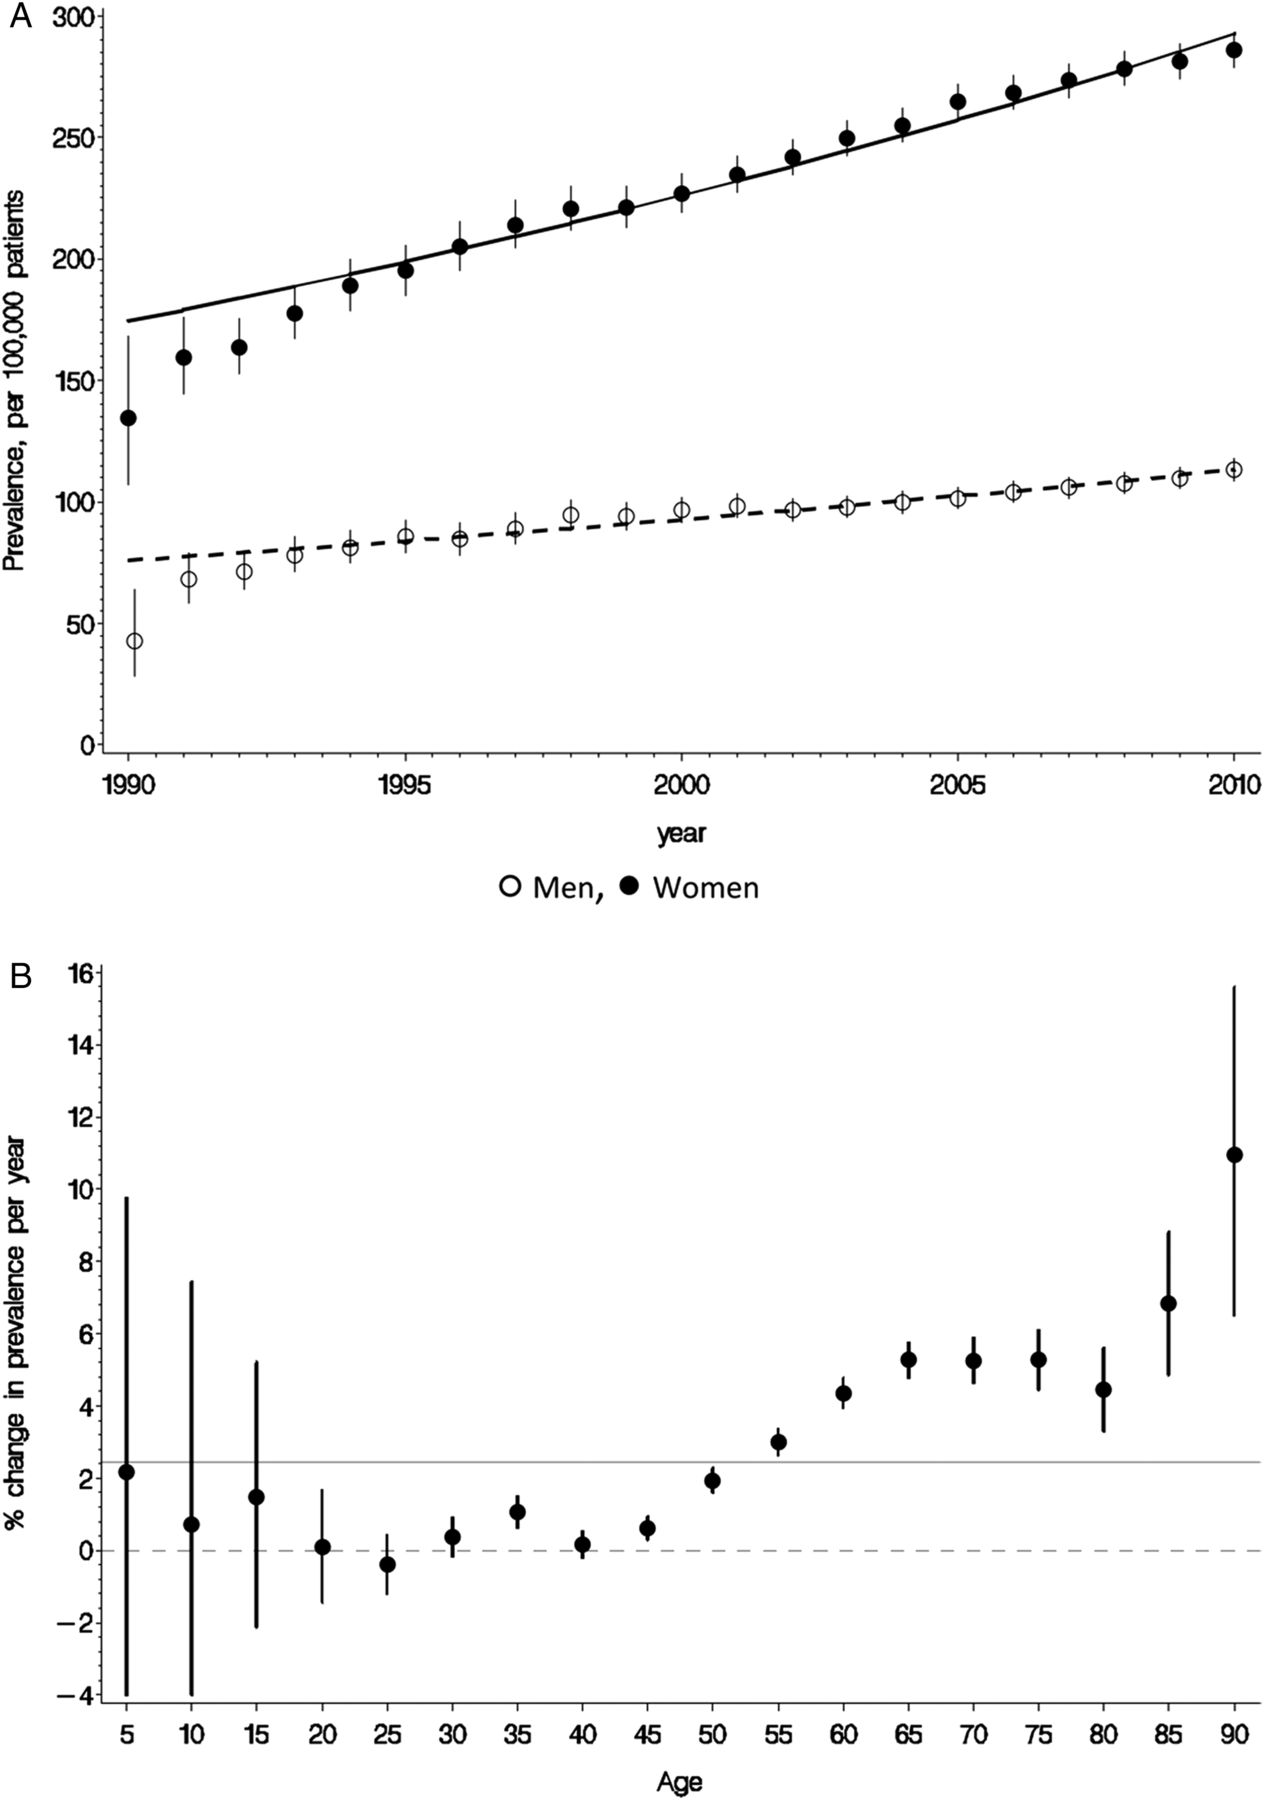
Secular trends in the prevalence of multiple sclerosis (General Practice Research Database 1990–2010). (A) Prevalence (per 105 (per 100 000) patients) in women and men (all age groups). (B) Variation in prevalence by age group (% change per year, both sexes).
There was a consistent downward trend in the incidence of MS in the whole study population over the 20-year study period (figure 3A). In 2010, MS incidence in women fell to 11.52 per 100 000/year (95% CI 10.96 to 12.11) and in men to 4.84 per 100 000/year (95% CI 4.54 to 5.16). The rate of decline between 1990 and 2010 was 1.51% per year (95% CI 0.99% to 2.07%) and did not differ between men and women (p=0.682) or with age (p=0.494) (figure 3B). This implies that the female-to-male ratio among incident cases, approximately 2.4, did not change significantly over the study period.

Secular trends in the incidence of multiple sclerosis (General Practice Research Database 1990–2010). (A) Incidence (per 105 patient years) in women and men (all age groups). (B) Variation in incidence by age group (% change per year, both sexes).
Mortality rates fell in the GPRD population over the study period. In the 70–79-year age group, for example, they fell from 5.41% per year (95% CI 5.25% to 5.58%) in 1990 to 2.82% per year (95% CI 2.76% to 2.87%) in 2010 in men and from 3.15% per year (95% CI 3.04% to 3.26%) to 1.88% per year (95% CI 1.84% to 1.92%) in women over the same time period. Among other age groups, the proportional decline was similar. The mortality rate among patients with MS was more than twice that of other patients in all age groups and in both sexes, but also declined at a similar proportional rate.
Life expectancy rose from 75.6 to 78.3 years in men and from 79.9 to 81.8 years in women. We applied the age-specific mortality ratios for people with and without MS observed in the present study to estimate changes in life expectancies in people with MS over the same decade. They increased from 61.4 to 65.4 years in men and from 68.7 to 71.6 years in women.
Age trends
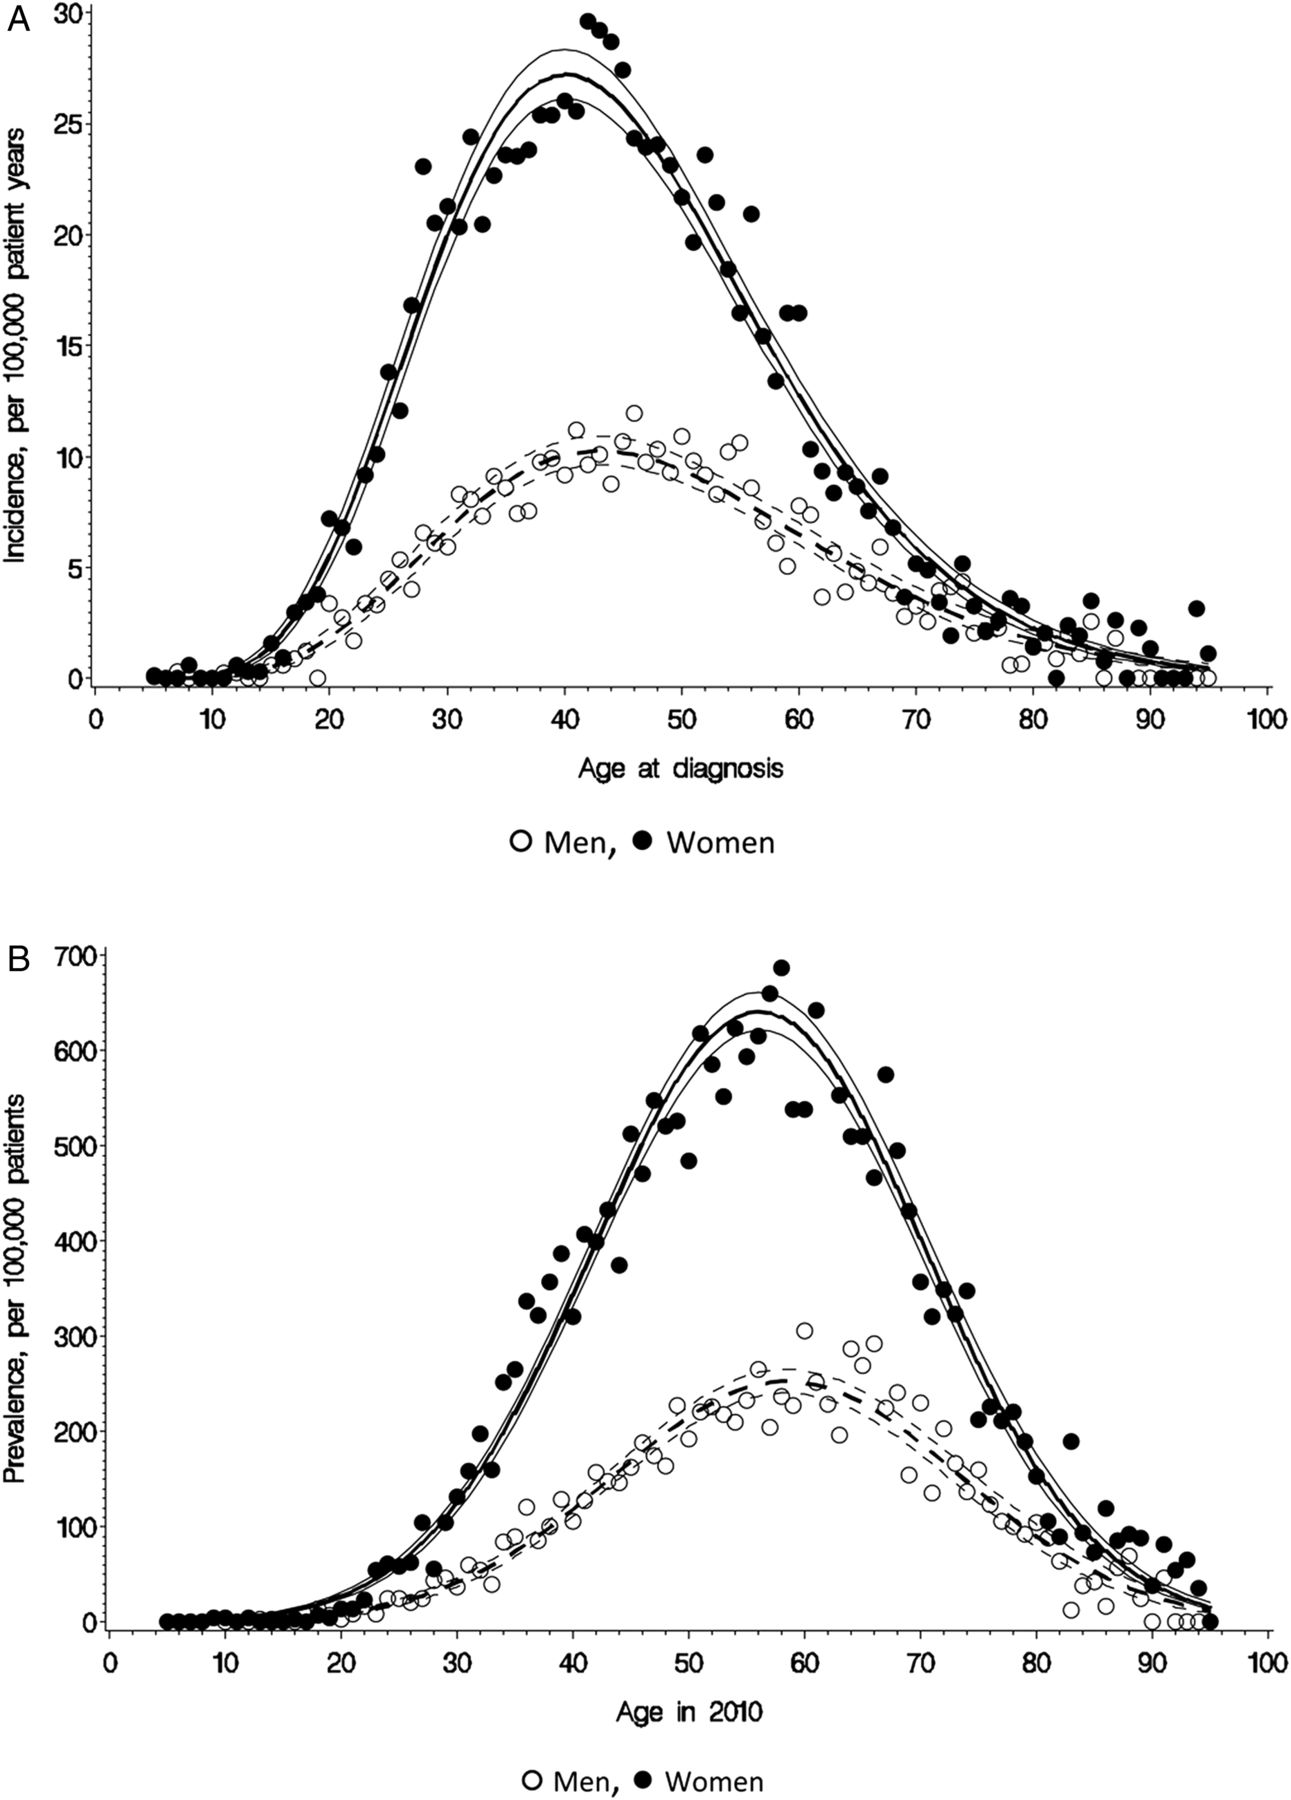
The peak incidence of MS occurred at the age of 40 years in women and 45 years in men (figure 4A), while peak prevalence rates occurred at the ages of 56 years and 59 years, respectively, (figure 4B).

Incidence and prevalence of multiple sclerosis in women and men by age (General Practice Research Database 1990–2010). (A) Incidence (per 105 patient years). (B) Prevalence (per 105 patients).
Regional variation
There was significant variation in the incidence and the prevalence of MS between regions of the UK (p<0.001) (see online supplementary Figures 5a and 5b). The highest prevalence and incidence rates were observed in Scotland. Among the other 12 regions of the UK, latitude accounted for 13.8% (men) and 4.0% (women) of the variation in incidence rates, and 2.0% (men) and 0.2% (women) of the variation in prevalence rates, none of which was statistically significant.
Hospital episode statistics
Between 1997 and 2010 GPRD and HES data were available for a subset of patients (approximately 44%, table 2). Tables 3 and 4 show the age-specific and sex-specific prevalence and incidence rates of MS in this subgroup of patients based on the GPRD alone, and the rates when the additional diagnoses recorded in HES are included. HES identified an additional 744 prevalent cases and 121 incident cases in men and 1521 prevalent cases and 227 incident cases in women. GPRD alone underestimated the prevalence of MS by 7.0% in men and 5.5% in women and incidence by 21.3% in men and 17.2% in women over the period 1997–2010. Age-specific correction factors were estimated.
GPRD study population by year and the subset with HES data available
Age-specific and gender-specific prevalence of MS using GPRD alone and GPRD with HES (1997–2010)
Age-specific and gender-specific incidence of MS using GPRD alone and GPRD with HES (1997–2010)
Overall estimates of the UK MS population in 2010
Table 5 shows overall estimates of the numbers of incident and prevalent cases of MS in the UK population in 2010 for men and women in each decade of life. We estimate that 126 669 people were living with MS in the UK at the beginning of 2010 (203.4 per 100 000 population) and that 6003 new cases were diagnosed during that year (9.64 per 100 000/year). Women accounted for 72% of prevalent and 71% of incident cases. We also estimated the numbers of incident and prevalent cases of MS in the four countries which comprise the UK (table 5).
Estimated numbers of incident and prevalent cases of MS in the UK population in 2010
Discussion
Principal findings of the study
We estimate that the prevalence of MS in the UK in 2010, including diagnoses obtained from HES, was 289.0 per 100 000 in women and 115.0 per 100 000 in men. The overall prevalence of MS increased by approximately 2.4% per year between 1990 and 2010 in women and men. This increase in prevalence was due to a convergence of absolute mortality rates in patients with and without MS, the result of mortality rates falling by about 3% per year in both groups. There was no change in MS prevalence in patients below the age of 50, but annual rates of increase were over 4% in patients aged ≥60 years. We observed a decline in the rate at which new cases of MS were diagnosed, and the rising prevalence rate can likely be accounted for by trends in mortality rates. There was a consistent downward trend in overall incidence of MS in the whole study population over the 20-year study period, and the rate of decline did not differ between men and women or with age. It is possible that this is due to new diagnostic techniques which reduced the risk of false positive diagnoses over the study period. The maximum incidence of MS occurred at age 40 years (women) to 45 years (men). We were not able to analyse the effects of prior pregnancy on the age of onset of MS in women in this study, although it has previously been reported that pregnancy reduces the risk of onset of MS.11 We found significant regional variation in incidence and prevalence rates in the UK. We found the highest incidence and prevalence rates among the 13 regions of the UK in Scotland, but no trend with latitude among the other 12 regions. This suggests that the difference between Scotland and other regions of the UK is probably not the result of a consistent trend with latitude, but may involve factors not associated with latitude. We were not able to analyse the different regions of Scotland separately using the GPRD.
Strengths and weaknesses of the study
A major strength of this study is that it covers a representative sample of GPs spread geographically throughout the UK, and a patient population with age and sex distributions similar to those of the general UK population. The study population of some 4 million patients provides greater statistical precision than earlier regional surveys. Our analyses depend upon the accuracy of diagnosis and recording of MS by GPs: there may have been miscoding of tentative MS diagnoses as definite MS cases, leading to an overestimate in the number of MS cases, or under-recording may have led to an underestimate in the number of cases. In a systematic review of 212 publications using the GPRD, Herrett et al reported that the median proportion of cases with a confirmed diagnosis based on additional internal or external validation was 89% across all disease groups and 81% for nervous system diseases12 but there has not yet been a validation of MS diagnoses specifically within GPRD. We addressed some of the limitations of the GPRD records by also using HES, which allowed us to estimate the extent of under-recording of MS in the GPRD.
Relation to other studies
The prevalence rates we found are slightly higher than the rates reported by Thomas et al in 2007, also using the GPRD: 281.0 per 100 000 (95% CI 273.0 to 289.0) among women and 108.0 per 100 000 (95% CI 103.0 to 113.0) among men, with the highest prevalence in those aged 55–64 years.13 This study and our study found maximum prevalence for MS in patients around the age of 60.
Alonso and colleagues reported incidence rates of 7.2 (95% CI 6.5 to 7.7) per 100 000 person-years in women and 3.1 (95% CI 2.6 to 3.5) in men in the UK between 1993 and 2000 in their GPRD study, which are somewhat lower than our findings.6 The UK has a relatively high incidence of MS compared to other countries. An overall incidence rate of MS of 3.6 per 100 000 person-years in women and 2.0 in men was reported in a review of studies of the incidence of MS published between 1966 and 2007.14
The downward trend in incidence that we found is in contrast to studies in Denmark, where the female incidence of MS has almost doubled since the 1970s while male incidence has remained constant.15 These authors found a general, but not ubiquitous, increase in MS incidence in Western Europe and North America.15 However, they point out that many of the studies included only small numbers of cases and random variations may have contributed to the irregular patterns observed. Moreover, separate surveys carried out and analysed at different times may be subject to methodological differences. It is not clear why our study has detected a decreasing incidence while others have suggested increasing incidence. Changes in awareness of MS and the challenges of diagnosing MS may account for changes incidence over time. However, we could identify no specific reason why the methodology or data source we used should have had an impact on our finding of decreasing incidence of MS over the period of the study.
Sex ratio in MS
In the current study, the mean female-to-male ratio for MS was 2.4 and there was no trend with time over the 20-year study period. In their 2008 review of published studies on the incidence of MS, Alonso and Hernán reported that the female-to-male ratio increased from 1.4 in 1955 to 2.3 in 2000.14 This increase in the sex ratio for MS is not ubiquitous, however, and there are striking geographic variations. For example, a recent analysis of trends in the sex ratio in MS for individuals born between 1930 and 1989 found a marked increase in Northern Europe (not including the UK) (from 2.09 to 3.77), but only a moderate increase in Southern Europe (from 1.46 to 2.31).16 In contrast, a study in Sweden found a mean female-to-male ratio for MS of 2.62, with no clear trend with year of birth for individuals born between 1931 and 1985.17 A recent review reported a significant increase in the MS prevalence female-to-male sex ratio in the UK between 1949 and 2009—a much longer time period than our study.18 It is possible that this historical trend in female-to-male sex ratio for MS has now stabilised. This may be partly accounted for by changing health-related behaviours of men in recent years, perhaps having more contact with medical services than was the case historically. We are not able to identify any particular reason why the study methodology or data source could have confounded our findings regarding sex-ratio.
Regional variations in MS
A recent study using HES data for the period 1999–2005 showed regional variations in hospital admission rates for MS in England.19 This study found significantly higher MS admissions in more northern regions of England even after adjusting for social deprivation and UK birthplace. Early studies on MS suggested a trend with latitude with increasing prevalence in more temperate climates in Northern and Southern hemispheres.3 ,20–26 However, the idea that there is a relationship between latitude and MS incidence or prevalence in Western Europe has been dismissed recently by some authors.15 In contrast, Simpson and colleagues reported that there was a statistically significant positive association between MS prevalence and latitude globally, although there were some exceptions to the latitudinal gradient in some parts of Europe.18
Regional variation in MS epidemiology may be due to genetic or environmental factors and interactions between them. A study in Ireland found that the HLA DRB1*15 allele associated with MS susceptibility is more common in areas of higher prevalence.25 The exact role of such factors in the epidemiology of MS remains to be ascertained. One recent study found that the distribution of HLA DRB1 accounted for 52% of the variation in MS prevalence by latitude in Europe,27 whereas another study suggested that non-HLA DRB1 factors play an important role in regional MS variations in Europe.18 For example, it has been suggested that lack of vitamin D may increase susceptibility to MS. This is supported by studies on the effect of month of birth on subsequent risk of MS in Northern and Southern hemispheres.28–29 Vitamin D also reversibly blocks the progression of experimental autoimmune encephalomyelitis, a mouse model of MS.30 Further evidence comes from a recent genetic study which demonstrated a causative role for the CYP27B1 gene, which encodes the vitamin D-activating 1-α hydroxylase enzyme.31 Such factors may have a role in increasing the incidence of MS in Scotland relative to other parts of the UK. Further studies are needed to investigate the causative factors of MS, particularly the role of Vitamin D, genetic susceptibility factors and infective agents.
Conclusions
This study provides a comprehensive picture of the prevalence and incidence of MS throughout the UK over two decades. It shows that more than 6000 people in the UK were newly diagnosed with MS in 2010 and that patients with MS are living longer, leading to a rising population living with the disease. This has important implications for resource provision in the UK.
References
Supplementary materials
Supplementary Data
This web only file has been produced by the BMJ Publishing Group from an electronic file supplied by the author(s) and has not been edited for content.
Files in this Data Supplement:
- Data supplement 1 - Online figures
Footnotes
-
Contributors All authors were involved in drafting and reviewing the manuscript. Statistical analysis was carried out by SVM. The guarantor for the study is ISM.
-
Funding This study was funded by a grant from the Multiple Sclerosis National Therapy Centres (MSNTC), Registered Charity No.1 031 690. This grant supported study meetings but MSNTC had no input into the design of the study, collection, analysis or interpretation of the data or in the decision to submit the paper for publication.
-
Competing interests All authors have completed the Unified Competing Interests form at http://www.icmje.org/coi_disclosure.pdf (available on request from the corresponding author) and declare that (1) the authors have no support from any company for the submitted work; (2) JOR has been involved as principal investigator in clinical trials, a consultant on advisory boards and invited guest speaker for Biogen Idec, Merc Serono, Bayer Schering, Teva Pharmaceuticals and Novartis; TM has been a consultant on advisory boards for Novartis in the area of multiple sclerosis and has other potential competing interests but not in this therapeutic area; IM holds research grants from Novartis and Menarini in different therapeutic areas; GB and SM have no specified relationships with companies that might have an interest in the submitted work in the previous 3 years; (3) the authors’ spouses, partners or children have no financial relationships that may be relevant to the submitted work; (4) GB was a trustee of MSNTC from June 2008 to June 2012 and now acts as a consultant for MSNTC (both positions were unpaid). The other authors have no non-financial interests that may be relevant to the submitted work.
-
Ethics approval ISAC approval.
-
Provenance and peer review Not commissioned; externally peer reviewed.
-
Open Access This is an Open Access article distributed in accordance with the Creative Commons Attribution Non Commercial (CC BY-NC 3.0) license, which permits others to distribute, remix, adapt, build upon this work non-commercially, and license their derivative works on different terms, provided the original work is properly cited and the use is non-commercial. See: http://creativecommons.org/licenses/by-nc/3.0/