Article Text

Abstract
Objective Frailty is an important prognostic factor in hospitalised patients but typically requires face-to-face assessment by trained observers to detect. Thus, frail patients are not readily apparent from a systems perspective for those interested in implementing quality improvement measures to optimise their outcomes. This study was designed to externally validate and compare two recently described tools using administrative data as potential markers for frailty: the Hospital Frailty Risk Score (HFRS) and the Hospital-patient One-year Mortality Risk (HOMR) Score.
Design Retrospective cohort study.
Setting Ontario, Canada.
Participants All patients over 75 with at least one urgent non-psychiatric hospitalisation between 2004 and 2010.
Main outcome measures Prolonged hospital length of stay (>10 days), 30-day mortality after admission and 30-day postdischarge rates of urgent readmission or emergency department (ED) visits.
Results In 452 785 patients (25.9% with intermediate or high-risk HFRS), increased HFRS was associated with higher Charlson scores, older age and decreased likelihood of baseline independence. Patients with high or intermediate HFRS had significantly increased risks of prolonged hospitalisation (70.0% (OR 8.64, 95% CI 8.30 to 8.99) or 49.7% (OR 3.66, 95% CI 3.60 to 3.71) vs 21.3% in low-risk HFRS group) and 30-day mortality (15.5% (OR 1.27, 95% CI 1.20 to 1.33) or 16.8% (OR 1.39, 95% CI 1.36 to 1.41) vs 12.7% in low-risk), but decreased risks of 30-day readmission (10.0% (OR 0.74, 95% CI 0.69 to 0.79) and 11.2% (OR 0.84, 95% CI 0.82 to 0.86) vs 13.1%) or ED visit (7.3% (OR 0.41, 95% CI 0.38 to 0.45) and 11.1% (OR 0.66, 95% CI 0.38 to 0.45) vs 16.0%). Although only loosely associated (Pearson correlation coefficient 0.265, p<0.0001), both the HFRS and HOMR Score were independently associated with each outcome—HFRS was more strongly associated with prolonged length of stay (C-statistic 0.71) and HOMR Score was more strongly associated with 30-day mortality (C-statistic 0.71). Both poorly predicted 30-day readmissions (C-statistics 0.52 for HFRS and 0.54 for HOMR Score).
Conclusions The HFRS best identified hospitalised older patients at higher risk of prolonged length of stay and the HOMR score better predicted 30-day mortality. However, neither score was suitable for predicting risk of readmission or ED visit in the 30 days after discharge. Thus, a single score is inadequate to prognosticate for all outcomes associated with frailty.
- frailty
- risk model
- risk score
- hospitalization
- validation
Statistics from Altmetric.com
Frailty is a multidimensional syndrome characterised by decreased physiological reserve, reduced resistance to stressors and increased risk of adverse outcomes including, for hospitalised patients, longer length of stay (LOS), increased risk of institutionalisation at discharge, and higher rates of readmissions or death after hospital discharge.1 2 Although multiple tools have been developed to identify frailty in both clinical and research settings, these measures typically require face-to-face assessment by trained observers and sometimes even require special equipment.3 4 As a result, frail patients are not readily apparent from a systems perspective for health planners or others interested in implementing quality improvement measures to optimise their outcomes. Thus, there is a great deal of interest in using electronic health records or administrative datasets to mine big data and derive prediction models to identify frail patients more easily.
Recently, a score based on routinely collected hospital administrative data was derived (the Hospital Frailty Risk Score (HFRS)) and validated within the UK National Health Service.5 Increasing HFRS values were associated with significantly increased risks of prolonged hospital length of stay, 30-day urgent readmission and 30-day mortality (with C-statistics ranging from 0.56 to 0.68 for the different outcomes). The authors highlighted that the HFRS could be used to screen for frailty in a low-cost systematic way but that it needed to be validated in other settings.5 6
The aim of this study was to determine whether the HFRS was associated with patient outcomes in Ontario, Canada. In addition, we compared its performance with that of another administrative data-based algorithm, the Hospital-patient One-year Mortality Risk (HOMR) Score, which was derived to predict the 1-year risk of death after admission to hospital and is also viewed as a proxy for frail status.7 Neither the HFRS nor the HOMR Score can currently be used to help with clinical decision-making in real time during the patient’s index hospitalisation because the primary dataset used to generate both scores (the hospitalisation discharge record) is created only after the patient’s discharge by trained nosologists abstracting that record. However, as hospital health information systems evolve to provide real-time decision support, generation of either score could be incorporated into future electronic health records and made available in real time to clinicians caring for a patient based on their prior hospitalisations and the features of the admitting presentation and diagnoses assigned in the emergency room. Indeed, a recent study did establish that this was possible and the HOMR Score generated on day 1 of hospitalisation using an electronic health information system remained just as discriminative (C-statistic 0.92) as seen for HOMR Scores generated after discharge.8
Methods
We conducted a retrospective cohort study and replicated the inclusion criteria used in the HFRS study5 by enlisting all patients >75 years old (including those from long-term care facilities) having at least one urgent non-psychiatric admission between 1 January 2004 and 31 December 2010 (with one admission per person randomly selected) in the province of Ontario, Canada. This time frame was chosen to avoid any hospitalisations used for the derivation of the HOMR Score.7 We deterministically linked data anonymously using de-identified personal healthcare numbers within the Discharge Abstract Database (which captures all acute-care hospitalisations), the Registered Person’s Database (which captures all dates of death, even those out of province), the National Ambulatory Care Reporting System (which captures all visits to emergency departments (EDs)) and the Continuing Care Reporting System (which captures data from nursing homes and other long-term care facilities). The validity and completeness of comorbidity coding in these Canadian datasets have been previously established.9
The HFRS was calculated by assigning point values to any of 109 International Classification of Diseases, 10th revision (ICD-10) codes listed in each patient’s index admission or any admissions in the prior 2 years (a summary of the 109 ICD-10 codes and point values is provided in online supplementary appendix A, but a SAS macro provided in the online supplementary appendix to the original paper by Gilbert et al can be used to calculate the score).5 The HOMR Score includes 11 patient and hospitalisation factors (one of which includes points for any of 71 ICD-10 codes in the index hospitalisation or any hospitalisations in the prior year) as outlined in online supplementary appendices B and C.7
Supplemental material
Outcomes included those from the original HFRS study: prolonged index hospitalisation length of stay (that is, LOS longer than 10 days); death from any cause within 30 days of admission to hospital (which includes in-hospital deaths); urgent readmission within 30 days in those discharged alive. Given increasing interest in postdischarge 30-day ED visits by the Centers for Medicare and Medicaid Services and others, we also included this outcome.
We used logistic regression to determine the association between HFRS group and outcomes. We also used fractional polynomials (implemented with a macro from Sauerbrai et al 10) to determine the association of HFRS and HOMR (expressed as continuous variables) with each outcome both in isolation and after adjusting for the other covariable. The relative importance of each score for each outcome was compared using the index of adequacy.11 To determine the influence of the competing risk of death on the association of risk scores with time to readmission, we created a proportional hazards model for the subdistribution of a competing risk (ie, the ‘Fine-Grey’ model).12 All analyses were done in SAS V.9.4 (Cary, North Carolina, USA). Use of the de-identified Ontario datasets was approved by the Sunnybrook Research Ethics Board (File HSPE 0901 036 000).
Results
In 452 785 patients (mean age 83, 25.9% with intermediate or high-risk HFRS), increased HFRS was associated with higher Charlson scores, older age, decreased likelihood of baseline independence, but fewer prior hospitalisations (table 1). Prolonged hospital LOS and 30-day mortality were significantly higher in the intermediate and high-risk HFRS groups (table 1, C-statistics 0.70 and 0.55), but urgent 30-day readmission or ED visit were inversely associated with HFRS in our cohort. This result persisted with the proportional hazards competing risks Fine-Grey model (online supplementary appendix E).
Description of study cohort and outcomes
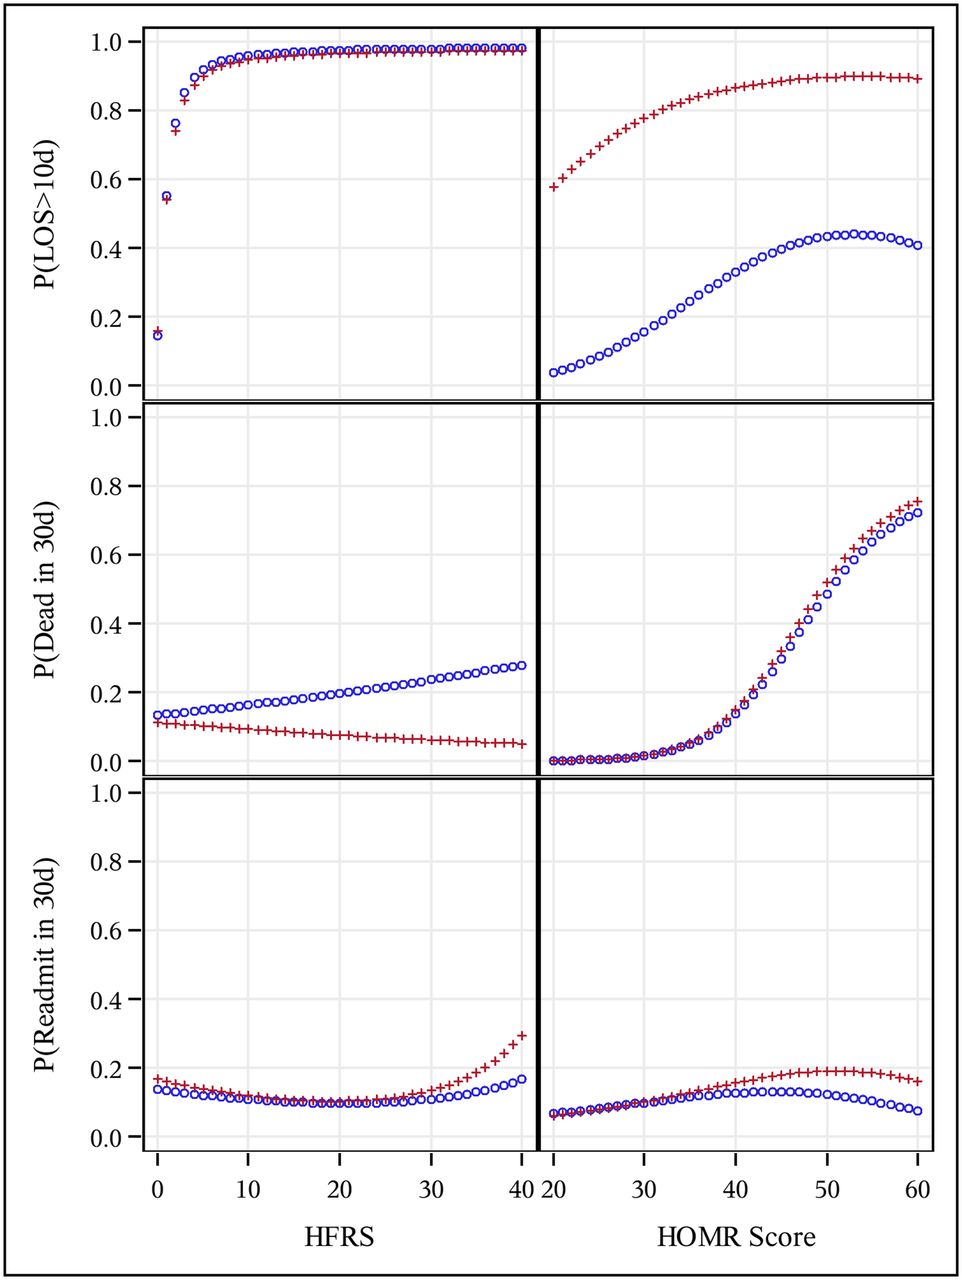
The HFRS was loosely associated with the HOMR Score (Pearson correlation coefficient 0.265, p<0.0001), and both scores were independently associated with outcomes (figure 1, online supplementary appendix D). While the HFRS was more strongly associated with prolonged LOS (C-statistic 0.71, accounting for 89.4% of the adjusted model’s explanatory power, online supplementary appendix D), the HOMR Score was more strongly associated with 30-day mortality (C-statistic 0.77, accounting for 99.4% of the adjusted model’s power). Neither score was strongly associated with the probability of 30-day urgent readmission (figure 1)—C-statistics were 0.52 for the HFRS and 0.54 for the HOMR Score. Adding the HOMR Score to the HFRS did improve discrimination for all three outcomes but not substantially (online supplementary appendix D).

Association of the Hospital Frailty Risk Score (HFRS) and the Hospital-patient One-year Mortality Risk (HOMR) Score on study outcomes. This panel illustrates the influence of the HFRS (left column) and the HOMR Score (right column) on the probability of each outcome including prolonged hospital stay longer than 10 days (top row), dying within 30 days of hospitalisation (middle row) and being urgently readmitted within 30 days of discharge from hospital (bottom row). In each cell, both unadjusted (blue) and adjusted (red) values are given (with the latter calculated using the mean value of other index: mean HFRS=3.5; mean HOMR Score=38.2). LOS, length of stay.
Discussion
We found that, although they are only loosely associated (with a Pearson correlation coefficient of 0.265), both the HFRS and HOMR Score were independently associated with each outcome we studied. However, the HFRS was more strongly associated with prolonged length of stay (C-statistic 0.71) and the HOMR Score was more strongly associated with 30-day mortality (C-statistic 0.71). This is not surprising given that each was developed to principally predict those outcomes. However, the important finding is that both scores performed poorly for prediction of 30-day readmissions (C-statistics 0.52 for the HFRS and 0.54 for the HOMR Score)—reflecting the fact that frailty is only one of the many factors that influence readmission rates.13–15 Thus, although prolonged LOS, high short-term mortality and high re-admission rates are all more common in frail patients, a single score is inadequate to prognosticate for all outcomes associated with frailty.
We also found that despite a similar age and sex distribution, elderly hospitalised Ontarians had lower mean Charlson scores (2.0 vs 2.9) and were less likely to be classified as frail by the HFRS than reported in the original UK HFRS study (25.9% vs 57.6%). This could be explained by differences in (1) admission patterns (the proportion of patients with multiple prior admissions was far higher in the UK (40.1%) than Ontario (6.3%), permitting more opportunities for comorbidities to be coded) or (2) depth of coding practices between countries (although the UK inpatient database includes up to 20 diagnosis fields and the Canadian Discharge Abstract Database captures up to 25, the number of fields completed by nosologists likely vary between countries). Regardless of these potential differences, the estimates of frailty prevalence in our cohort are closer to those reported in studies employing physical assessments.1 16
Our finding that prolonged hospital LOS and 30-day mortality were significantly more common in the intermediate and high-risk HFRS groups (with C-statistics of 0.70 and 0.55) is very similar to those reported in the original UK study.5 While the absolute rates were higher for both outcomes in our cohort within each HFRS stratum than in the UK data,5 differences in hospital use patterns and postdischarge outcomes are common between countries,13 and the important finding was the similar gradient of risk across HFRS strata. Thus, we have validated the generalisability of the HFRS (for the outcomes of prolonged hospital LOS or 30-day mortality) in a different healthcare system, geographical region and time period from where it was derived and initially validated.
However, in contrast to the UK findings,5 we found that patients with higher HFRS at discharge were less likely to be readmitted or have an ED visit than those with lower HFRS. This suggests that Canadian care patterns differ from the UK, with frail patients in Ontario more likely to receive subsequent care in non-acute care venues. The extent to which this reflects physician, patient or family preferences or system factors requires further study. We can say that this finding is not due to the competing risk of death based on our Fine-Grey model (online supplementary appendix E). It should be noted that we mirrored the UK analysis by only evaluating outcomes in those discharged alive in our primary analysis; the original UK analysis did not account for the competing risk of death and reported—in contrast to our study—that higher HFRS were associated with higher readmission risk.
Although we used data for all acute-care hospitalisations in a Canadian province with universal access free at the point of care (similar to the UK National Health Service) and achieved complete capture of all postdischarge events, any study using administrative data is at risk of misclassification bias depending on the quality of the underlying medical records and documentation. However, these administrative data biases would be active in both this and the original HFRS study, making our similar results even more notable. In order to determine if these two scores are good proxies for frailty, prospective studies comparing both scores with physical measurement scales that define the frailty phenotype (based on measurable factors like gait speed, grip strength, muscle mass etc) are required.
In summary, our findings support the contention that the HFRS could potentially be used to identify higher-risk patients during hospitalisation who might require earlier and more intensive inpatient rehabilitative services to maintain functional status and shorten LOS. The HOMR Score better predicted 30-day mortality and thus may be better for identifying those patients requiring more intensive transitional services at the time of discharge. However, both scores performed more poorly than existing scores for predicting risk of 30-day readmission or ED visit17 and neither appears suitable for that task. As both scores are computationally complex and require access to electronic health records or administrative diagnosis/billing data, their implementation into clinical practice awaits developments in hospital information systems permitting real-time score generation and provision to clinicians at the frontline. In the meantime, the scores could be used for adjustment in studies comparing processes and outcomes between hospitals with different patient populations—the HFRS for LOS comparisons and the HOMR Score for 30-day mortality comparisons.
Acknowledgments
This study was supported by the Institute for Clinical Evaluative Sciences (ICES), which is funded by an annual grant from the Ontario Ministry of Health and Long-Term Care (MOHLTC).
References
Footnotes
Contributors Both authors contributed equally to the planning, conduct and reporting of the work described herein and (anonymised for blinded peer review) is responsible for the overall content as guarantor. The corresponding author attests that all listed authors meet authorship criteria and that no others meeting the criteria have been omitted.
Funding This project was unfunded although McAlister receives salary support from the Alberta Health Services Chair in Cardiovascular Outcomes.
Disclaimer The opinions, results and conclusions reported in this paper are those of the authors and are independent from the funding sources. No endorsement by ICES or the Ontario MOHLTC is intended or should be inferred. Parts of this material are based on data and information compiled and provided by Canadian Institute for Health Information (CIHI). However, the analyses, conclusions, opinions and statements expressed herein are those of the author and not necessarily those of CIHI.
Competing interests None declared.
Patient consent Not required.
Ethics approval Sunnybrook Hospital, Toronto.
Provenance and peer review Not commissioned; externally peer reviewed.
Data sharing statement We are unable to release the databases used for this study as they are held by the Institute for Clinical Evaluative Sciences (ICES) on behalf of the Ontario Ministry of Health and Long-Term Care. Individuals can submit data access requests to ICES with appropriate ethics board approval.