Article Text

Abstract
Purpose To develop algorithms for preoperative estimation of the true postoperative intraocular lens (IOL) position to be used for IOL power calculation.
Setting Moorfields Eye Hospital NHS Foundation Trust, London, UK.
Methods Fifty patients were implanted randomly with a 3-piece IOL model in one eye and a 1-piece model in the other eye. Preoperatively, the IOLMaster was used to determine axial length, anterior chamber depth and mean corneal radius. Lens thickness and corneal width were measured with the ACMaster. Postoperative IOL position was measured with the ACMaster. Partial least squares (PLS) regression analysis of IOL position in terms of preoperative parameters was performed with a commercially available software package.
Results The PLS regression analysis showed that age, refraction, corneal width, lens thickness and corneal radius are not significant predictors of postoperative position of the anterior IOL surface, while axial length and in particular anterior chamber depth are. Regression relationships in terms of the above-mentioned predictors were determined for the two models implanted. Surprisingly, it turned out that the position of the posterior IOL surface could be described by a single regression relationship valid for both models. The residual SD for prediction of IOL position was about 0.17 mm for all relationships.
Conclusions Accurate relationships to determine the true postoperative IOL position were obtained. In addition to axial length and corneal radius, which are required for the IOL power calculation as such, they require measurement of preoperative anterior chamber depth only.
- Anterior chamber
- Treatment Surgery
Statistics from Altmetric.com
Introduction
Most current intraocular lens (IOL) power formulas use thin lens theory and differ from each other mainly in their estimation of effective lens position (ELP) as shown by Haigis.1 ELP is not the true position of the IOL, but the one that makes the formula prediction error zero. For exact ray tracing calculations, the true position of the IOL is required. The purpose of this paper is to establish relationships to estimate the true postoperative IOL position in terms of available preoperative parameters.
Methods
In a study of IOL stability at Moorfields Eye Hospital (London, UK), 50 patients were implanted in the capsular bag in one eye each with the IOL models ZA9003 (3-piece) and ZCB00 (1-piece) (Abbott Medical Optics). The study was designed in accordance with ISO 14155,2 and was approved by the institutional review board and adhered to the tenets of the Declaration of Helsinki. All patients provided informed consent. Surgery was performed using a 3.2 mm temporal incision in clear cornea close to the limbus. The capsulorhexis size was aimed at 5.0 mm. IOL power was determined with the SRK/T formula.
Preoperative measurements included determination of axial length (AL), anterior chamber depth (ACD; distance from anterior cornea to anterior lens) and mean corneal radius (CR) by means of IOLMaster software V.5 (Carl Zeiss Meditec AG). Lens thickness (LT) and corneal width (also known as ‘white-to-white’) were measured with the ACMaster (Carl Zeiss Meditec AG; no longer commercially available). Preoperative refraction (Rx; spherical equivalent) was determined using a trial frame with an ETDRS target at 4 m. The postoperative position of the anterior IOL surface, anterior lens position (aLP), was obtained by means of the ACMaster.
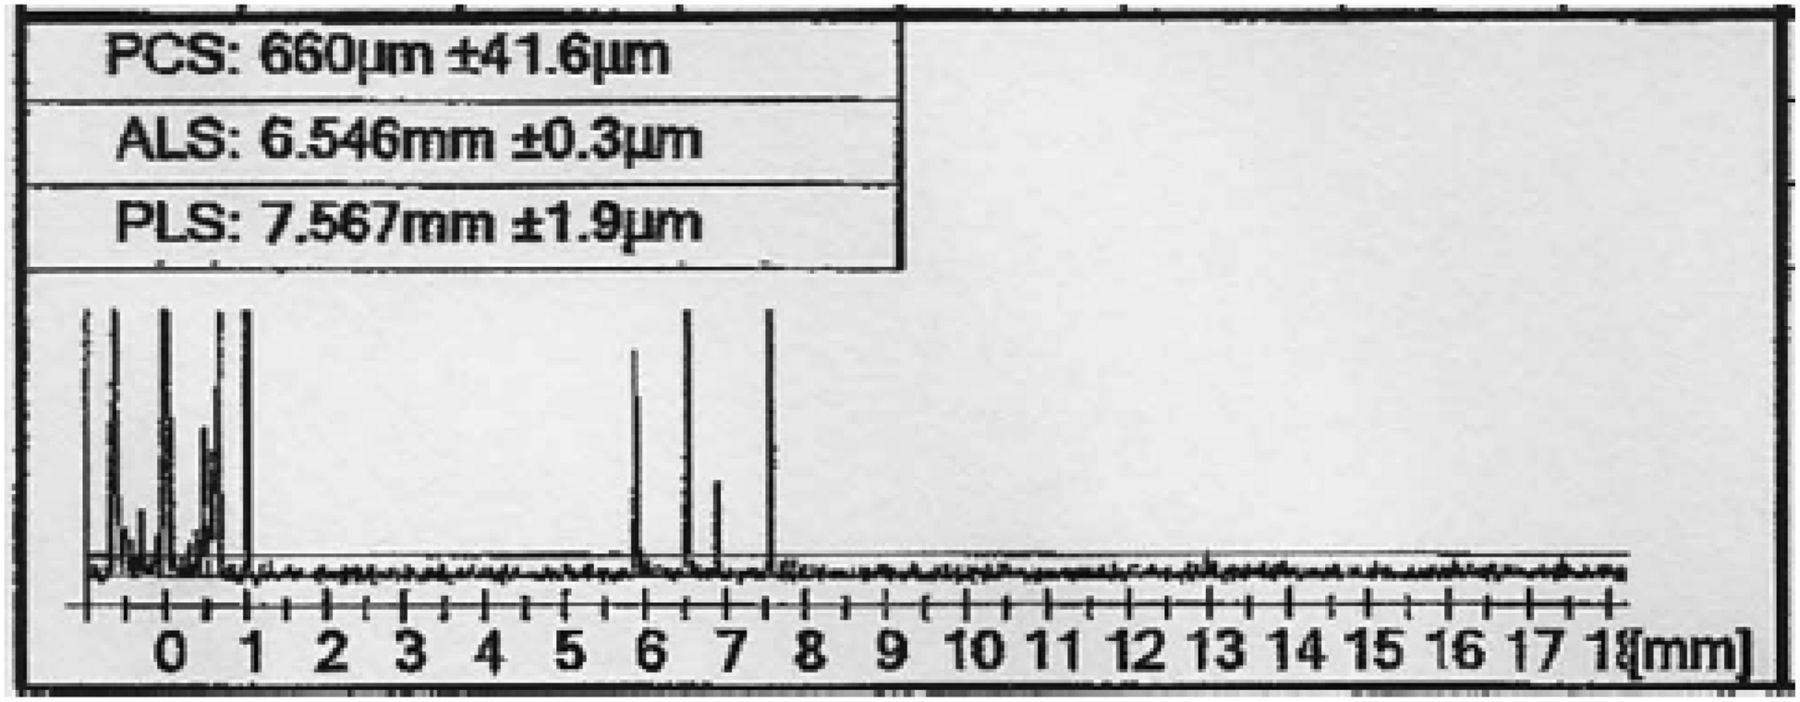
Obtaining aLP with the ACMaster is not straightforward. ACMaster is based on the partial coherence interferometry principle, which measures distances between reflecting surfaces. Peaks appear in order of magnitude of distance. We chose the option to set refractive index to 1, which results in output of distances as optical path lengths. With the two surfaces of the cornea and the two surfaces of the IOL, a maximum of six peaks3 to the right of the 0 peak can be recorded (figure 1). Only rarely are all six peaks seen in a single measurement, often resulting in erroneous assignment of the peaks obtained by the instrument. Then manual editing is required. Every single scan was scrutinised and peaks were assigned when certain identification could be made. Uncertain measurements were discarded. The optical path lengths of corneal thickness (CT) and ACD were eventually converted to physical distances using the group refractive indices4 of cornea (1.3851) and aqueous (1.3454), to obtain aLP as a physical distance. These indices apply for the supraluminescent laser diode, emitting at 850 mm, used in the ACMaster. They should not be confused with the commonly accepted phase refractive indices of 1.376 and 1.336, respectively, which apply at 550 nm.

ACMaster measurement that captured all six anterior segment distances (scanned from printed output). Refractive index was set to 1, which makes the distances displayed optical distances. Peaks to the right of the 0 peak are in sequence: PCS, posterior corneal surface (distance from anterior to posterior cornea), intraocular lens (IOL) thickness (sometimes erroneously assigned as PCS by the instrument), distance from posterior cornea to anterior IOL, ALS, anterior lens surface (distance from anterior cornea to anterior IOL), distance from posterior cornea to posterior IOL and finally PLS, posterior lens surface (distance from anterior cornea to posterior IOL). When not all of the latter four peaks are present, the instrument can make false assignments of those captured. False assignments can in many cases be corrected by manual editing.
Application of multiple linear regression (MLR) requires input parameters to be linearly independent of each other,5 and can lead to misleading regression relationships if the data set contains colinear parameters. Modern statistical techniques such as partial least squares (PLS) regression6 ,7 do not suffer this drawback. Our data contain AL and ACD, which are strongly colinear. We therefore chose to use PLS regression analyses employing the SIMCA-P+ (V.12) software package (Umetrics AB). The software finds the partial least square component, which is the direction in multidimensional space that has the greatest variance in terms of all parameters. It is the multidimensional analogue to the familiar least squares line in two-dimensional space. The influence of each input parameter in the prediction of the output parameter is calculated as a coefficient of its contribution to the PLS component.
The PLS regression found was used to compute the prediction ability (Q2), and the residual SD (RSD) by cross-validation (also known as ‘jack-knifing’). These statistics are similar to the goodness of fit (R2) and the SD in MLR. The general relations Q2≤R2 and RSD≥SD always hold. p Values to test statistical significance were also computed.
In the end, the programme can transform the PLS component coefficients to obtain regression relationships of the same type as those produced by MLR.
Results
The available preoperative data are summarised in table 1. The preoperative parameters in the table are those that were used by Holladay for the development of the Holladay 2 formula,8 except that he used mean corneal power (K), which is inversely proportional to CR. These two parameters contain the same information, but we prefer CR for regression, because it has the dimension of length as do the other physiological parameters.
Overview of preoperatively measured parameters
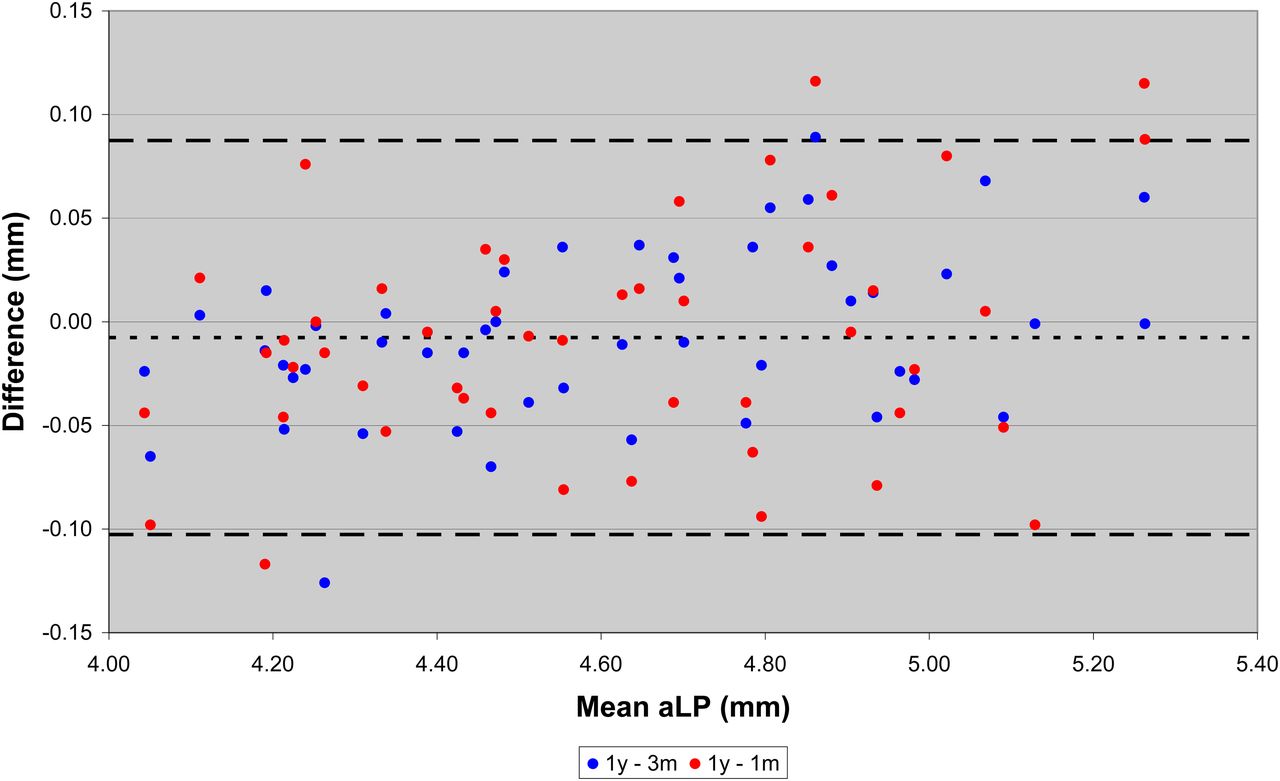
To test the reliability of the aLP values measured, we compared values taken at 1 month, 3 months and 1 year postoperatively. For 48 eyes, data were available for all three points in time. The Bland and Altman9 plot in figure 2 indicates that the mean is close to zero, with 95% limits of ±0.10 mm. The aLP values were thus obtained with good reproducibility and can be used with confidence. From figure 2, it can also be concluded that the IOL position is stable already at 1 month. Only 1 year postoperative data were used for regression analyses.

Bland-Altman plot of differences in measured anterior lens position (aLP) between 1 year and 3 months (blue dots) and 1 year and 1 month (red dots) against the mean aLP for all three points in time (N=48). The line with short dashes is the mean and the line with long dashes is the 95% limits for both series pooled.
The PLS regression coefficients for parameters in prediction of anterior IOL position for the two IOL models are shown in figure 3. It is seen that ACD is the strongest predictor, followed by AL, even though it is borderline for model ZA9003. The 95% limits cross the zero line for all other predictors. For LT and age, the coefficients are even of different sign for the two models, suggesting that their influence is random.

Partial least squares (PLS) regression coefficients for parameters in prediction of anterior intraocular lens (IOL) position for IOL models ZA9003 (3-piece; N=34) and ZCB00 (1-piece; N=41). The vertical bars show the 95% probability limits. ACD, anterior chamber depth; AL, axial length; CR, corneal radius; CW, corneal width; LT, lens thickness; Rx, refraction.
The following regression relationships were found:


Adding IOL thickness, which was provided by the manufacturer, to aLP produces the position of the posterior IOL surface, posterior lens position (pLP). The range of this quantity appeared very similar for the two models. The postoperatively measured aLP and calculated pLP are summarised in table 2 and plotted in figure 4.
Overview of postoperatively measured parameters
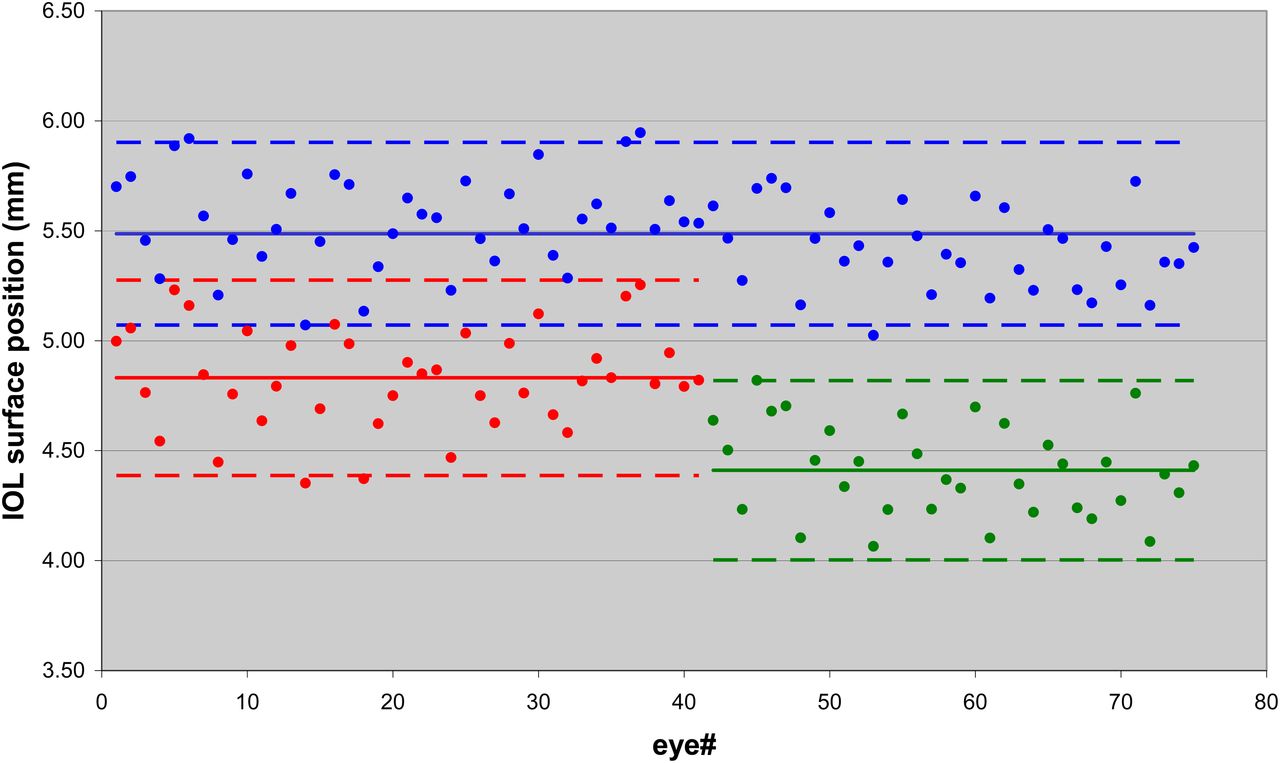
Measured intraocular lens (IOL) surface positions together with lines for means (continuous) and 95% limits (broken). Red is anterior lens position (aLP) for model ZA9003 (N=34). Green is aLP for model ZCB00 (N=41). Blue is posterior lens position (pLP) for both models pooled (N=75).
For the pooled data, the following relationships were found:

The PLS regression results for aLP for the two IOL models and pLP for both models pooled are summarised in table 3 for various combinations of prediction parameters. All prediction models are statistically significant (p<0.01), but it is clearly seen that virtually nothing is gained by including more parameters than AL and ACD, and that in fact ACD alone is sufficient as predictor. With a single predictor, PLS and MLR yield the same result.
Summary of PLS regression statistics for estimation of aLP for the IOL models ZA9003 (3-piece) and ZCB00 (1-piece) separately, and pLP for the two models pooled
There is no significant bias in the predicted aLP with regard to AL (figure 5A) or CR (figure 5B), using ACD as sole predictor. This holds true also for pLP. Regressions based on AL and ACD together as predictors show the same lack of bias.

Prediction error in anterior lens position (aLP), with anterior chamber depth (ACD) as sole predictor, plotted against axial length (AL) (A) and corneal radius (CR) (B) for both intraocular lens (IOL) models combined (N=70). There is no significant prediction bias against either parameter.
Discussion
At the onset of our study, we expected ACD and LT to be main predictors of postoperative IOL position. It is such a logical idea that the IOL should be at ACD plus some fraction of LT. The IOL must at any rate end up within the volume of the preoperative capsular bag. It was therefore in the first instance surprising to us to find that LT had virtually no predictive power on postoperative IOL position, although some of us were involved in another study,10 using continuous intraoperative optical coherence tomography, in which it was found that LT had minimal influence on IOL position.
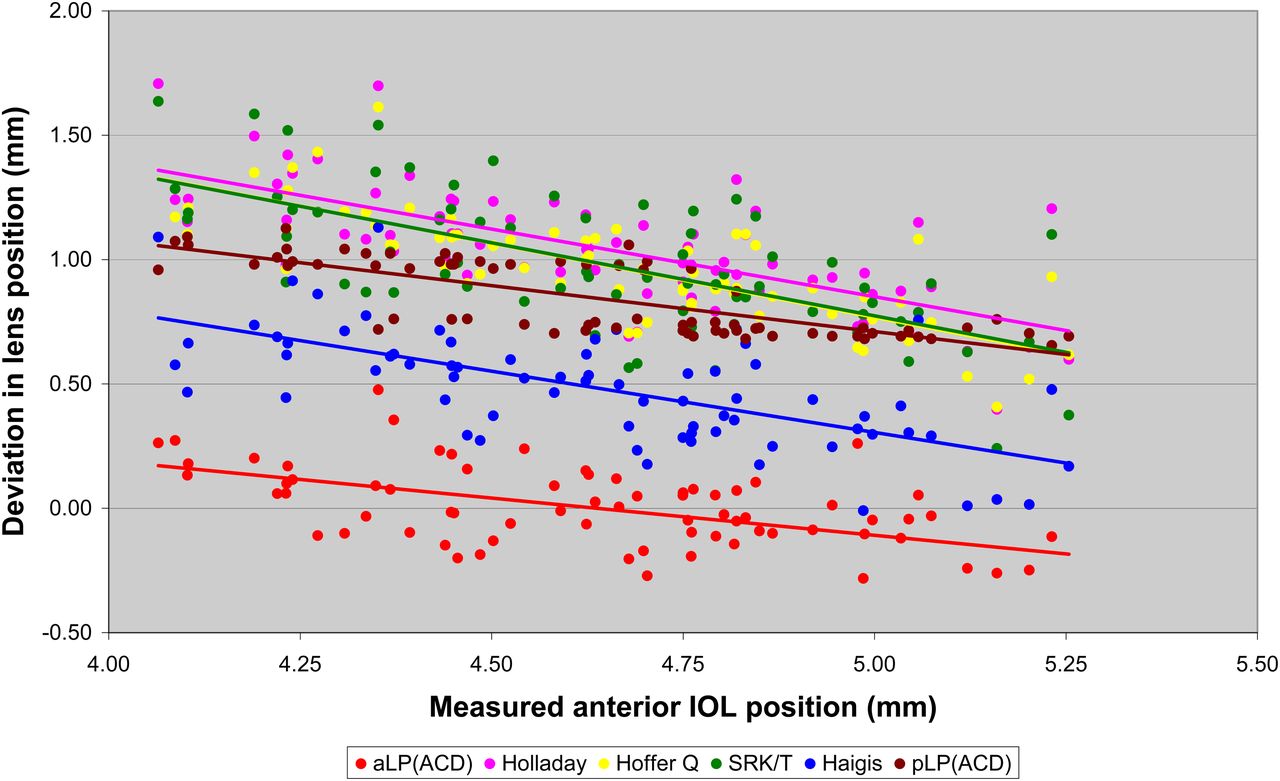
Prediction of postoperative IOL position from preoperative data is at the heart of IOL power calculation. Popular IOL power calculation formulas like Holladay,11 SRK/T,12 Hoffer Q13 and Haigis14 use different approaches to estimate IOL position. Because these formulas use thin lens optical theory for the power calculation, the IOL position is the plane of the ‘effective lens’, ELP, which is not the same as the actual position of either surface of the IOL. Figure 6 shows the difference between ELP calculated with the formulas using the formula constants published on the ULIB15 web page, together with measured aLP, and from it derived pLP. The slopes are a consequence of the fact that prediction based on regression will always produce a narrower distribution than measured values. It is nevertheless interesting to note that the slopes for the formulas are similar to those of aLP and pLP, bearing in mind that the constants to obtain ELP were found indirectly by regression to eliminate mean refractive error. The Holladay, SRK/T and Hoffer Q formulas cluster together slightly posterior to pLP, while the Haigis formula lies between aLP and pLP, that is, ‘within’ the preoperative capsule. The differences between the formulas are mainly due to the keratometric indices used.16 ELP formulas values are thus offset by a more or less fixed value from the actual position of the IOL. Comparison with the Holladay 2 formula8 could not be made, because its mathematical detail has not been published.
Deviation of lens position calculated in relation to anterior intraocular lens (IOL) surface (anterior lens position (aLP)) measured. Lens position for the formulas was calculated as effective lens position (ELP) in accordance with the published formulas, using formula constants taken from the ULIB15 web page. Positions of aLP and posterior lens position (pLP) were calculated in accordance with the formulas given in the Results section, using anterior chamber depth (ACD) as sole predictor. All formulas have a similar bias relative to the measured aLP, as indicated by the slope of the lines.
For exact IOL power calculation, the actual IOL position is required. Olsen17–19 has long been pursuing this issue. Olsen and Hoffmann20 have recently found LT to be a particularly useful parameter in obtaining IOL position with a formula of the form:
where middle lens position (mLP) is the mean of aLP and pLP and C is a constant related to an IOL model or type. In a large number of cases, they have measured anterior IOL position, our aLP and by adding half of the IOL thickness (known to them) obtained mLP. They used Lenstar LS900 (Haag-Streit AG) for the measurements, and derived C for several IOL types employing MLR.
Preussner et al21 ,22 have also looked into predicting postoperative IOL position from preoperatively known information for the purpose of IOL power calculation by ray-tracing. In one paper,23 three approaches were tested:

 of which the second is due to Olsen19. The third is not fully divulged in the paper, but is probably the same as given by Olsen and Hoffmann20 above. In the first equation, CT has been added to the expression given in the paper, which gives the distance with reference to posterior cornea.
Although we have much fewer cases than Olsen and Hoffmann,20 our mean, SD and range for LT (table 1) are very similar to theirs. If their slightly larger mean LT is due to differences between instruments or patient cohorts cannot be judged without making a comparative study between the instruments involved. With our data we obtain the results summarised in table 4. For model ZCB00 we find C=0.47, while Olsen and Hoffmann report C=0.46. Our data thus seem very consistent with theirs.
Comparison of IOL position algorithms for prediction of postoperative IOL position (mLP) in terms of preoperatively available information on the subset of our data that included data on LT
Table 4 also contains results obtained with the first two formulas of Preussner et al.23 The predictions of those give comparable or worse results compared with our formulas based on ACD as sole predictor.
About the reasons that we find no influence of LT and others20 ,21 do, can only be speculated. Application of MLR when input parameters are not linearly independent could be one reason (see Methods section). AL and ACD are linearly dependent. On the other hand, ACD and LT are not. However, the formula proposed by Olsen and Hoffmann20 has the coefficient for LT (the C constant) as sole variable for regression, which by necessity makes LT a significant predictor. Assuming that postoperative ACD plus half the IOL thickness is common to all IOL models21 might skew regression results if not exactly valid. Finally, confounding IOL position (ELP) prediction with IOL power calculation, as in popular power calculation formulas11–14, could induce false correlations in ELP prediction algorithms.
One of us (SN) was involved in a previous attempt24 to use anterior segment parameters to predict IOL position for subsequent IOL power calculation. ACD and LT were measured by contact A-scan as predictors to obtain regression formulas for ELP. Using those in combination with paraxial thick lens ray tracing did not predict postoperative refraction significantly better than SRK II,25 which was the most popular formula at the time.
In a later paper, Norrby et al26 tried several regression relationships to predict the lens haptic plane27 (LHP; envisaged as the equator of the capsular bag). Contact A-scan was used to measure distances and keratometry to measure CR. Paraxial thick lens ray tracing was applied to back-calculate the IOL position that produced the measured refraction, and from it compute LHP based on known IOL geometry. Preoperative parameters were used to compute regression relationships for LHP. The study applied MLR, because the first author (SN) was at the time not aware of the limitations of MLR when input parameters are linearly correlated. For the best fits, the prediction of postoperative refraction was on par with the most popular third-generation formulas.
Although we find ACD sufficient as sole predictor, we have also given formulas involving AL as additional predictor. Our AL range (table 1) is rather narrow (although it comprises about 90% of the population), and maybe dependence on AL could be expected towards the long and short ends of eye lengths, although of course our relationships are valid only for the range within which they were developed. On the other hand, Canovas and Artal28 have found ACD sufficiently accurate to predict measured IOL position (R2=0.8, N=19) for the purpose of finding the optimum IOL power by advanced ray tracing. Although their sample is small, their AL range (22.2–27.9 mm) extends to longer eyes than our sample.
In conclusion, we find that postoperative IOL position can be accurately predicted using ACD as sole predictor, and that adding more predictors does not improve accuracy but only requires more measurements to be done. Minimising the parameters involved minimises statistical noise and saves measurement effort in everyday clinical practice. On the other hand, AL is needed for the power calculation as such, and therefore requires no extra effort to include as predictor.
A next step will be to implement our prediction algorithms into IOL power calculation schemes. Before doing so, more data should be gathered, involving more IOL models, to investigate whether our finding that pLP is model independent is general or fortuitous. If it is general, neither mLP as suggested by Preussner et al23, nor LHP as suggested by Norrby27, can be. It must also be noted that the relationships presented in this paper in principle are valid only for measurements made with the IOLMaster software V.5, or instruments known to be mimicking it.
We hope that this paper will stimulate further investigations and fruitful discussions about the important topic of predicting postoperative IOL position, with an open mind to alternative statistical methods.
Acknowledgments
The authors acknowledge a proportion of their financial support from the Department of Health through the award made by the National Institute for Health Research to Moorfields Eye Hospital NHS Foundation Trust and UCL Institute of Ophthalmology for a Specialist Biomedical Research Centre for Ophthalmology. The views expressed in this publication are those of the authors and not necessarily those of the Department of Health.
References
Footnotes
Contributors SN: concept of paper, writing paper, data analysis. RB: data analysis. NH: data collection, critical review of the manuscript. YN: data collection. OF: study design, surgeon, critical review of the manuscript.
Competing interests This study was supported by AMO, Santa Ana, California, USA. SN is retired from AMO, but has a consultancy agreement. OF is scientific advisor to AMO.
Ethics approval 07/H0806/93—London, UK.
Provenance and peer review Not commissioned; externally peer reviewed.