Article Text

Abstract
Between March and May 2020, Japan experienced a lockdown due to the COVID-19 crisis. Empty roads possibly triggered speed-related traffic violations that caused fatal motor vehicle collisions (MVCs). Using police data on the monthly number of fatal MVCs between January 2010 and February 2020 in which motor vehicle drivers were at fault, we forecasted the numbers of fatal MVCs due to the speed-related violations during the lockdown and compared these with those observed. We also compared the observed to forecasted using the ratio of the number of speed-related fatal MVCs to that of non-speed related fatal MVCs. The observed numbers of speed-related fatal MVCs were within the 95% CIs of the forecasted numbers. The observed ratio was higher than the forecasted ratio in April (p=0.016). In the second month of the lockdown, drivers were more likely to commit speed-related violations that caused fatal MVCs than before the lockdown.
- motor vehicle � occupant
- time series
- mortality
- behaviour
- speed
This article is made freely available for use in accordance with BMJ’s website terms and conditions for the duration of the covid-19 pandemic or until otherwise determined by BMJ. You may use, download and print the article for any lawful, non-commercial purpose (including text and data mining) provided that all copyright notices and trade marks are retained.
https://bmj.com/coronavirus/usageStatistics from Altmetric.com
Introduction
In the wake of the spread of COVID-19 in Japan in early 2020, the Japanese government requested that all primary and secondary schools close temporarily from early March, declared states of emergency in April and lifted them in late May. This mild lockdown decreased the traffic volume and motor vehicle collisions (MVCs) significantly. The number of MVCs in March, April and May were smaller by 17.6%, 36.2% and 40.7% than those of the same months of the previous year, respectively.1 However, the number of road deaths was decreased only by 8.4%, 19.9% and 7.6% in these months.1
This gap might be partly due to the change in driver behaviour during the lockdown. According to media reports, empty roads triggered some speed-related traffic law violations among drivers, such as speeding, failing to stop at a stop sign, red-light running and failing to yield to pedestrians.2–4 For example, in Tokyo, in March 2020, the number of tickets issued for speeding increased by 52% compared with that of March 2019,3 and the police officially enhanced enforcement for speeding in May.2 However, the number of tickets issued is not a direct measure of road injuries but a combined measure of the level of enforcement and road users’ behaviour. So, to examine the potential change in driver behaviour and its public health consequences, we need a more direct indicator.
We consider that the number of fatal MVCs would be such an indicator, and it is unknown whether those due to the speed-related traffic violations (‘speed-related fatal MVCs’) increased during the lockdown. It is also unknown whether they increased relative to fatal MVCs due to violations that are not speed related (‘non-speed-related fatal MVCs’). Therefore, in this study, we aimed to answer the following research questions: did the number of speed-related fatal MVCs change during the lockdown? Was the change in the number of speed-related fatal MVCs different from that in the number of non-speed related fatal MVCs? Answering these research questions would inform road users and traffic law enforcement authorities of the change in driver behaviour that caused fatal MVCs and contribute to road safety during potential future lockdowns.
Methods
Study design
This was a time-series study. Using police-reported fatal MVCs data in Japan between January 2010 and February 2020, we forecasted the monthly number of fatal MVCs per day from March to May 2020, when Japan had the COVID-19 lockdown. We compared the forecasted number of speed-related fatal MVCs to that observed in each month. We repeated the comparison between the observed and forecasted using the ratio of the number of speed-related fatal MVCs to that of non-speed related fatal MVCs as the outcome variable. In this analysis, we assumed that the drivers who continued driving during the lockdown were at least as likely as the overall drivers before the lockdown to commit non-speed related violations that caused fatal MVCs.
Data sources and variables
We obtained the monthly number of fatal MVCs in which motor vehicle drivers were at fault between January 2010 and May 2020 from the police.1 They are collected according to a standardised definition of measurements, and fatality is defined as a death that occurred within 24 hours of the MVC.5 The police determined a traffic violation that mainly caused each MVC, and the data were disaggregated by those violations. Based on media reports,2–4 we deemed the following violations in the data as speed-related ones that might have increased during the lockdown: ‘speeding’, ‘driving at unsafe speed’ for road, traffic and vehicle conditions, ‘stop sign violation’ and ‘slowing violation’ at stop and slow-down signs, respectively, ‘failure to stop at railway crossing’, ‘disregarding traffic signal’ and ‘impeding pedestrians’. These violations are being called ‘speed-related violations’ because they occur as a result of inappropriate vehicle speed. For example, a stop sign violation means that the driver failed to control the vehicle speed to 0 at the stop sign. The non-speed-related violations included ‘careless driving’, ‘improper steering and/or braking’, ‘failure to make safety check’ around the vehicle, ‘not keeping eyes on the road’ and ‘road or lane infringement’, which do not involve an inappropriate vehicle speed. We excluded approximately 2% of MVCs that had a missing value (‘unknown’) for the violation status from the analysis. To describe characteristics of the at-fault drivers, we also obtained the fatal MVCs data disaggregated by their age or vehicle type. Unfortunately, data simultaneously disaggregated by two or more of the three variables (traffic violation, age and vehicle type) were not available. We also obtained the biannual number of police-reported traffic violations from January to June of 2015–2020.1
Statistical analysis
First, we described the data and displayed the monthly average number of fatal MVCs per day and that of speed-related fatal MVCs per day, using the police data. We also displayed the monthly observed ratio of the number of speed-related fatal MVCs to that of non-speed related fatal MVCs.
To forecast the number and ratio of fatal MVCs during the lockdown, we applied seasonal autoregressive integrated moving average (ARIMA) models to the data before the lockdown, that is, from January 2010 to February 2020. ARIMA models are used to analyse time-series data, where the value of a variable at time t ( ) is modelled by its past values (
 , …,
, …,  or autoregressive terms) and its past prediction errors (
 ,
,  , …,
, …,  or moving average terms).6 When the data have an upward or downward trend, differencing is used to meet the model’s assumptions. When the data have seasonality, seasonal terms are used to model
  by its past values of the previous periods (eg,
  , …,
, …,  when the data are monthly) and corresponding prediction errors (
 ,
,  , …,
, …,  in the example).6 We denote seasonal ARIMA models by ARIMA(p,d,q)×(P,D,Q)s, where p is the order of the autoregressive term, d is the order of differencing, q is the order of the moving average term, P, D and Q are their seasonal terms, respectively, and s is the seasonal period. We examined the need for differencing and the potential dependence orders based on the displayed data and the autocorrelation and partial autocorrelation functions of the data.6 Then, we examined the normality of residuals and the Ljung-Box-Pierce Q-statistic of the models to examine their fit.6 When multiple models showed a good fit, we selected the best model based on the Akaike Information Criterion.6 Finally, we forecasted the number and ratio of MVCs from March to May 2020 using the selected models and compared them with those that were observed.
We conducted all the statistical analyses using R V.4.0.2. We used the acf2, sarima and sarima.for functions of the astsa package to build seasonal ARIMA models and to forecast the number and ratio of MVCs.7 All p values reported are two sided.
Patient and public involvement
We did not involve the study participants or the general public of Japan in our research. We do not plan to involve them in disseminating the study results beyond usual media coverage.
Results
Between January 2010 and May 2020, the police recorded 37 160 fatal MVCs, of which 8521 were speed-related and 791 had a missing value for the violation status. Of the 37 160 fatal MVCs, 4%, 70%, 13% and 12% were caused by drivers aged under 20 years, between 20 and 64 years, between 65 and 74 years and aged 75 years or over; and 57%, 29% and 13% of the at-fault drivers were in passenger vehicles, cargo vehicles and motorcycles, respectively. From 2015 to 2020, the total number of police-reported traffic violations from January to June steadily decreased from 4 728 683 to 3 512 656, but the number of some speed-related violations, such as speeding, impeding pedestrians, failure to stop at stop sign and failure to stop at railroad crossing increased between 2019 and 2020 (online supplemental table 1).
Supplemental material
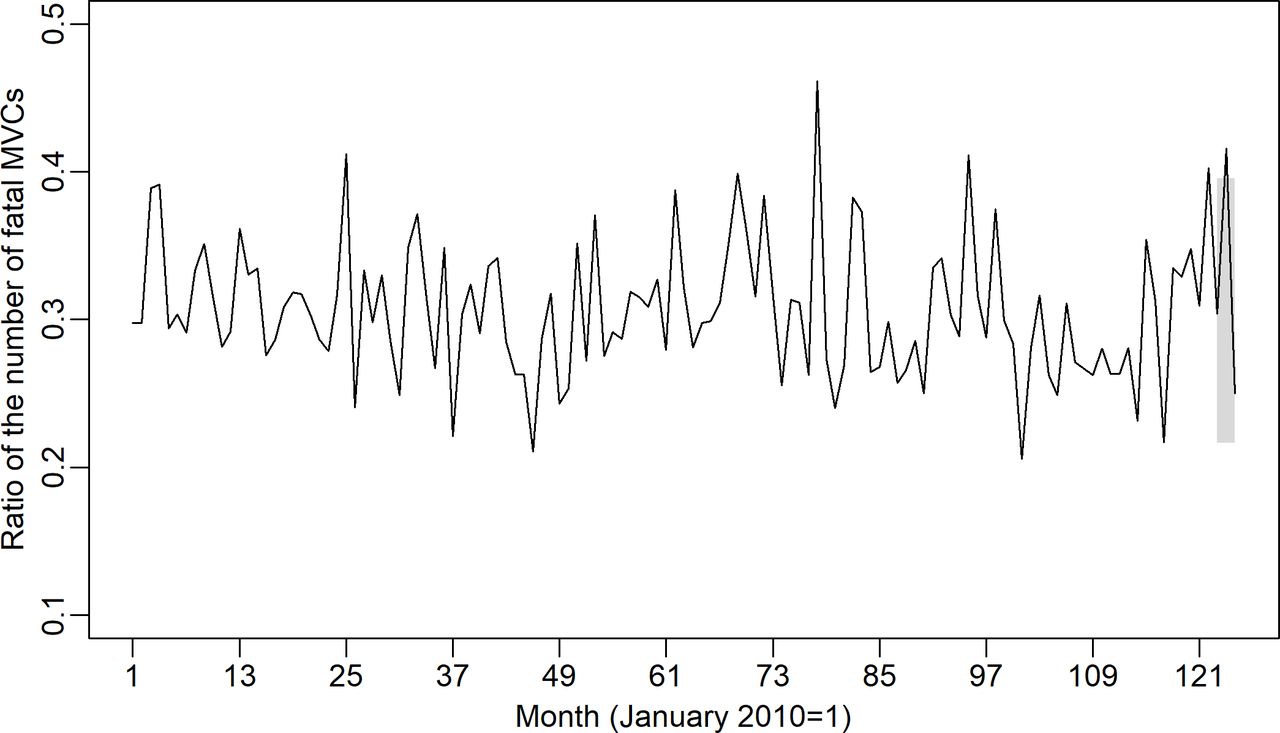
Figure 1 shows the monthly trend of the numbers of speed-related and non-speed related fatal MVCs per day, and both exhibited a decreasing trend with a seasonal pattern. Figure 2 shows the monthly trend of the ratio of the number of speed-related fatal MVCs to that of non-speed related fatal MVCs, and the ratio was around 0.3 without any apparent trends or seasonal patterns. Online supplemental table 2 shows the data for these analyses, that is, the monthly number of fatal MVCs stratified by the traffic violation that mainly caused each MVC from January 2010 to May 2020.
Supplemental material

The time trend of the monthly average number of fatal motor vehicle collisions (MVCs) and those due to speed-related traffic violations per day in Japan between January 2010 and May 2020. *The grey area shows the 95% CIs of the forecasted numbers of speed-related fatal MVCs per day between March and May 2020 based on the time-series analysis.
The time trend of the ratio of the monthly number of fatal motor vehicle collisions (MVCs) due to speed-related traffic violations to that of fatal MVCs whose cause was not a speed-related traffic violation in Japan between January 2010 and May 2020. *The grey area shows the 95% CIs of the forecasted ratio of the number of speed-related fatal MVCs to that of non-speed related fatal MVCs between March and May 2020 based on the time-series analysis.
The best seasonal ARIMA model for the monthly number of speed-related fatal MVCs per day had a structure of ARIMA(0,0,0)×(0,1,1)12. The grey area in figure 1 shows the 95% CIs of the forecasted numbers of speed-related fatal MVCs per day between March and May 2020. All of the observed numbers (solid line) were within the intervals.
The best ARIMA model for the ratio of the number of speed-related fatal MVCs to that of non-speed related fatal MVCs had a structure of ARIMA(0,0,0), that is, it was best described as white noise. The grey area in figure 2 shows the 95% CIs of the forecasted ratios between March and May 2020. The observed ratio was above the upper limit of the 95% CI of the forecasted ratio (point estimate 0.306; 95% CI 0.217 to 0.396) only in April (0.416, p=0.016).
Discussion
During the COVID-19 lockdown in Japan, the observed number of speed-related fatal MVCs was well within the range forecasted from the past data. However, the observed ratio of the number of speed-related fatal MVCs to that of non-speed-related fatal MVCs was higher than the forecasted value in April 2020, the second month of the lockdown (0.416 vs 0.306, p=0.016). This result indicates that the drivers who continued driving in the middle of the lockdown were more likely to commit the speed-related violations that caused fatal MVCs than the overall drivers before the lockdown.
One of the strengths of our study is that we used the complete 10-year data on fatal MVCs of over 120 million people, and this enabled us to evaluate the change in the number of the hard health outcome, that is, fatal MVCs. In addition, our findings would be generalisable and informative to countries that share similar contexts, especially where vehicle speed, speeding violations or road deaths are reported to have increased during the lockdown.8 9 To our knowledge, this is the first study that examined potential changes in fatal MVCs due to specific traffic violations among drivers during a COVID-19 lockdown. However, a limitation of our study is that we lack the data that would enable us to examine the reason behind the increase in the ratio only in April. A rather large decrease in the ratio between April and May 2020 might be attributable to enhanced speed enforcement by the police.2 Additionally, we were unable to explore potential associations between driver and vehicle characteristics and fatal MVCs, since the data available were not simultaneously disaggregated by two or more variables.
In conclusion, the COVID-19 lockdown in Japan triggered the speed-related traffic violations that caused fatal MVCs during part of the lockdown. It is necessary for road users and law enforcement authorities to understand that the drivers who remain on the road during a lockdown can be at increased risk of committing such violations that result in fatal MVCs.
What is already known on the subject
Japan had a lockdown due to COVID-19 between March and May 2020.
The lockdown significantly reduced traffic volume and motor vehicle collisions.
The empty roads possibly triggered speed-related violations among drivers.
What this study adds
There is no evidence that the absolute number of fatal motor vehicle collisions due to speed-related violations increased during the lockdown.
However, in April 2020, there was a relative increase after adjusting for the number of fatal collisions due to other violations.
Supplementary materials
Supplementary Data
This web only file has been produced by the BMJ Publishing Group from an electronic file supplied by the author(s) and has not been edited for content.
Footnotes
Contributors HI conceived and designed the study, obtained and analysed the data and drafted the manuscript. LA and SC made comments that led to substantial revisions of the manuscript, and all authors approved of the final version.
Funding The authors have not declared a specific grant for this research from any funding agency in the public, commercial or not-for-profit sectors.
Competing interests None declared.
Patient consent for publication Not required.
Provenance and peer review Not commissioned; externally peer reviewed.
Supplemental material This content has been supplied by the author(s). It has not been vetted by BMJ Publishing Group Limited (BMJ) and may not have been peer-reviewed. Any opinions or recommendations discussed are solely those of the author(s) and are not endorsed by BMJ. BMJ disclaims all liability and responsibility arising from any reliance placed on the content. Where the content includes any translated material, BMJ does not warrant the accuracy and reliability of the translations (including but not limited to local regulations, clinical guidelines, terminology, drug names and drug dosages), and is not responsible for any error and/or omissions arising from translation and adaptation or otherwise.