
Novel Fingertip Image-Based Heart Rate Detection Methods for a Smartphone

 ,
, 
Abstract
:1. Introduction
2. Materials
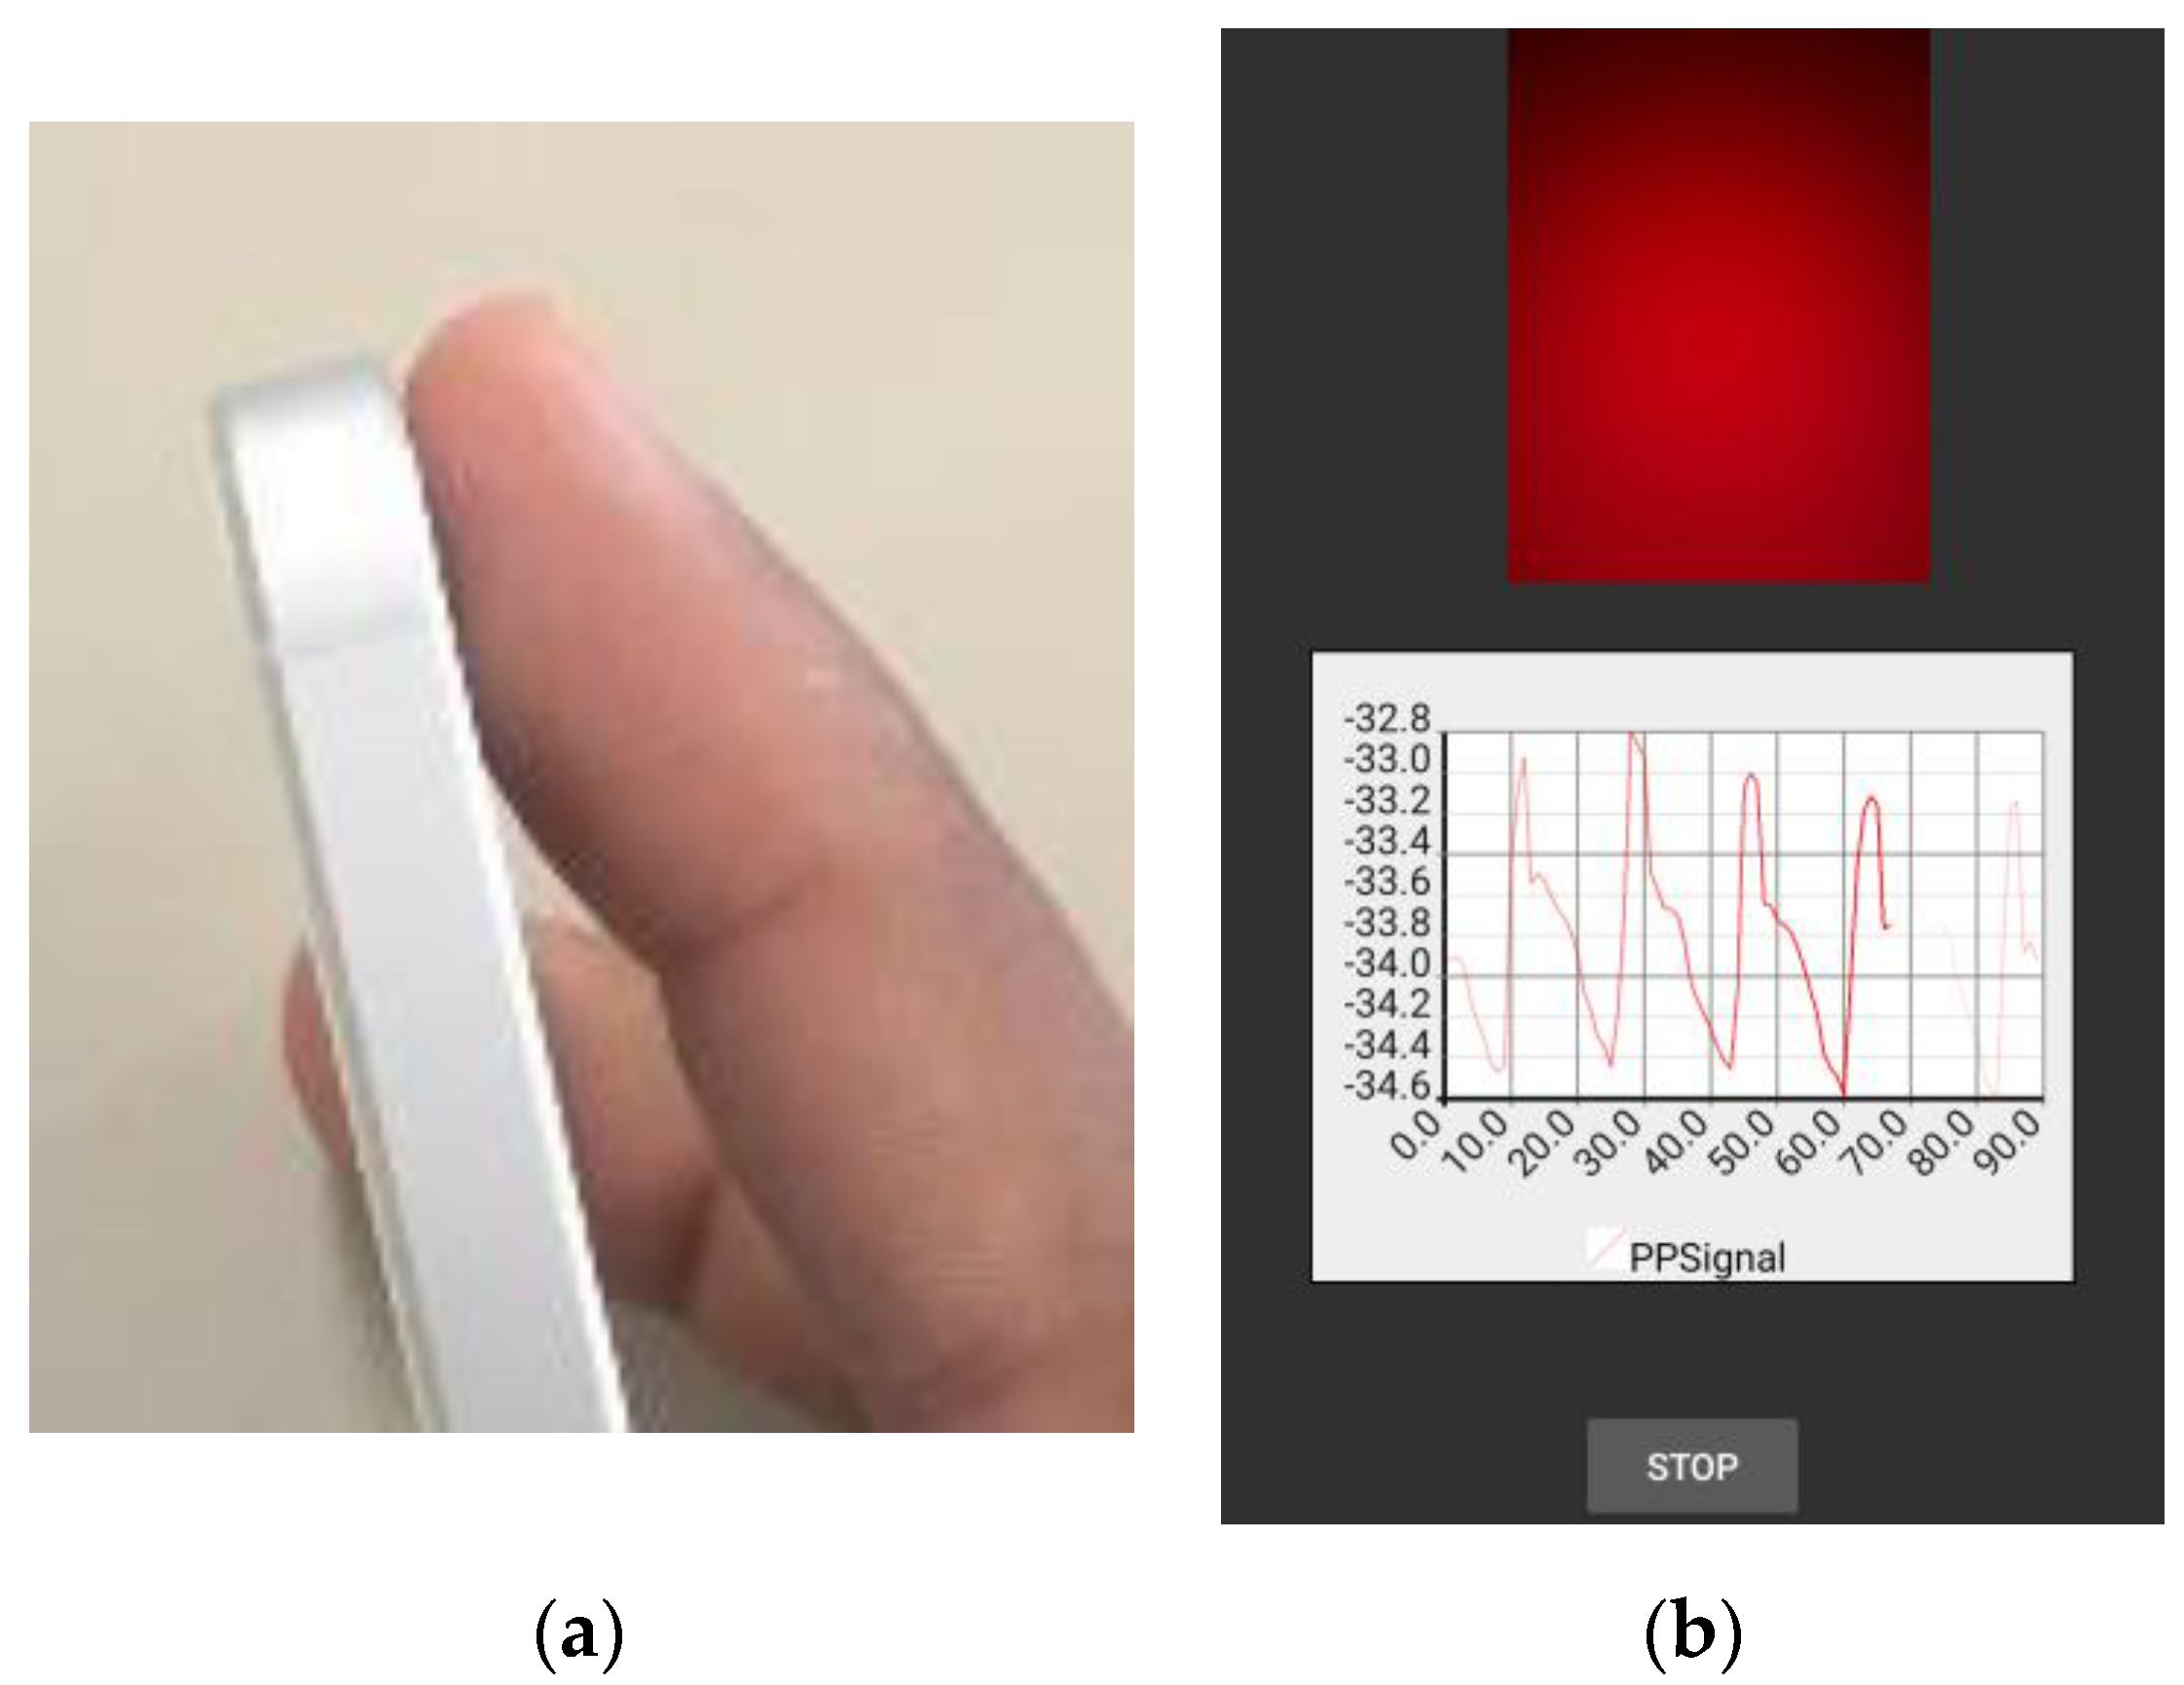
2.1. Experimental Protocol
2.2. Preprocessing
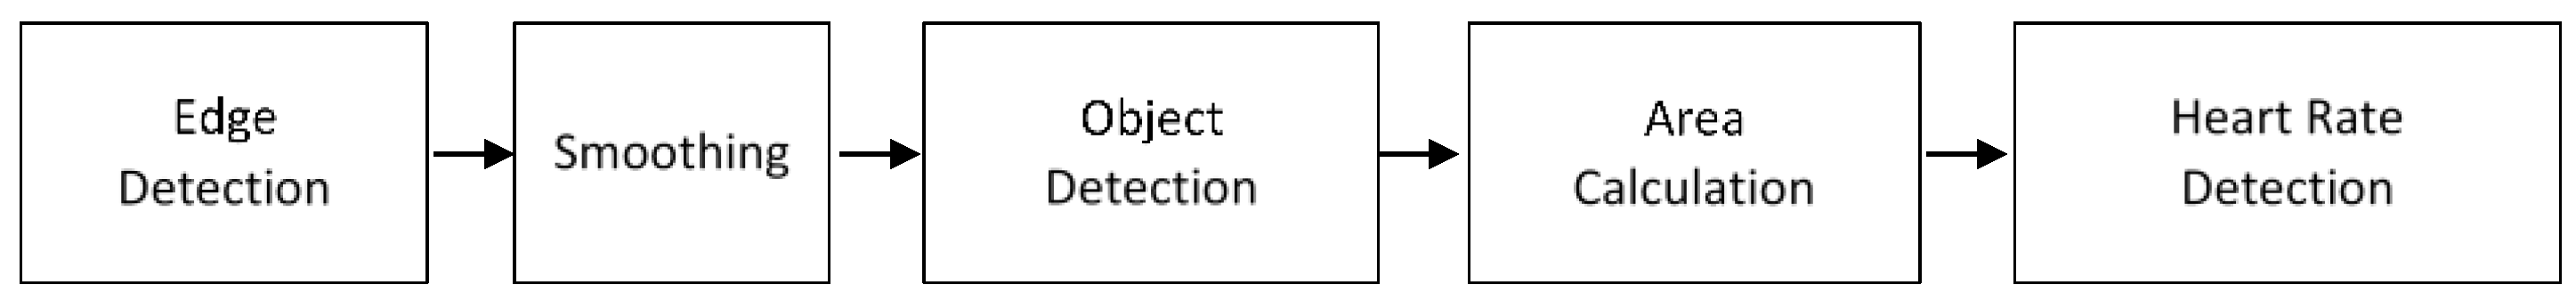
3. Methods
3.1. Fingertip Curve Line Movement-Based Detection
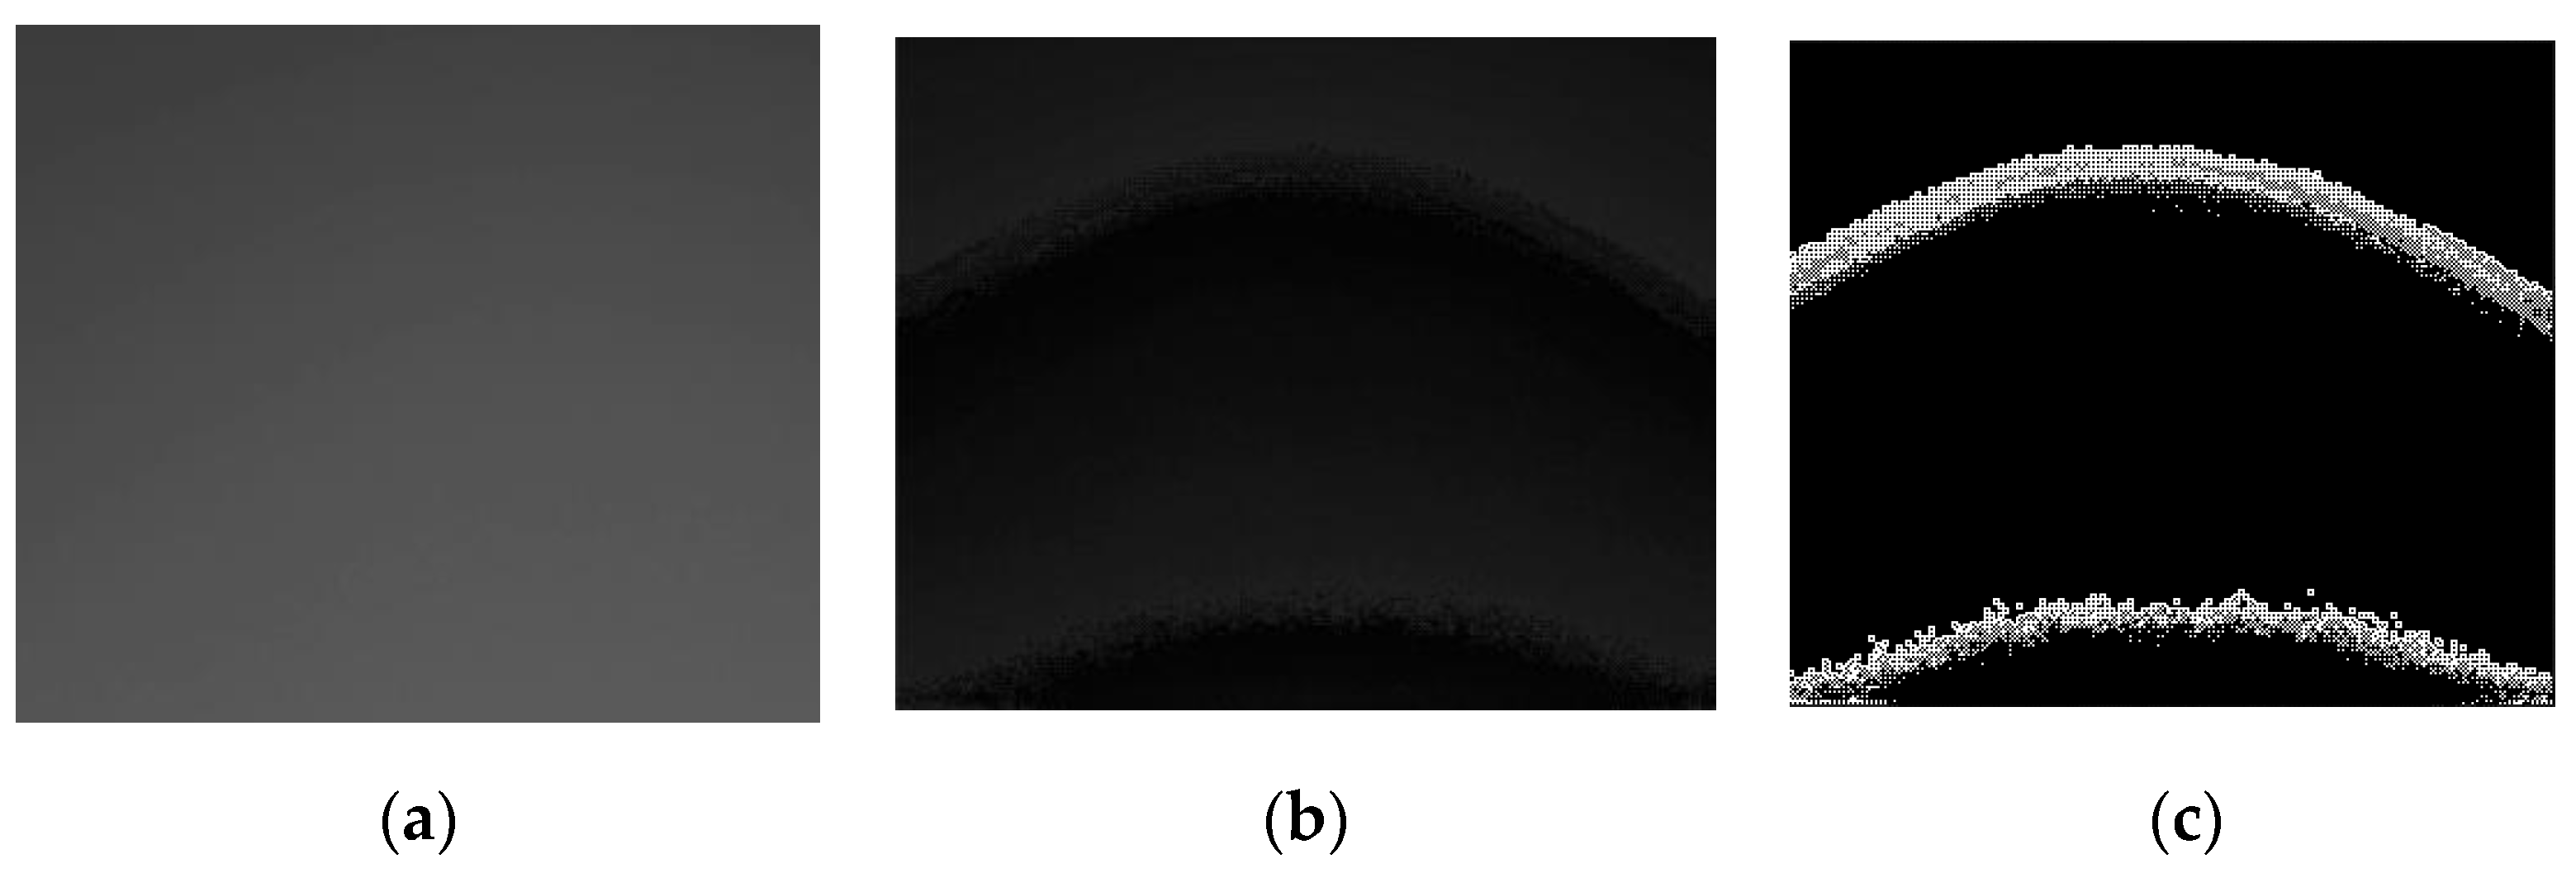
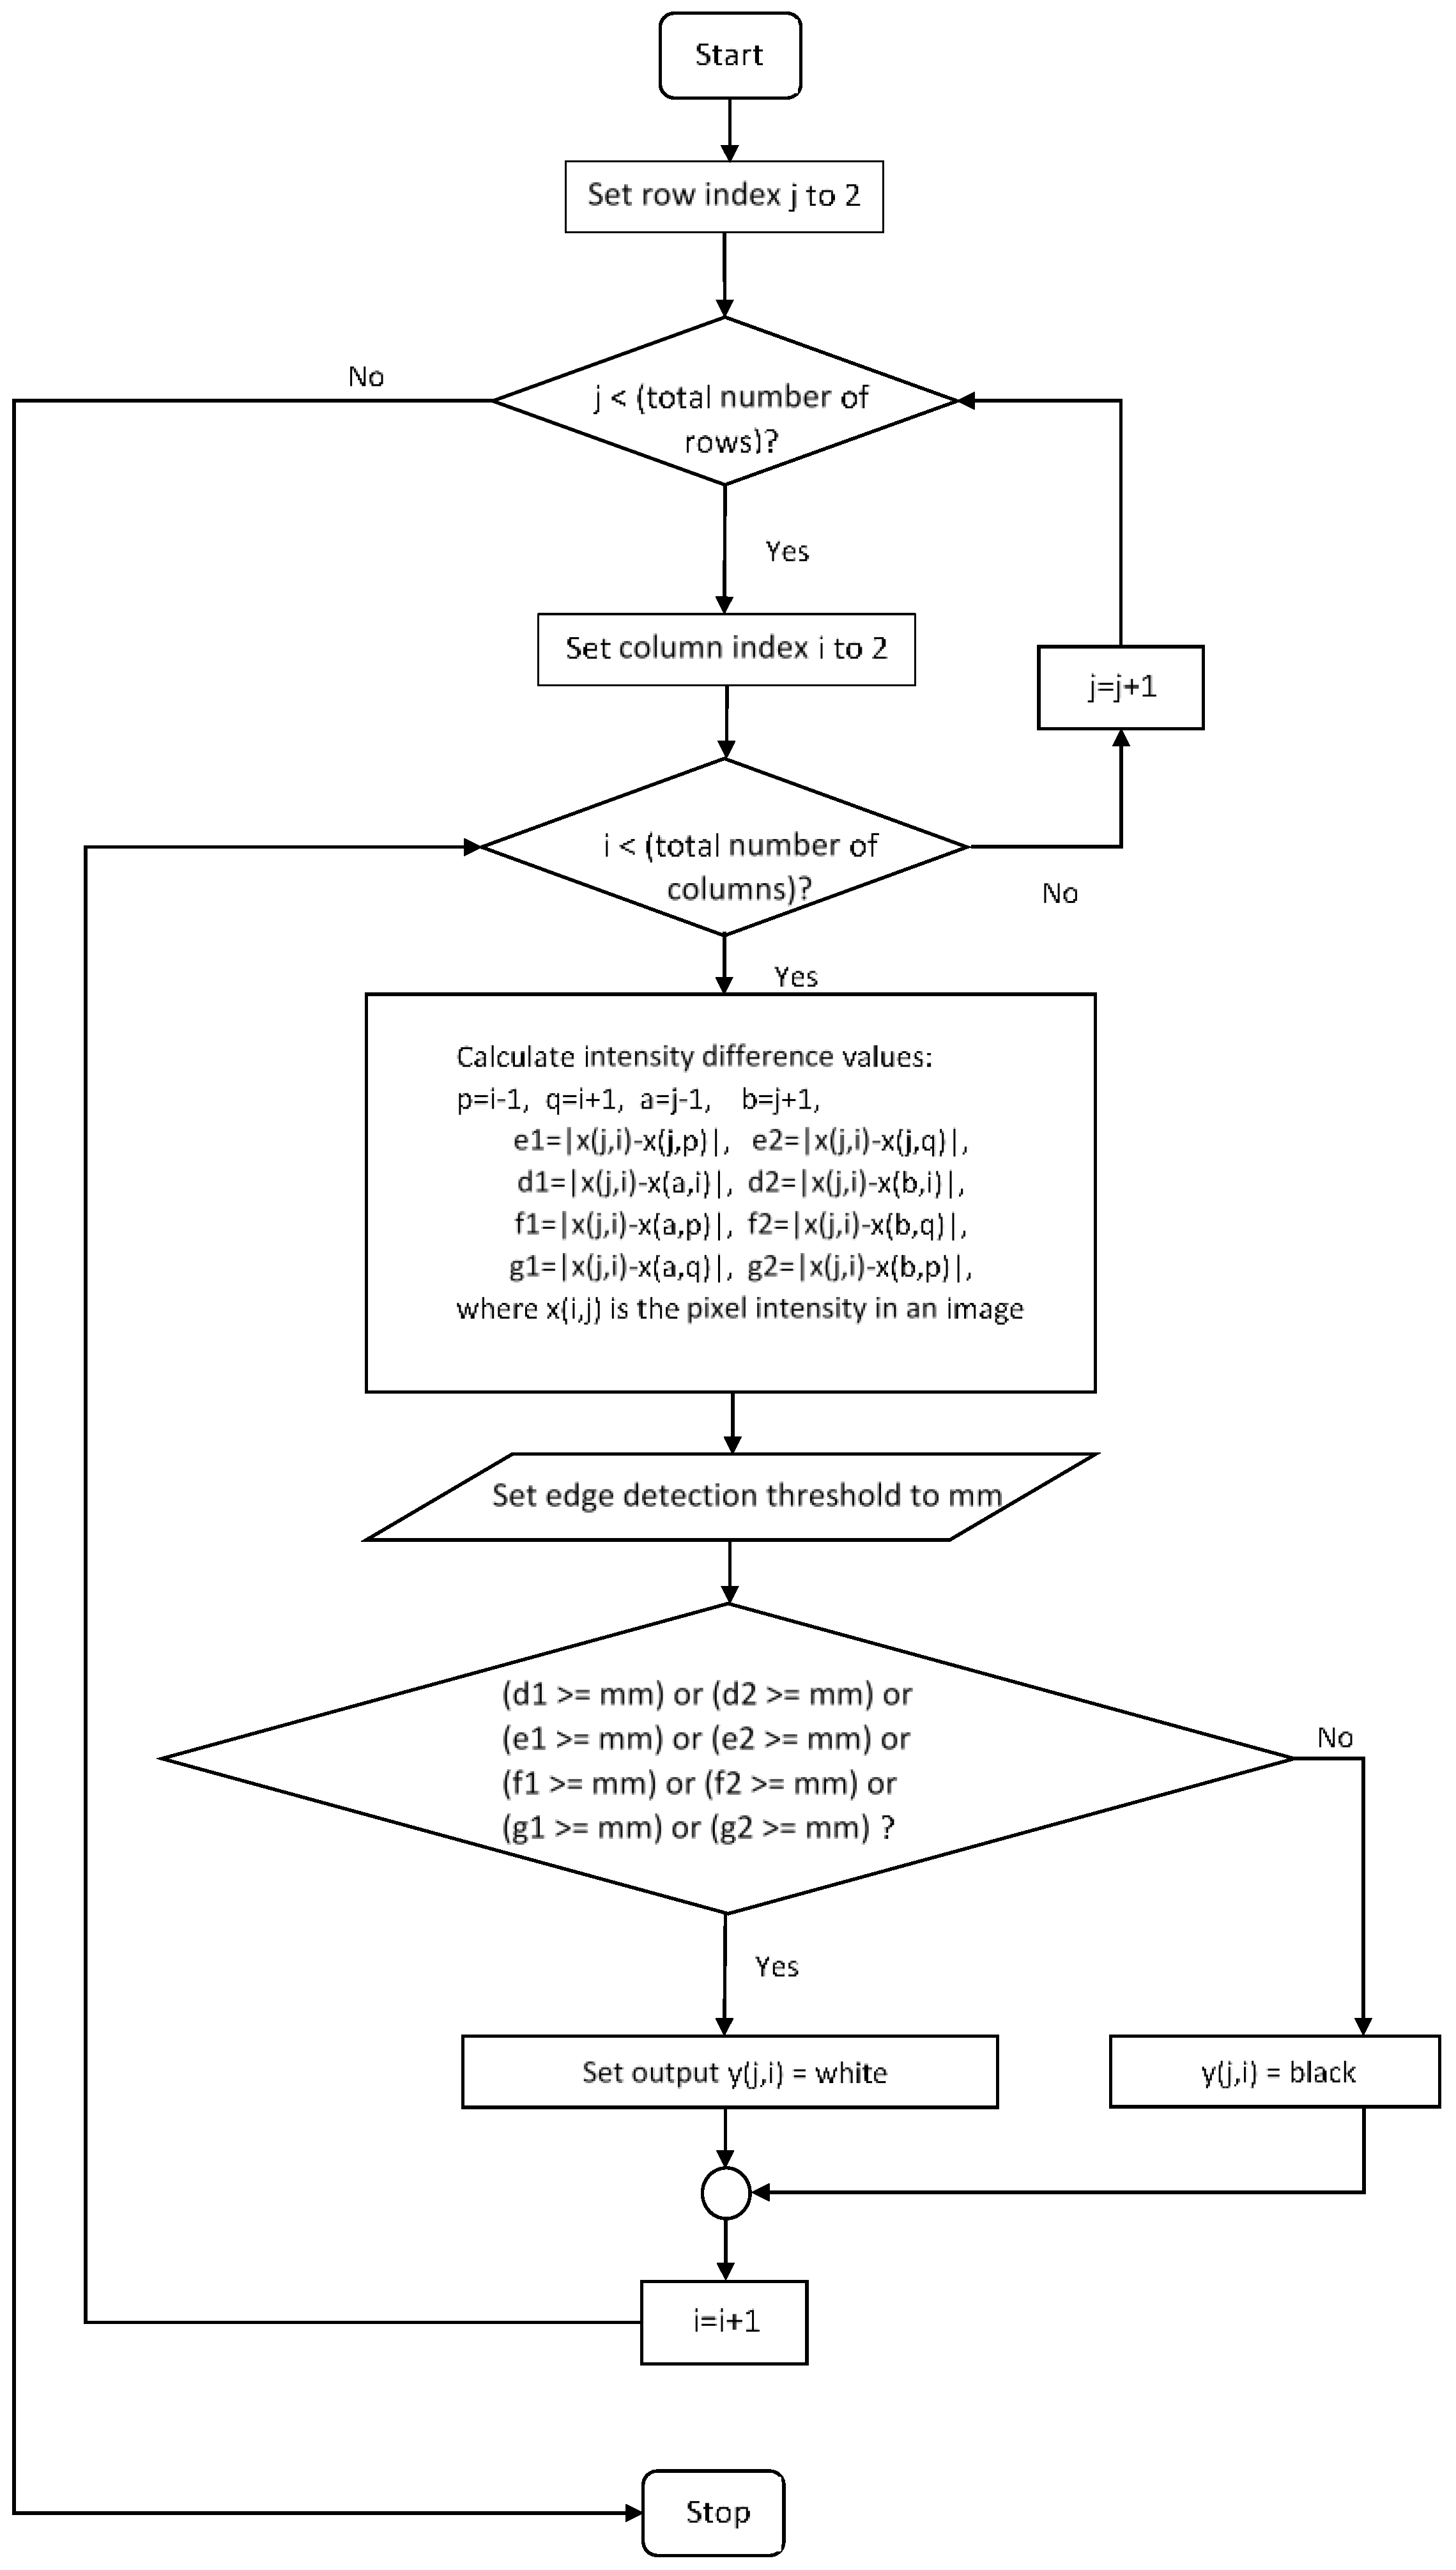
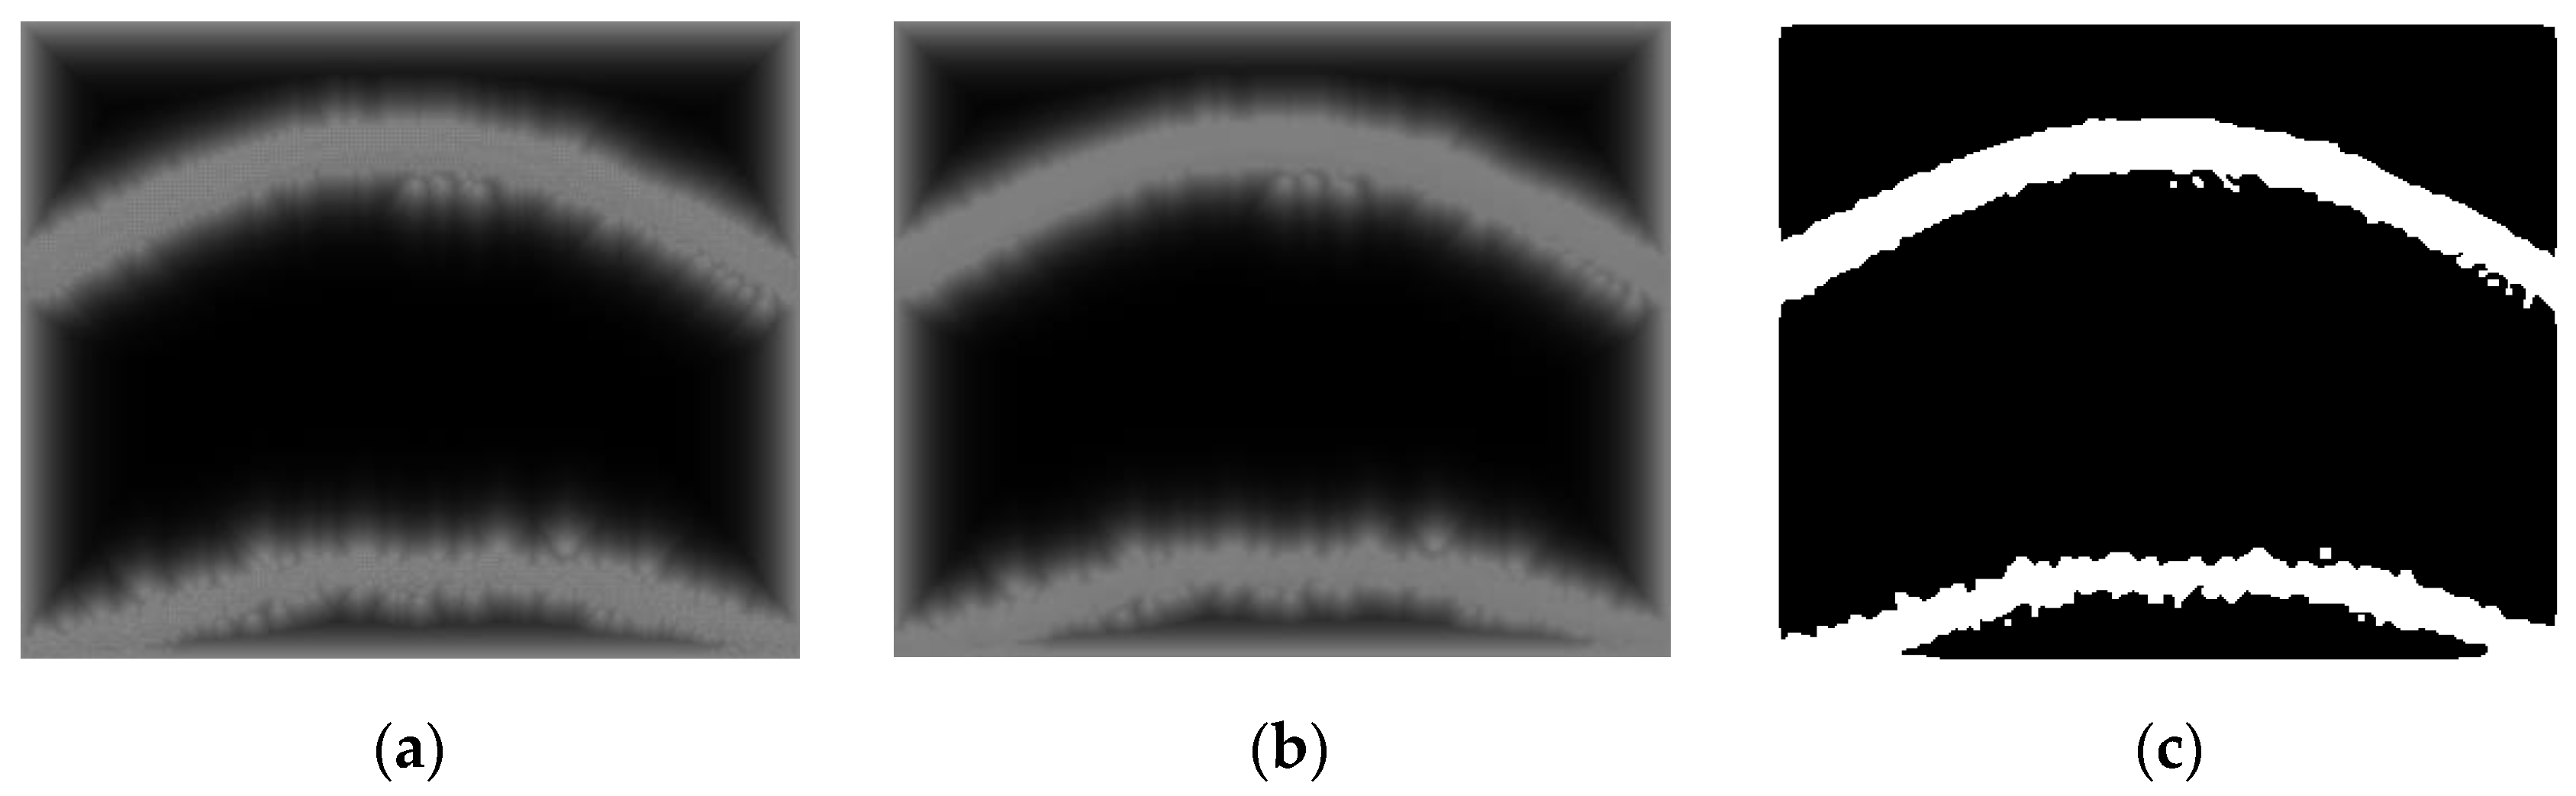
3.1.1. Edge Detection
3.1.2. Smoothing
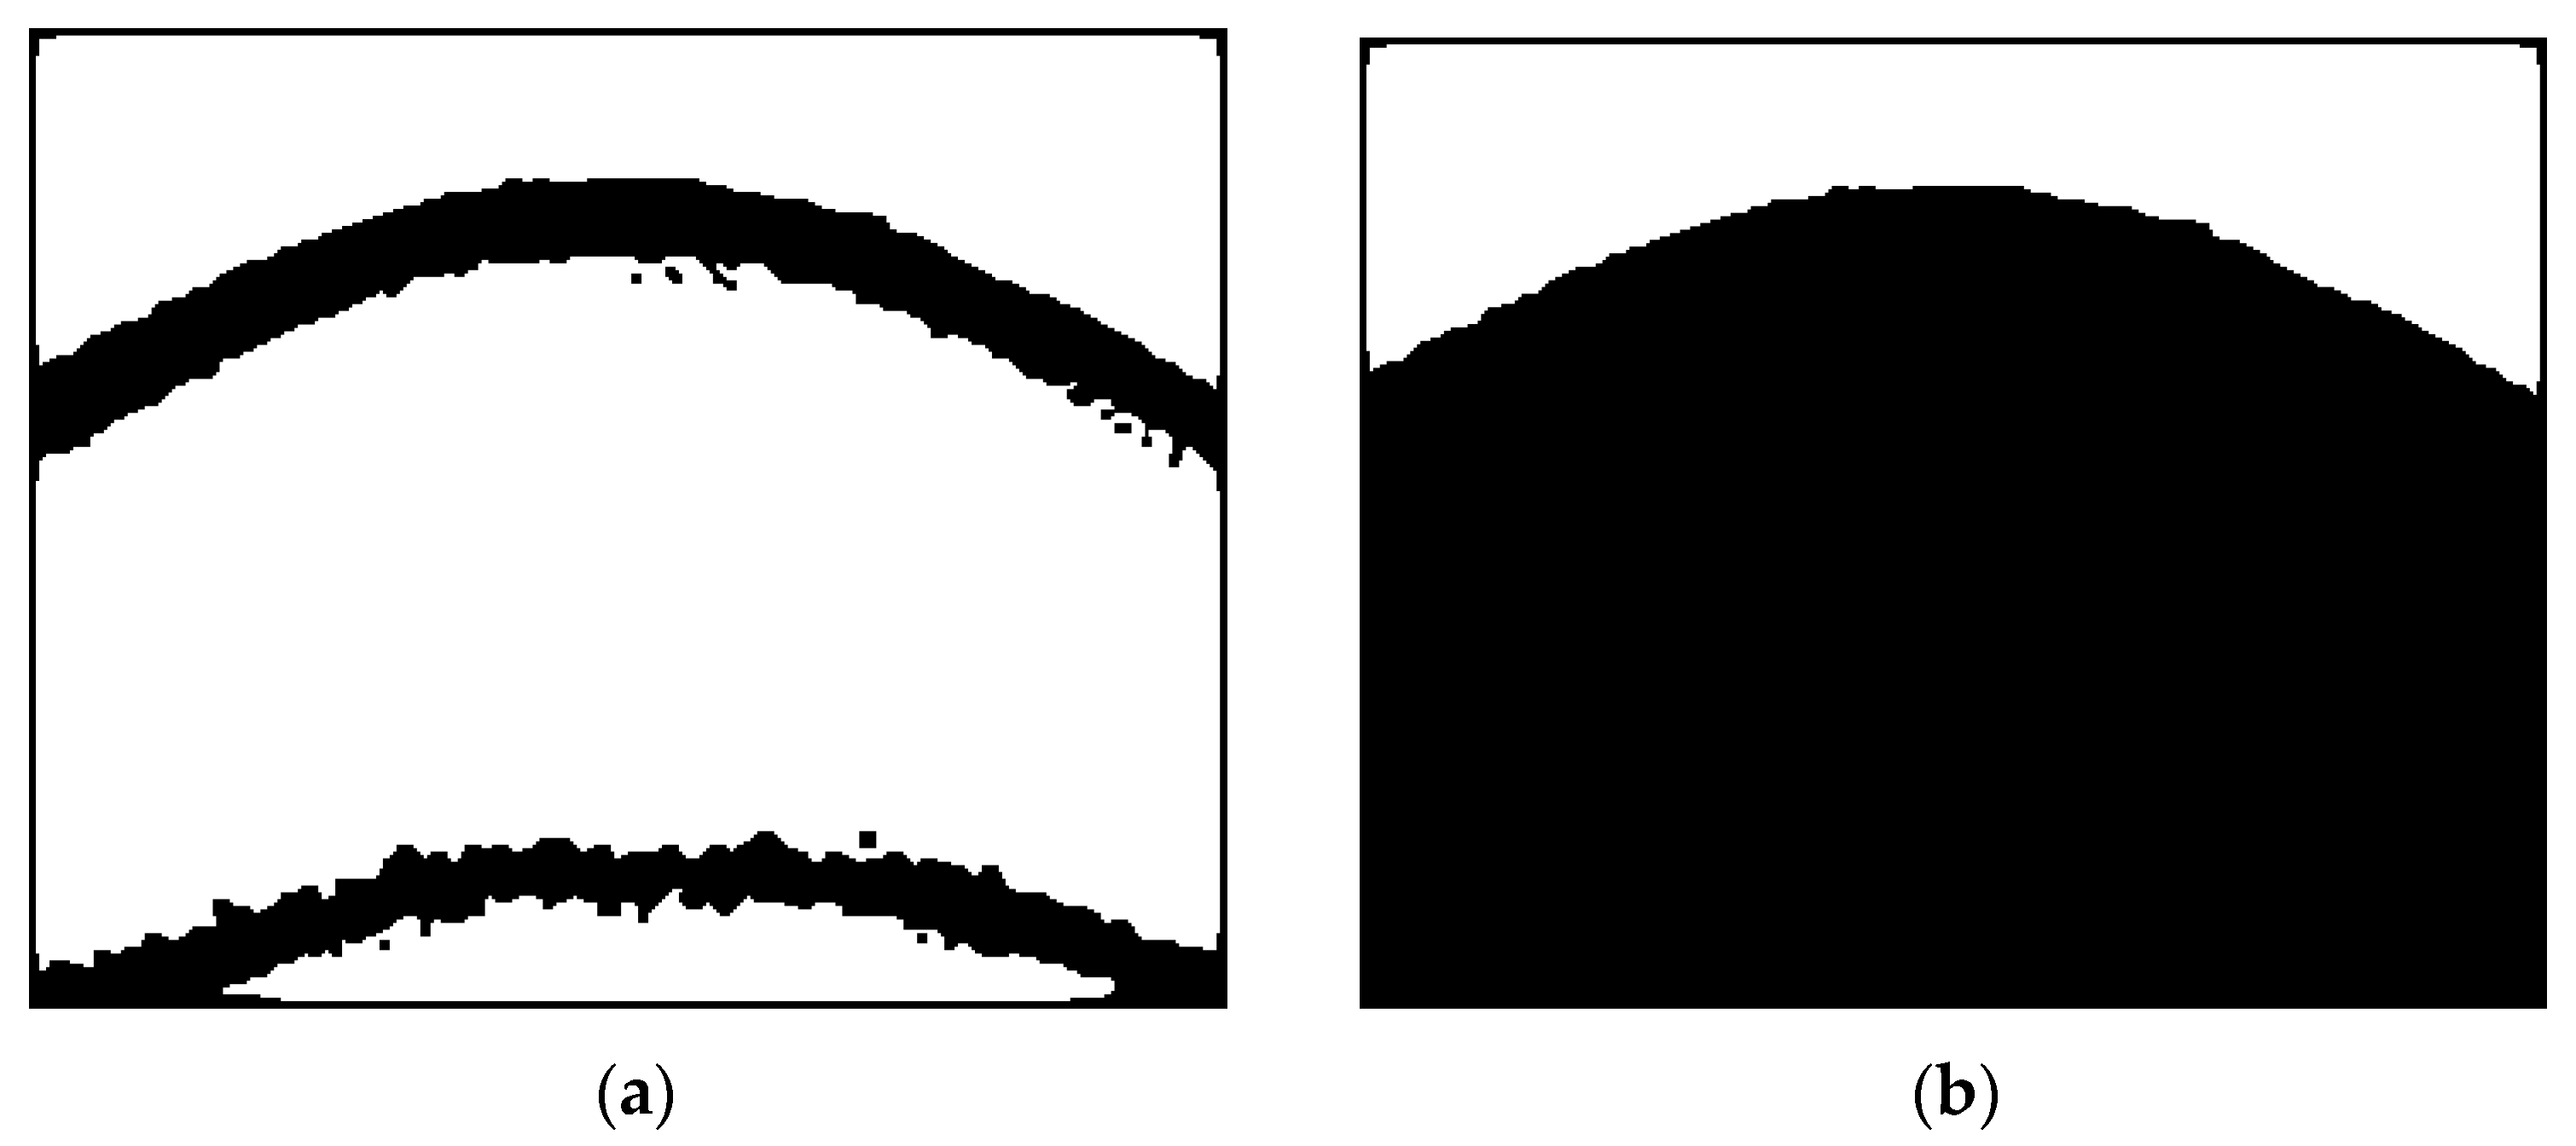
3.1.3. Fingertip Curved Region Detection
3.1.4. Heart Rhythm and Rate Detection
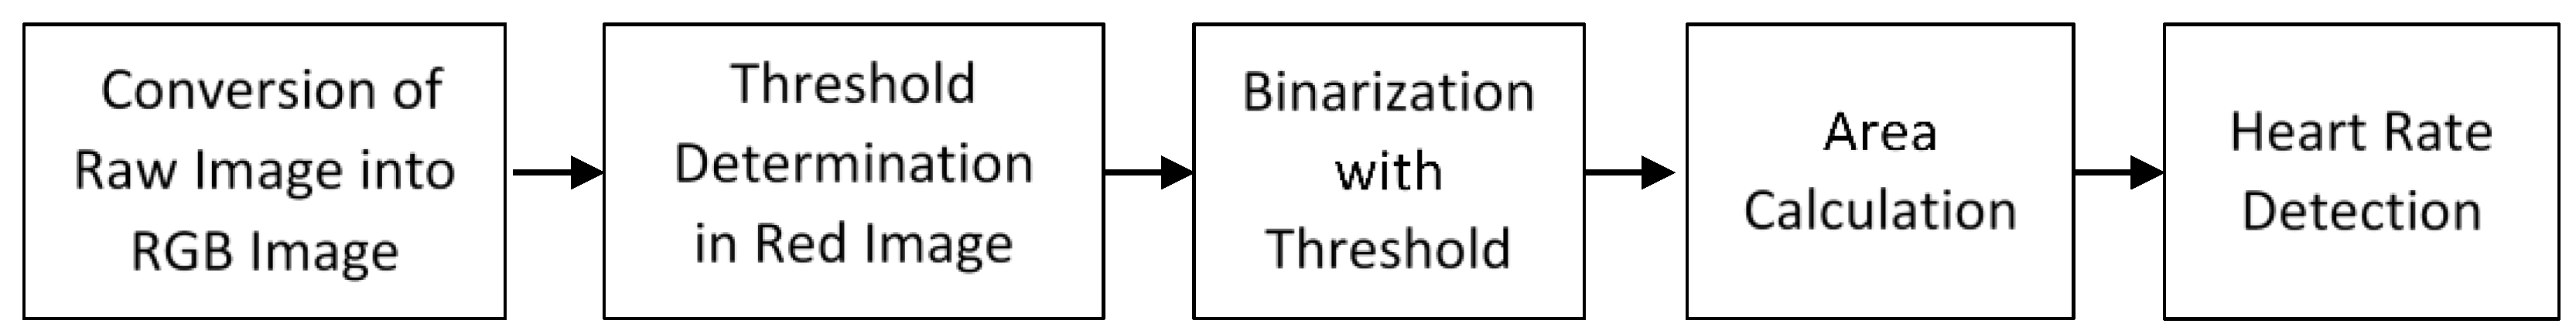
3.2. Fingertip Image Intensity-Based Detection
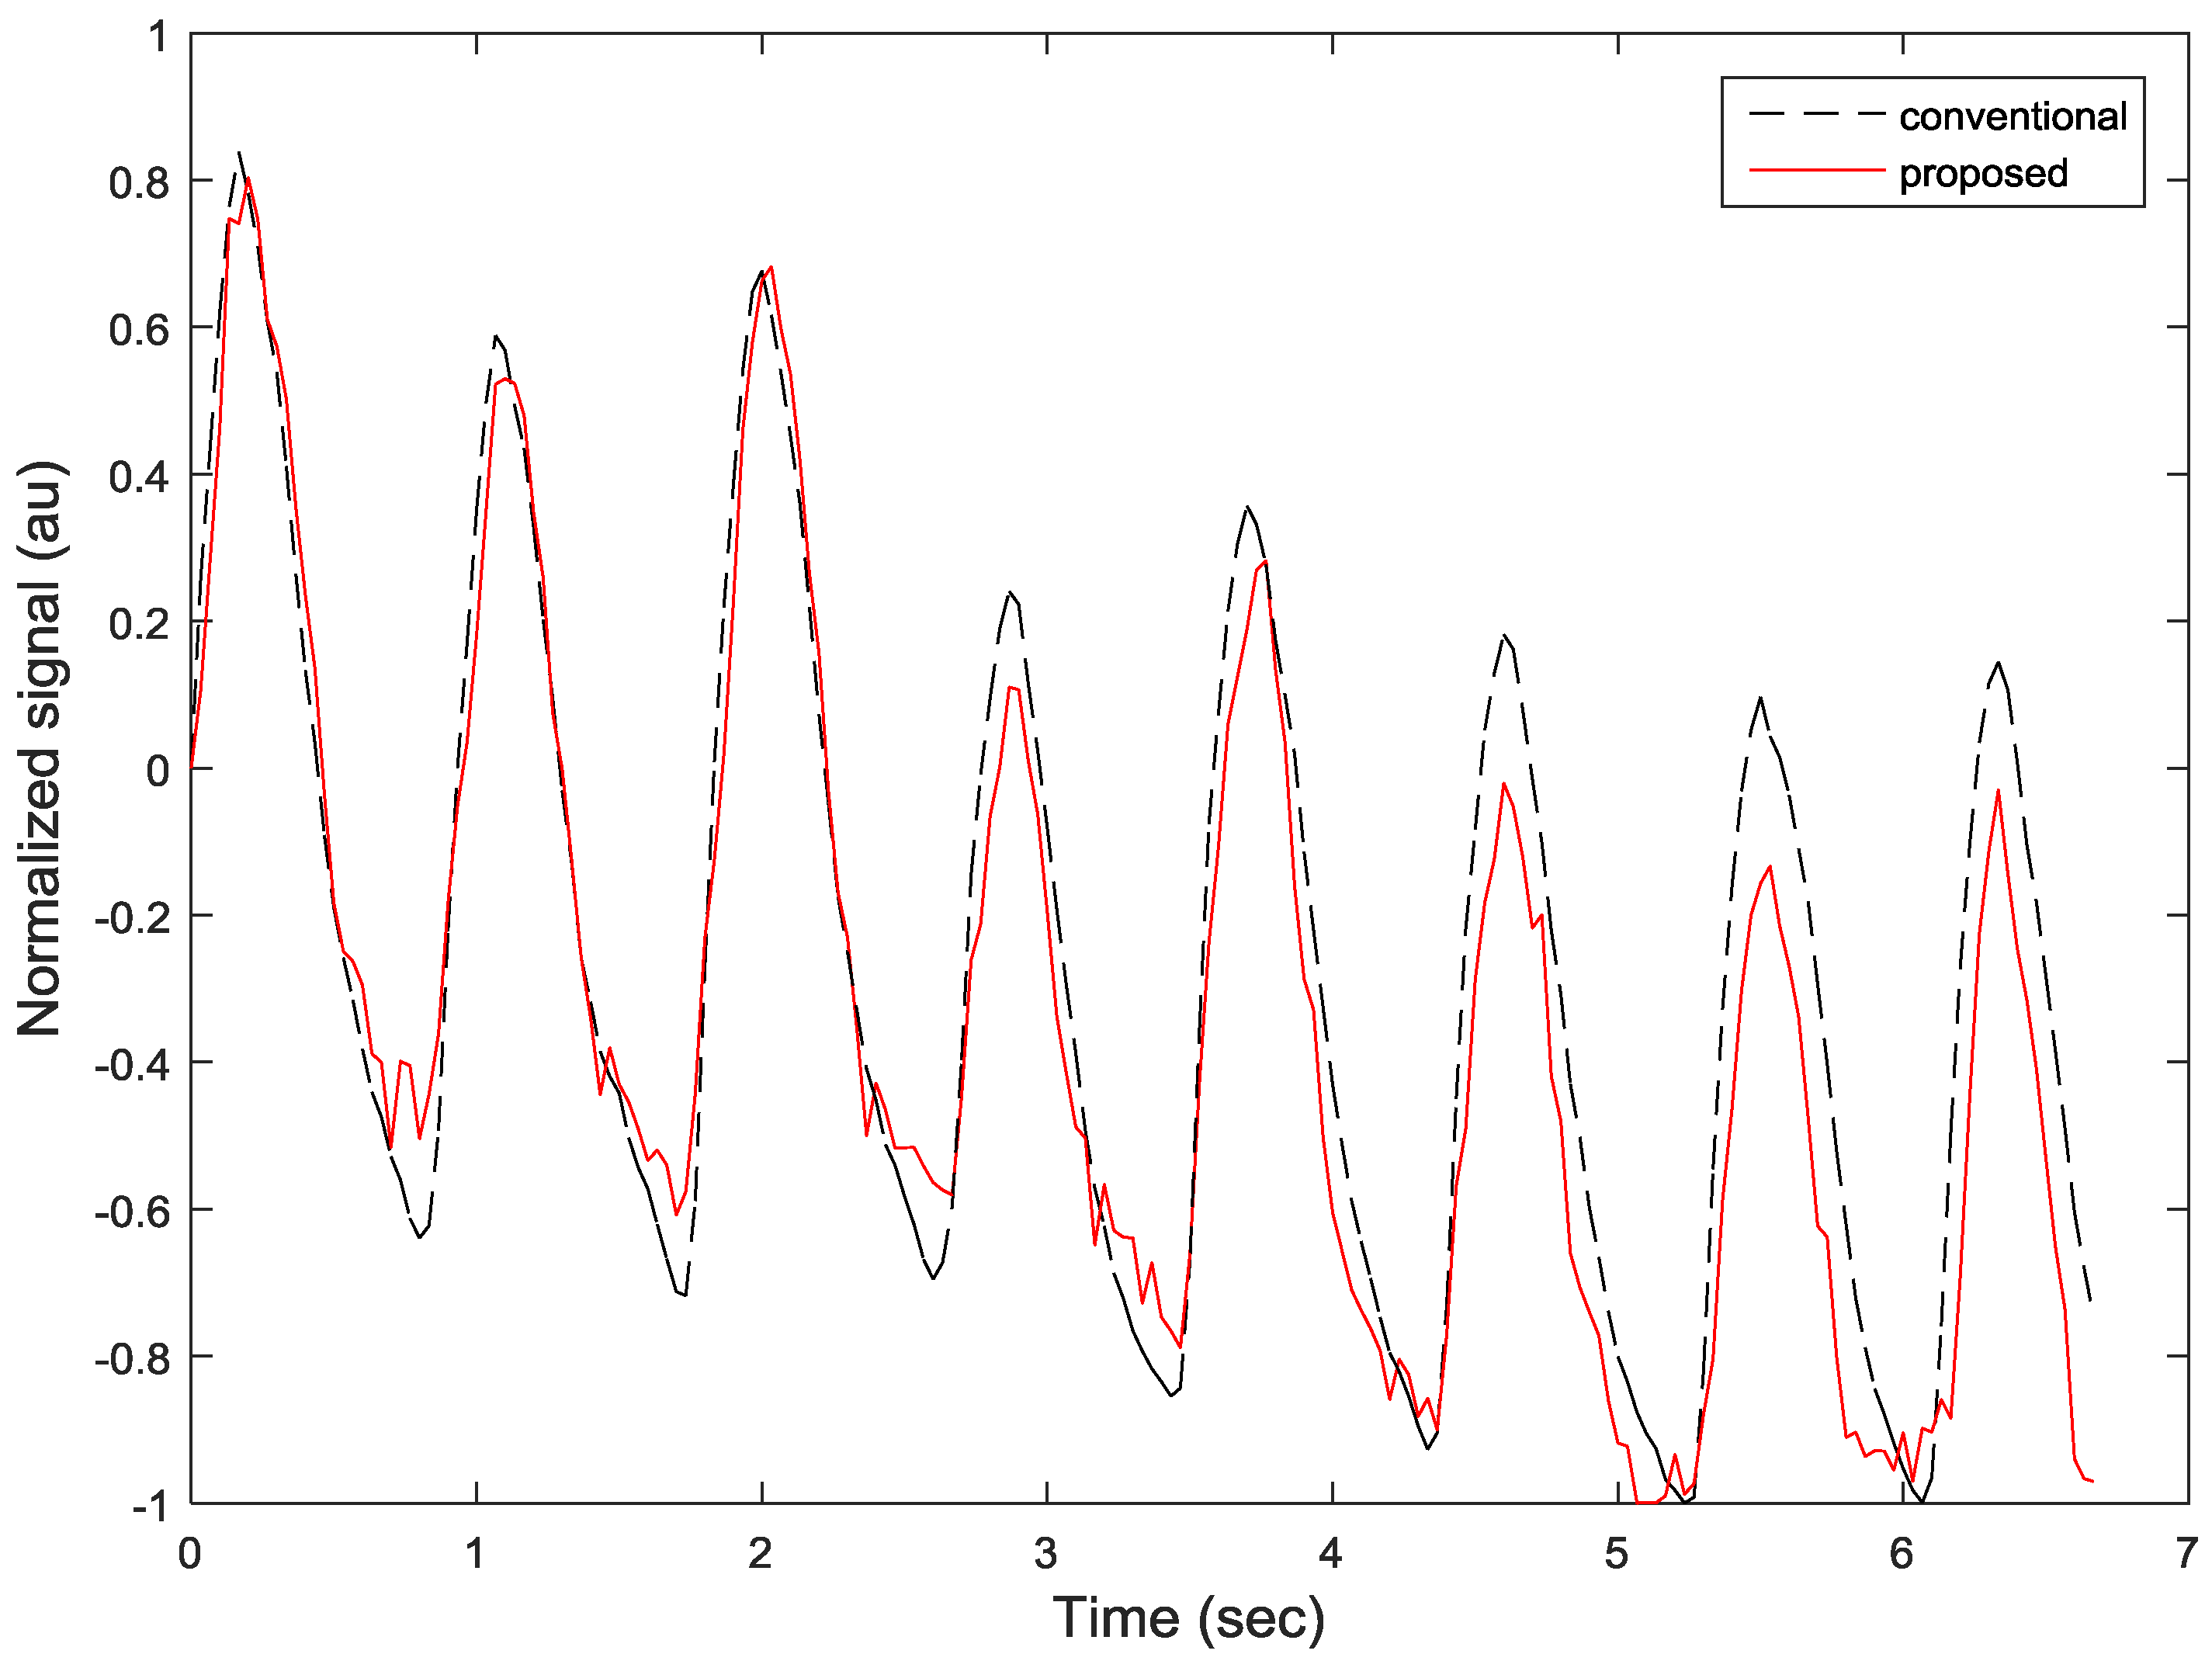
4. Results
Fingertip Image Intensity-Based Method
5. Conclusions
Acknowledgments
Author Contributions
Conflicts of Interest
References
- Mosa, A.S.; Yoo, I.; Sheets, L. A Systematic Review of Healthcare Applications for Smartphones. BMC Med. Inform. Decis. Mak. 2012, 12, 67–97. [Google Scholar] [CrossRef] [PubMed]
- Savelieva, I.; Camm, A.J. Clinical relevance of silent atrial fibrillation: Prevalence, prognosis, quality of life, and management. J. Interv. Cardiol. Electrophysiol. 2000, 4, 369–382. [Google Scholar] [CrossRef]
- Miyasaka, Y.; Barnes, M.E.; Gersh, B.J.; Cha, S.S.; Bailey, K.R.; Abhayaratna, W.P.; Seward, J.B.; Tsang, T.S. Secular trends in incidence of atrial fibrillation in Olmsted County, Minnesota, 1980 to 2000, and implications on the projections for future prevalence. Circulation 2006, 114, 119–125. [Google Scholar] [CrossRef] [PubMed]
- Colilla, S.; Crow, A.; Petkun, W.; Singer, D.E.; Simon, T.; Liu, X. Estimates of current and future incidence and prevalence of atrial fibrillation in the U.S. adult population. Amer. J. Cardiol. 2013, 112, 1142–1147. [Google Scholar] [CrossRef] [PubMed]
- Chong, J.W.; Esa, N.; McManus, D.D.; Chon, K.H. Arrhythmia Discrimination Using a Smart Phone. IEEE J. Biomed. Health Inform. 2015, 19, 815–824. [Google Scholar] [CrossRef] [PubMed]
- McManus, D.D.; Chong, J.W.; Soni, A.; Saczynski, J.S.; Esa, N.; Napolitano, C.; Darling, C.E.; Boyer, E.; Rosen, R.K.; Floyd, K.C.; et al. PULSE-SMART: Pulse-Based Arrhythmia Discrimination Using a Novel Smartphone Application. J. Cardiovasc. Electrophysiol. 2016, 27, 51–57. [Google Scholar] [CrossRef] [PubMed]
- Harrington, J.L.; Chong, J.W.; Li, J.; Esa, N.; Pidikiti, R.; Maitas, O.; Chon, K.H. The Detection and Differentiation of Arrrhythmias using a Smartphone: A Clinical Study of Patients with Atrial Fibrillation, Premature Atrial and Premature Ventricular Contractions. J. Am. Coll. Cardiol. 2013, 61, E362. [Google Scholar] [CrossRef]
- Napolitano, C.A.; Chong, J.W.; Saczynski, J.S.; Esa, N.; Darling, C.E.; Boyer, E.; Rosen, R.K.; Floyd, K.C.; Chon, K.H.; McManus, D.D. Pulse-based Arrhythmia Discrimination using a Novel Smartphone Application. Circulation 2015, 132, A11586. [Google Scholar]
- Sardana, M.; Saczynski, J.; Esa, N.; Floyd, K.; Chon, K.H.; Chong, J.W.; McManus, D.D. Performance and Usability of A Novel Smartphone Application for Atrial Fibrillation Detection in an Ambulatory Population Referred for Cardiac Monitoring. J. Am. Coll. Cardiol. 2016, 67, 844. [Google Scholar] [CrossRef]
- Shrivakshan, G.T.; Chandrasekar, C. A comparison of various edge detection techniques used in image processing. Int. J. Comput. 2012, 9, 272–276. [Google Scholar]
- Yadav, D.; Gupta, P.; Kaur, G.; Singh, J.; Gandh, I.M.; Singh, A. Implementing Edge Detection for Medical Diagnosis of A Bone in MATLAB. In Proceedinds of the International Conference on Computational Intelligence and Communication Networks (CICN), Mathura, India, 27–29 September 2013; pp. 270–274.
- Ansari, S.; Prabhu, S.G.; Kini, N.; Hegde, G.; Haider, Y. A Survey on Conventional Edge Detection Techniques. Int. J. Sci. Res. Comput. Sci. Appl. Manag. Stud. 2014, 3. Available online: http://eprints.manipal.edu/141213/ (accessed 25 January 2017). [Google Scholar]
- Arora, S.; Anand, S. A Proposed Method for Image Steganography Using Edge Detection. Int. J. Emerg. Technol. Adv. Eng. 2013, 3, 296–297. [Google Scholar]
- Hughes, M.; McCarthy, J.; Marsh, J.; Wickline, S. Optimal smoothing splines improve efficiency of entropy imaging for detection of therapeutic benefit in muscular dystrophy. J. Acoust. Soc. Am. 2014, 136, 2264. [Google Scholar] [CrossRef]
- Molloy, E.K.; Meyerand, M.E.; Birn, R.M. The influence of spatial resolution and smoothing on the detectability of resting-state and task fMRI. Neuroimage 2014, 86, 221–230. [Google Scholar] [CrossRef] [PubMed]
- Lopez-Molina, C.; Baets, B.D.; Bustinc, H.; Sanz, J.; Barrenechea, E. Multiscale edge detection based on Gaussian smoothing and edge tracking. Knowl. Based Syst. 2013, 44, 101–111. [Google Scholar] [CrossRef]
- Nam, Y.; Lee, J.; Chon, K.H. Respiratory rate estimation from the built-in cameras of smartphones and tablets. Ann. Biomed. Eng. 2014, 42, 885–898. [Google Scholar] [CrossRef] [PubMed]
- Shirai, K.; Endo, Y.; Kitadai, A.; Inoue, S.N.; Kurushima, H.B.; Watanabe, A.; Nakagawa, M. Character shape restoration of binarized historical documents by smoothing via geodesic morphology. In Proceedings of the IAPR International Conference on Document Analysis and Recognition (ICDAR), Washington, DC, USA, 25–28 August 2013.
- Tschumperle, D.; Deriche, R. Anisotropic Diffusion Partial Differential Equations in Multi-Channel Image Processing: Framework and Applications. In Advances in Imaging and Electron Physics (AIEP); Academic Press: Cambridge, MA, USA, 2007; pp. 145–209. [Google Scholar]
- Welch, P.D. The use of Fast Fourier Transform for the estimation of power spectra: A method based on time averaging over short, modified periodograms. IEEE Trans. Audio Electroacoust. 1967, 15, 70–73. [Google Scholar] [CrossRef]


| Subject | Estimated Mean ± STD HR (Proposed, Time) | Estimated Mean ± STD HR (Conventioal, Time) | Estimated Mean ± STD HR (Proposed, Frequency) | Estimated Mean ± STD HR (Conventioal, Frequency) |
|---|---|---|---|---|
| 1 | 1.8078 ± 0.1170 | 1.8128 ± 0.1511 | 1.7460 ± 0.0716 | 1.7820 ± 0.0502 |
| 2 | 1.1370 ± 0.0493 | 1.1451 ± 0.0780 | 1.2900 ± 0.2683 | 1.2900 ± 0.3354 |
| 3 | 1.3840 ± 0.0401 | 1.4014 ± 0.1170 | 1.4229 ± 0.0596 | 1.4314 ± 0.1006 |
| 4 | 1.3776 ± 0.0932 | 1.3847 ± 0.1201 | 1.3513 ± 0.1649 | 1.4257 ± 0.2683 |
| 5 | 1.0433 ± 0.1647 | 1.0475 ± 0.1645 | 1.0839 ± 0.2937 | 1.1817 ± 0.3832 |
| 6 | 1.3629 ± 0.1508 | 1.3779 ± 0.1992 | 1.3983 ± 0.0880 | 1.3878 ± 0.0758 |
| 7 | 1.1155 ± 0.1733 | 1.1066 ± 0.1251 | 1.1714 ± 0.2439 | 1.1030 ± 0.1443 |
| 8 | 1.6486 ± 0.2009 | 1.6331 ± 0.1969 | 1.6725 ± 0.0521 | 1.7625 ± 0.0991 |
| 9 | 1.2986 ± 0.1537 | 1.3419 ± 0.3446 | 1.3057 ± 0.1682 | 1.1817 ± 0.4451 |
| 10 | 1.9577 ± 0.0828 | 2.0409 ± 0.4093 | 2.0182 ± 0.0911 | 1.9555 ± 0.2154 |
© 2017 by the authors. Licensee MDPI, Basel, Switzerland. This article is an open access article distributed under the terms and conditions of the Creative Commons Attribution (CC BY) license ( http://creativecommons.org/licenses/by/4.0/).
Share and Cite
Zaman, R.; Cho, C.H.; Hartmann-Vaccarezza, K.; Phan, T.N.; Yoon, G.; Chong, J.W. Novel Fingertip Image-Based Heart Rate Detection Methods for a Smartphone. Sensors 2017, 17, 358. https://doi.org/10.3390/s17020358
Zaman R, Cho CH, Hartmann-Vaccarezza K, Phan TN, Yoon G, Chong JW. Novel Fingertip Image-Based Heart Rate Detection Methods for a Smartphone. Sensors. 2017; 17(2):358. https://doi.org/10.3390/s17020358
Chicago/Turabian StyleZaman, Rifat, Chae Ho Cho, Konrad Hartmann-Vaccarezza, Tra Nguyen Phan, Gwonchan Yoon, and Jo Woon Chong. 2017. "Novel Fingertip Image-Based Heart Rate Detection Methods for a Smartphone" Sensors 17, no. 2: 358. https://doi.org/10.3390/s17020358