Persistence of Norovirus GII Genome in Drinking Water and Wastewater at Different Temperatures


Department of Health Security, Expert Microbiology Unit, National Institute for Health and Welfare, P.O. Box 95, FI-70701 Kuopio, Finland
*
Author to whom correspondence should be addressed.
Pathogens 2017, 6(4), 48; https://doi.org/10.3390/pathogens6040048
Submission received: 15 September 2017
/
Revised: 6 October 2017
/
Accepted: 7 October 2017
/
Published: 11 October 2017
Abstract
:Human norovirus (NoV) causes waterborne outbreaks worldwide suggesting their ability to persist and survive for extended periods in the environment. The objective of this study was to determine the persistence of the NoV GII genome in drinking water and wastewater at three different temperatures (3 °C, 21 °C, and 36 °C). The persistence of two NoV GII inoculums (extracted from stool) and an indigenous NoV GII were studied. The samples were collected for up to one year from drinking water and for up to 140 days from wastewater. Molecular methods (RT-qPCR) were used to assess the decay of the NoV genome. Decay rate coefficients were determined from the fitted decay curves using log-linear and/or non-linear model equations. Results showed significant differences in the decay kinetics of NoV genome between the temperatures, matrices, and virus strains. The persistence of NoV was higher in drinking water compared to wastewater, and the cold temperature assisted persistence at both matrices. Differences between the persistence of NoV strains were also evident and, particularly, indigenous NoVs persisted better than spiked NoVs in wastewater. The decay constants obtained in this study can be utilized to assess the fate of the NoV genome in different water environments.
1. Introduction
Human norovirus (NoV) is one of the most common waterborne pathogens causing acute gastroenteritis worldwide [1,2]. NoVs end up in the environment mainly through wastewater discharge. The environmental transmission of NoVs via water may occur directly using contaminated drinking water [3], or indirectly through recreational activities [4,5], consumption of food produced with contaminated irrigation water [6], or from contaminated shellfish harvesting areas [7]. The occurrence of NoV outbreaks related to water demonstrates that these viruses present in the environment outside the host can survive and stay infectious for a substantial time.
Each microbe has its own characteristic survival and behavioral properties that are highly responsible for the microbe’s capability to cause water-related problems. Overall, waterborne viruses (such as NoV, rotavirus, and adenovirus) are considered to show high persistence in water [8]. The virus decay in water is a complex process expected to be influenced by site-specific environmental conditions, such as the temperature, exposure to sunlight, organic matter content, the presence of indigenous microorganisms, and the physical and chemical water properties [9,10,11]. The understanding of the decay rates of viruses in water has an important role in water safety assessments. The management of contamination cases, as well as specific modelling and risk assessment scenarios, e.g., related to the transport and fate of viruses in the water environment, requires information regarding their survival.
Current detection methods for NoV rely on genome detection since, despite recent progress [12,13], they cannot be grown in simple culture systems. The limitation of genome-based molecular methods is the detection of both infectious and noninfectious virus particles. Despite the many efforts, none of the potential molecular-based infectivity assays have been universally accepted as effective [14,15]. Therefore, the health authorities and decision-makers still need to base their decisions largely on the presence of the genome without the knowledge about the infectivity of NoV.
Previous studies have shown the high persistence of NoV in the water environment [16,17,18,19]. However, information regarding the dependency of NoV genome persistence on different temperatures, water matrices, and NoV strains is still limited. The objective of this study was to examine NoV genome persistence in drinking water and wastewater at 3 °C, 21 °C, and 36 °C, in dark conditions.
2. Results
2.1. Persistence of the NoV Genome in Drinking Water at Different Temperatures
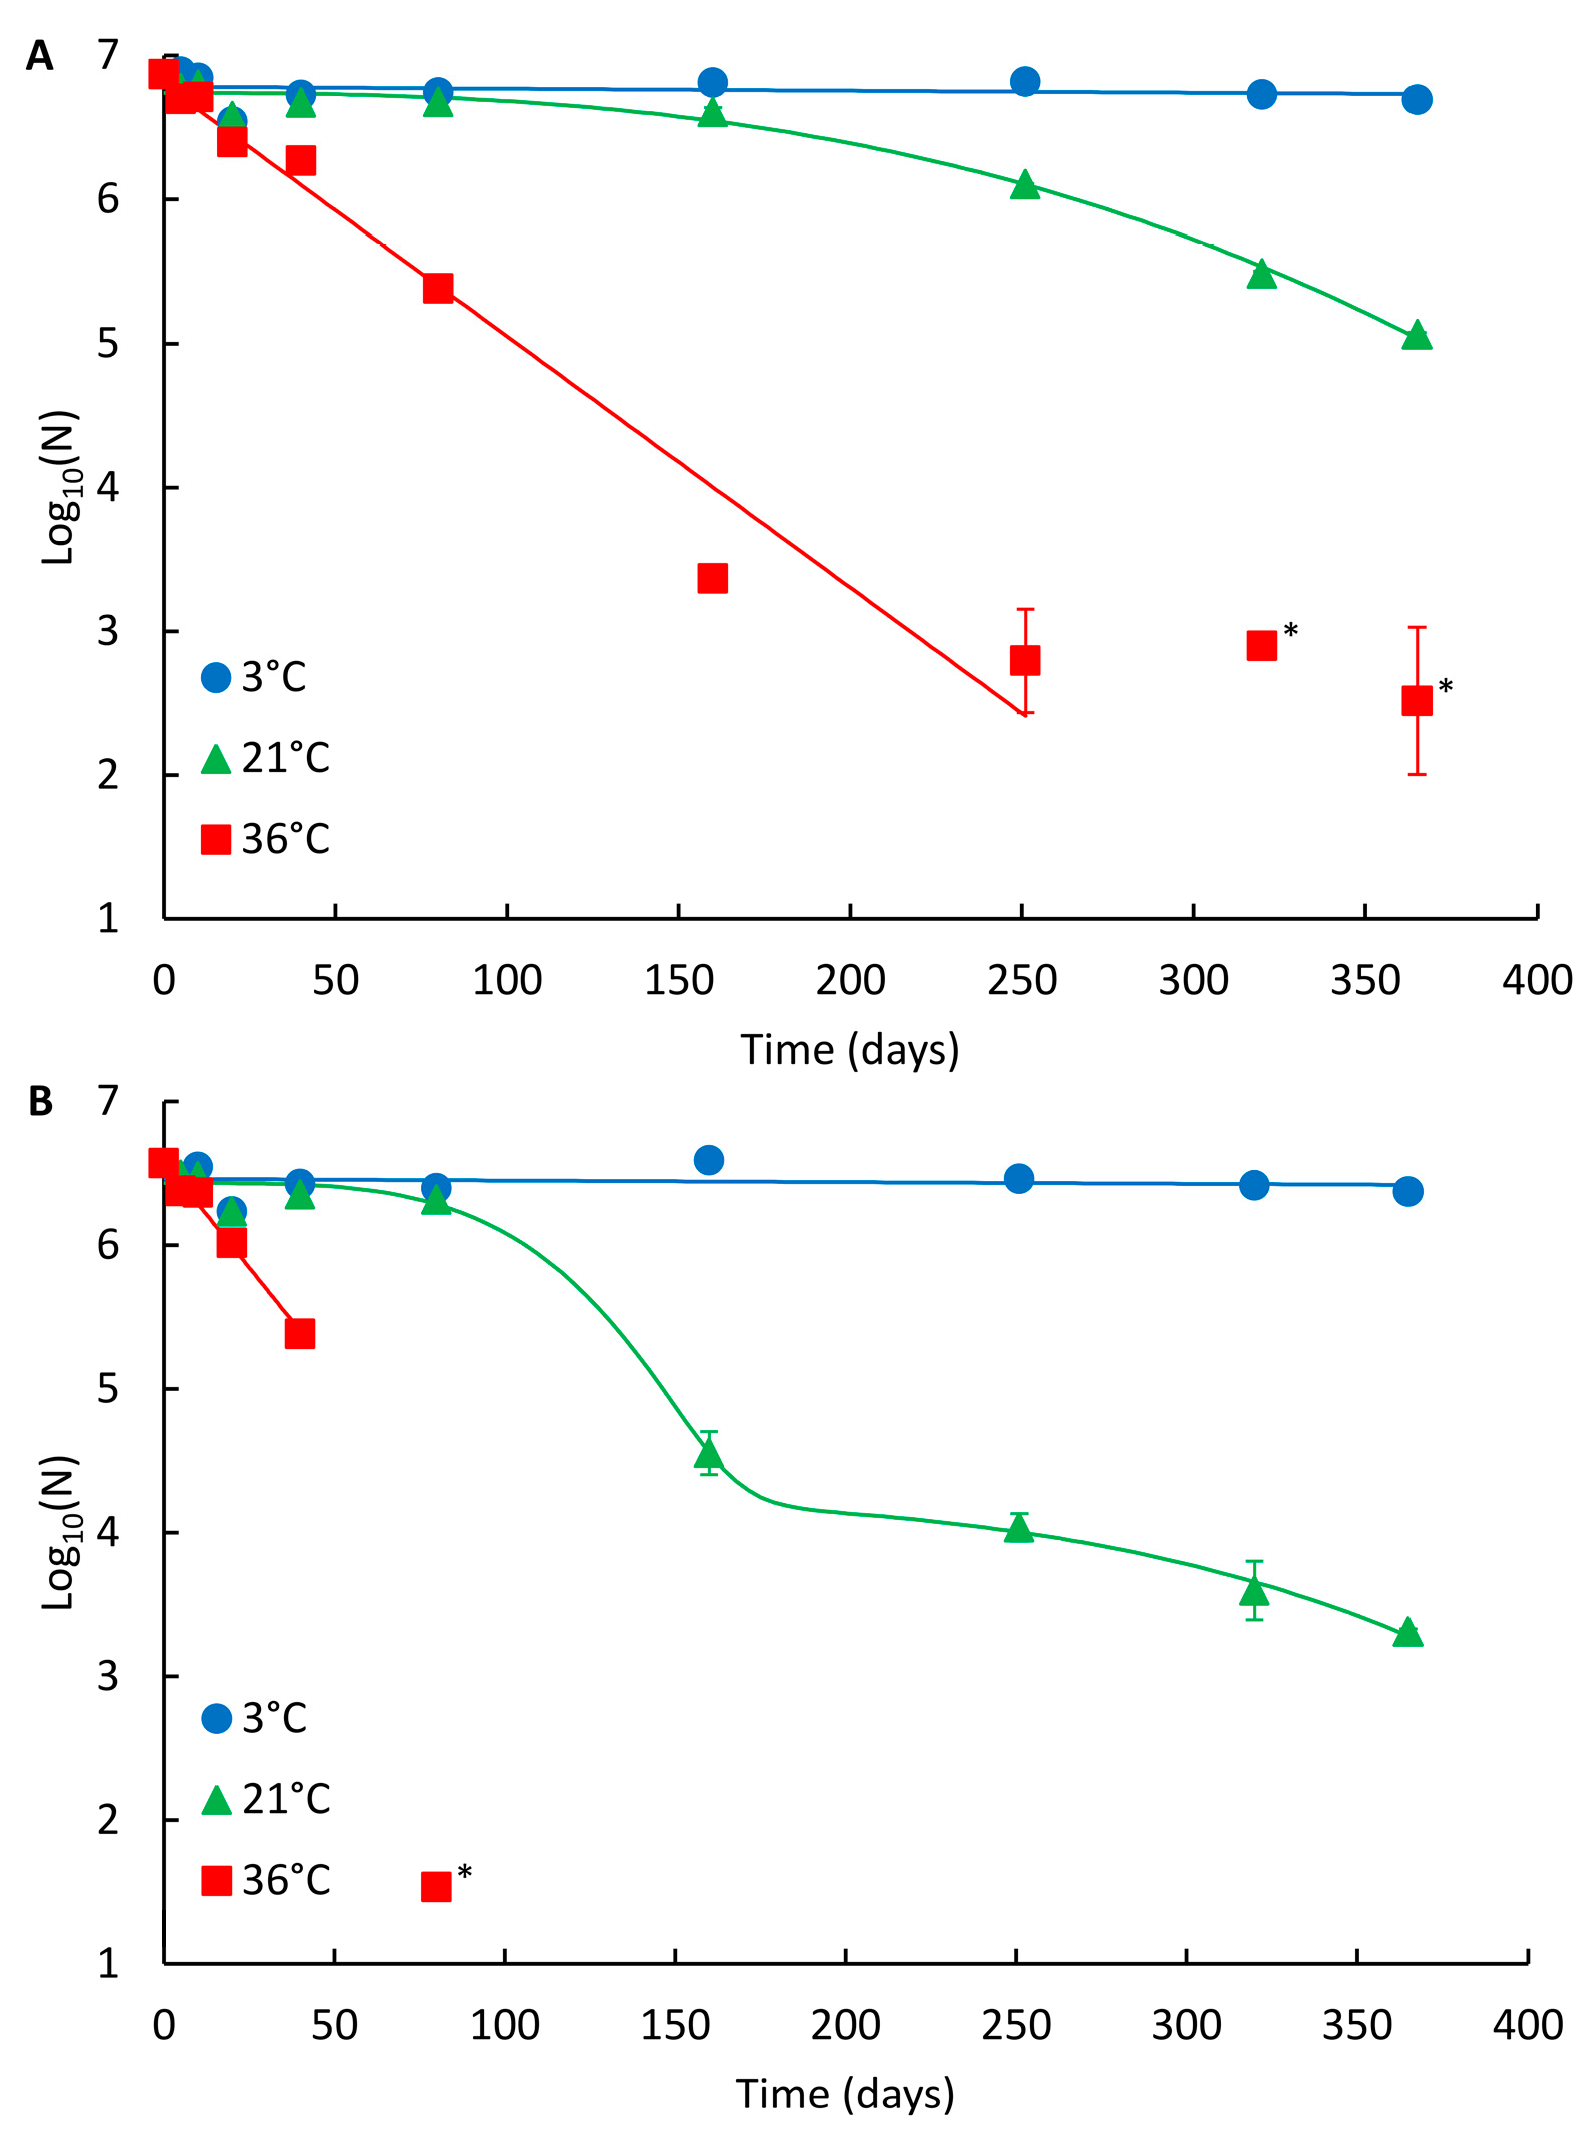
The decay curves of NoV GII_A and GII_B in drinking water are presented in Figure 1A,B, respectively, and the summary of the modelling results in Table 1. For the spiked NoV strains (both assigned as recombinant GII.Pg/GII.1), the persistence was highest at 3 °C and lowest at 36 °C (Figure 1; Table 2). At 3 °C, no reduction was observed during one year study and no statistical difference in persistence between the two NoV strains was noted. At 21 °C, both strains were clearly detectable throughout the whole one-year study period (Figure 1). The persistence of GII_A and GII_B was comparable during the first 80 days at 21 °C (log10 reduction 0.2 and 0.3, respectively, p = 0.059). Subsequently, GII_A persisted better showing non-linear Weibull decay model compared to GII_B showing the double Weibull decay model achieving 1.8 and 3.3 log10 reductions, respectively (p = 0.001). At 36 °C, log-linear decay was observed for both strains and the persistence of GII_A and GII_B was comparable during the first 20 days (log10 reduction 0.5 and 0.6, respectively, p = 0.028). After 20 days, GII_A clearly persisted better and was detectable the whole study period compared to GII_B (p < 0.001), which was not detected after 160 days at 36 °C.
2.2. Persistence of the NoV Genome in Wastewater at Different Temperatures
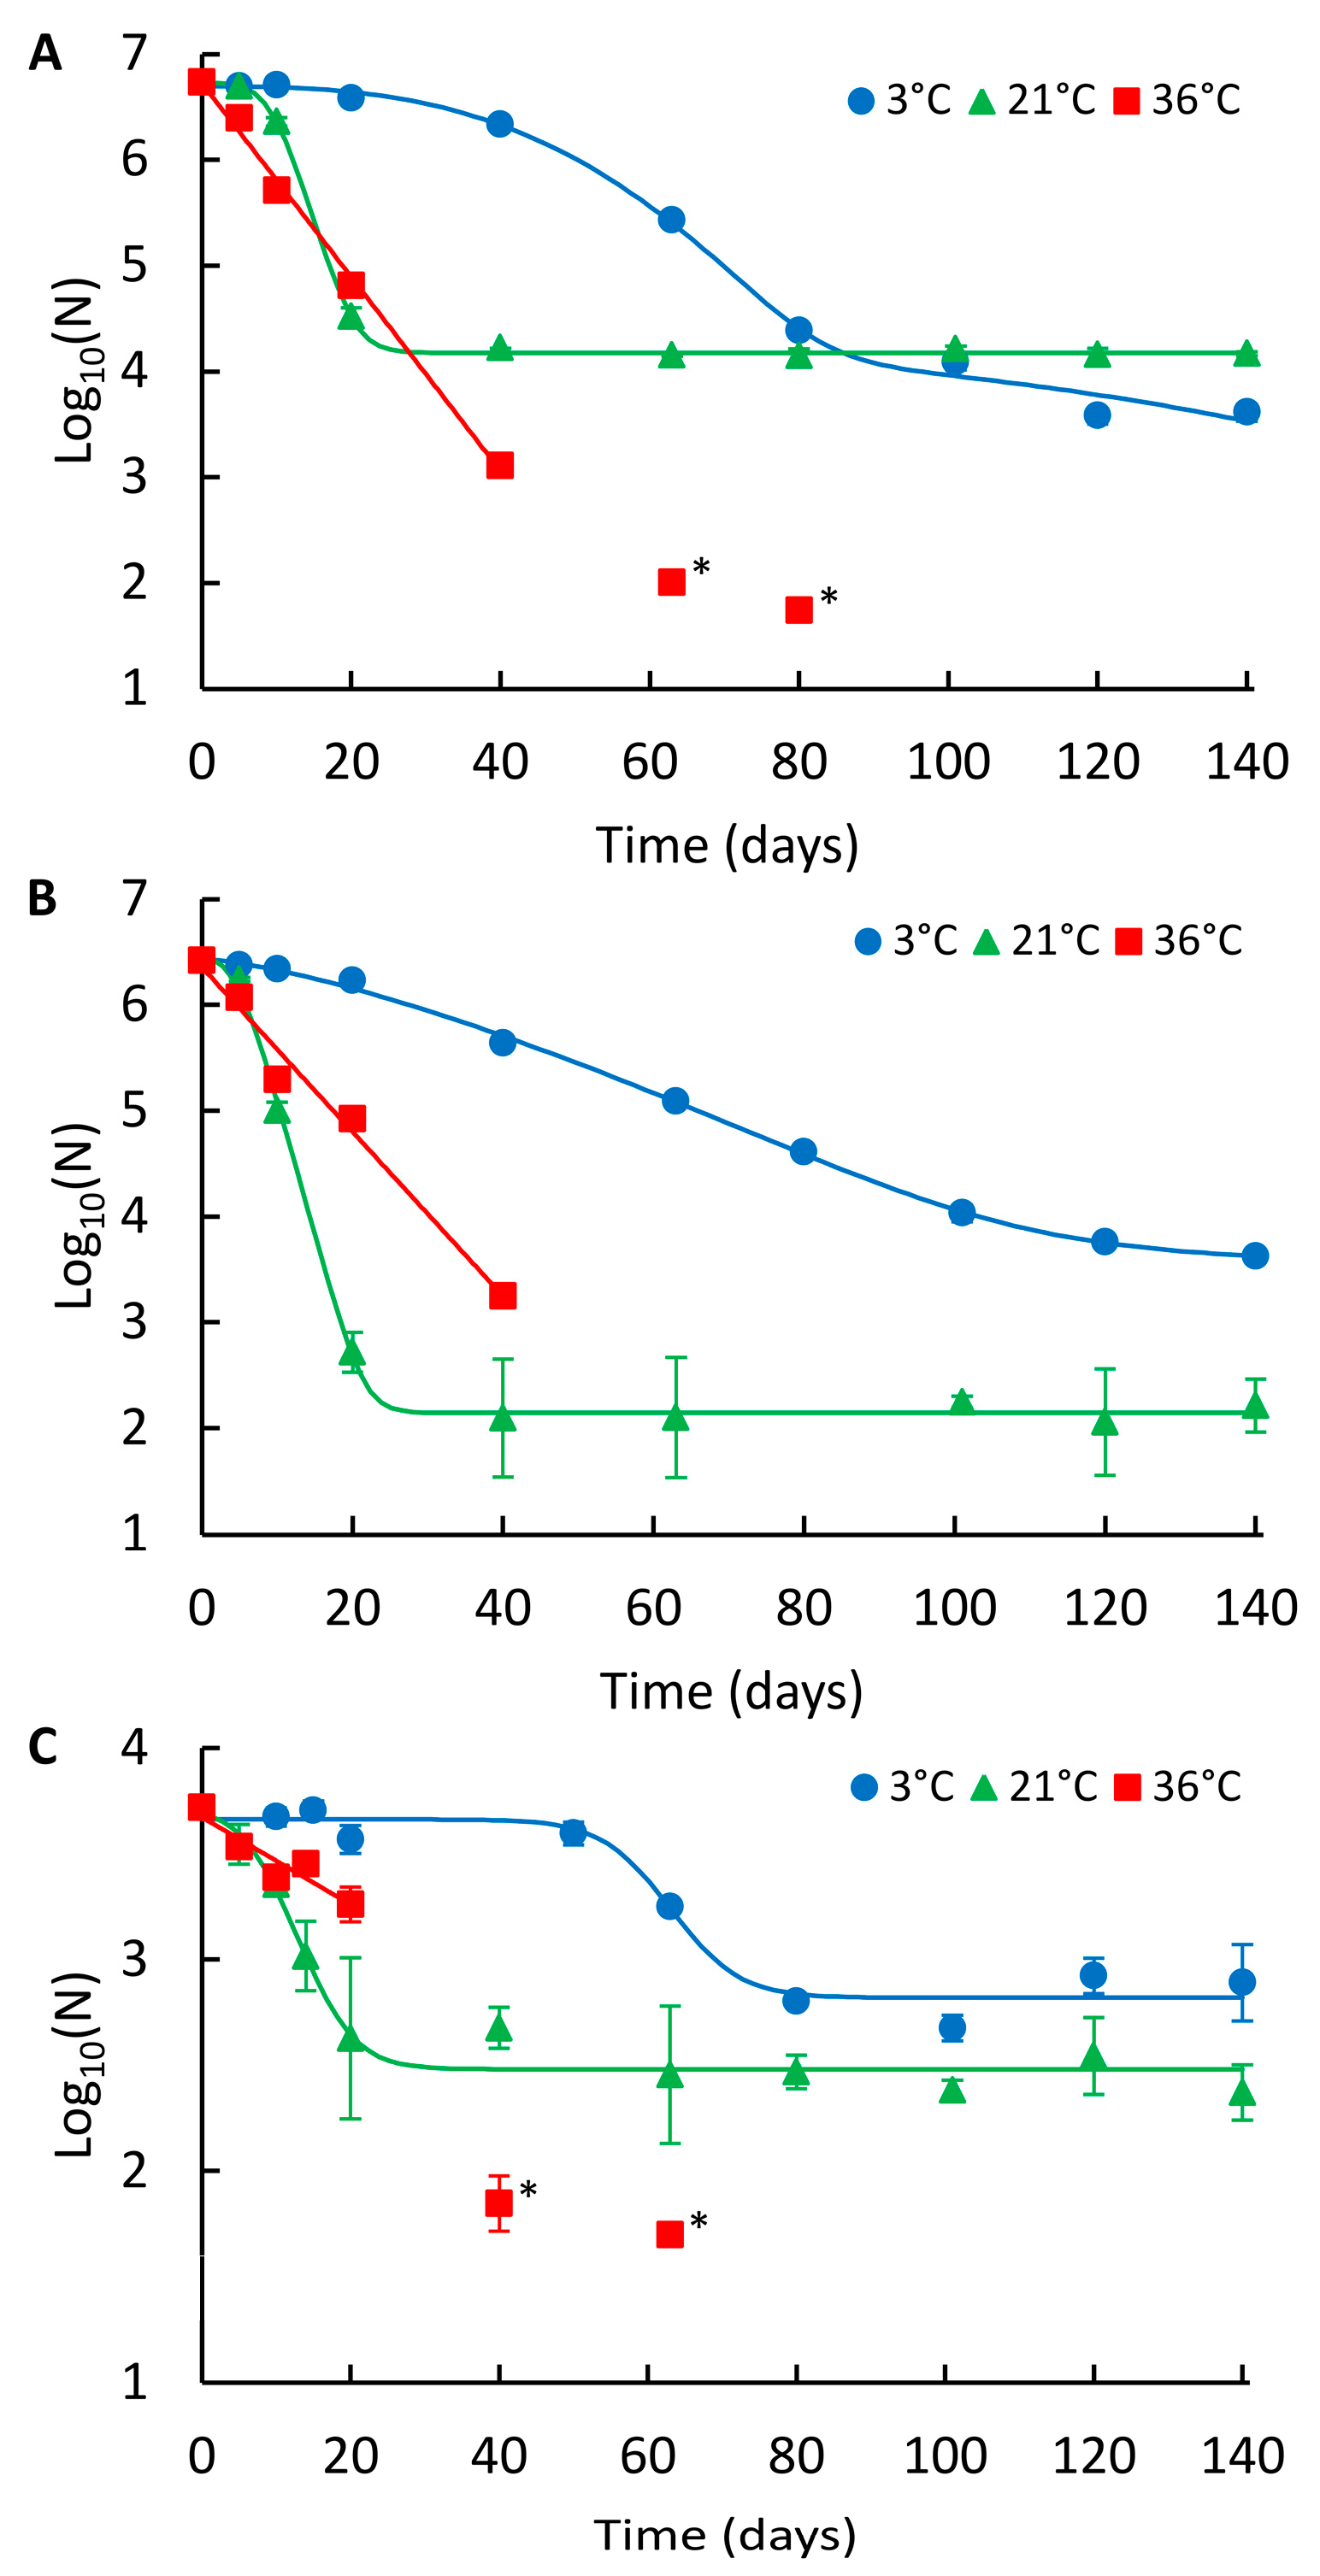
The decays of NoV GII_A, GII_B, and indigenous GII (GII_ind) in wastewater are presented in Figure 2A–C, respectively, and the summary of the modelling results is shown in Table 1. In wastewater, the persistence of NoV was also highest at 3 °C and lowest at 36 °C, except for GII_A, which showed the highest long-term persistence at 21 °C (Figure 2A; Table 2). At 3 °C, GII_A and GII_B showed a non-linear double Weibull decay model and GII_ind log-linear shoulder tail decay model (Table 1). GII_ind was more persistent (log10 reduction 0.8) compared to GII_A and GII_B, whose reductions did not differ statistically from each other during the 140-day study at 3 °C (log10 reductions 3.1 and 2.8, respectively, p = 0.27). At 21 °C, the log-linear shoulder tail decay model was applied for all NoV strains. The persistence of all three strains differed statistically from each other; GII_ind was the most persistent, followed by GII_A and GII_B (log10 reductions 1.3, 2.6 and 4.2, respectively). At 36 °C, log-linear decay was observed for all strains and the numbers were decayed below LOD. GII_ind showed higher persistence compared to GII_A and GII_B, whose persistence was not statistically different from each other during the first 40 days (p = 0.18).
2.3. Effect of the Matrix on NoV Genome Persistence
A comparison of the decay rates showed that both spiked inoculums, GII_A and GII_B, persisted better in drinking water compared to wastewater at each temperature (Table 2).
3. Discussion
The results clearly show the effect of temperature, water matrix, and NoV strain on genome persistence. Tests were carried out at three temperatures in order to simulate conditions commonly found in water environments (3 °C and 21 °C) (groundwater, surface water, wastewater, and drinking water), as well as to demonstrate the effect of high temperature (36 °C) representing extreme environmental conditions. NoV persisted longer at cold temperatures in both drinking and wastewater. This observation is consistent with the previous studies showing the temperature dependency of NoV genome persistence. Bae and Schwab [16] and Ngazoa et al. [20] showed that the NoV genome persisted better in different waters at 4 °C than at 25 °C. Similarly, Skraber et al. [18] showed that indigenous NoV GI persisted better in wastewater at 4 °C than at 20 °C. Moreover, Liu et al. [21] showed that the order of persistence of NoV genome in phosphate-buffered saline (PBS) was: 4 °C > RT > 37 °C.
The decay rates of NoVs used in this study were comparable or lower than those presented in previous studies (Table S1). However, the comparison of the decay rates between different studies is challenging due to differences in experimental conditions, such as the test water properties and the status of the studied NoV strain, which may affect the persistence of a virus genome. In spike tests, the pre-study storage conditions, length of preservation, and the preparation method of the inoculum, presumably have an effect on the results.
In addition to temperature, the matrix was found to have a significant role in the persistence of the NoV genome. Virus decay appeared to occur faster in wastewater than in drinking water. In drinking water, no reduction in genome numbers was observed at 3 °C and NoV was also detectable at 21 °C and 36 °C throughout the whole one-year follow-up period. In contrast to drinking water, significantly higher log10 reductions were noted in wastewater during the 140-day study. This is probably due to the higher presence of organic matter and indigenous microorganisms in wastewater, which may have negative effects on NoV persistence [8,9,10,11]. This finding of better persistence of NoV in clean water is consistent with the previous studies examining the persistence of the NoV genome in different water matrices [16,20]. Overall, viruses have been shown to be more persistent in simple (e.g., drinking water) than in complex matrices (e.g., wastewater) [22].
In this study, the persistence of two NoV strains (both GII.Pg/GII.1) were examined in drinking water (GII_A, GII_B) and three in wastewater (GII_A, GII_B, and GII_ind). GII_A and GII_B persisted similarly in both drinking water and wastewater at 3 °C, as well as in wastewater at 36 °C. However, GII_A was found to be more persistent than GII_B in drinking water (after 80 days) and wastewater at 21 °C, as well as in drinking water (after 20 days) at 36 °C. The observed differences between the decay of GII_A and GII_B inoculums at 21 °C and 36 °C may be due to exposure of GII_B to pre-study environmental stress. At that time, putatively, three freeze-thaw cycles occurred, which may have influenced GII_B stability. However, previous study has shown that NoV is resistant to freezing and thawing [23]. Other explanations include the different status of viruses at the time of stool sample collection, as well as the other contents of the stool, such as antiviral compounds and enzymes (nucleases and proteases) present in inoculums, which may have had an effect on the decay.
In wastewater, indigenous GII (GII_ind) persisted better compared to spiked inoculums (GII_A and GII_B) at each temperature. This may be due to four to five years’ storage of spiked viruses prior to study. Moreover, age of indigenous NoVs was unknown and it is possible that only the more persistent population was present at the start of the study. The GII genotype of indigenous NoV may have also been more resistant compared to the GII.Pg/GII.1 genotype of spiked inoculums. Unfortunately, the typing of the wastewater strain was unsuccessful.
To date, many of the persistence studies with NoV have been performed with the GI.1 genotype, [16,19,21], initially prepared in the challenge study in 1997 from over 25-year-old primary inoculum [24]. The comparable or higher persistence of NoVs observed in this study compared to GI.1 may be due to differences in experimental conditions discussed above. In addition, the evolution of NoV during the past 25 years may have improved the environmental persistence of virus, especially considering the large epidemics occurred during 2000. The recombinant GII.Pg/GII.1 NoV, used in this study, have been recently described in multiple outbreaks [25,26,27,28].
The simple first-order log-linear regression model is commonly used to describe NoV genome persistence [16,18,21]. In this study, a log-linear model was observed to fit best for the decay of NoV only at 36 °C. However, at lower temperatures (3 °C and 21 °C), non-linear models produced better fits for the decay curves. At these lower temperatures, the log-linear shoulder tail, Weibull, and double Weibull models were applied to obtain the best fit for the experimental data. This agrees with previous studies where non-linear modelling has been used successfully to describe the thermal persistence of viruses [17,29,30,31]. As shown in our study, sufficient follow-up time is required to detect the non-linear decay. Noteworthy, the decay of GII_A and GII_B in wastewater at 3 °C could also have showed a tailing effect if continued longer than 140 days. Experimental periods from three up to seven weeks [16,18,21] may be insufficient to describe the long-term persistence of the NoV genome.
The long persistence of the NoV genome, especially at lower temperatures, may cause prolonged outbreak management cases as shown in a recent study [32]. In the risk assessments related to outbreak control and management, molecular methods (RT-qPCR) are commonly used for NoV detection without the knowledge of the infectious state of the virus. In drinking water, it may be reasonable to judge the water containing even traces of the NoV genome as non-suitable for human consumption. However, results based on the molecular detection of NoV from environmental samples should be interpreted carefully and in the context of available epidemiological or clinical information [33]. The results of this study emphasize the need and importance of practical and reliable infectivity assay for NoV to reveal the actual infectious risk related to long-term genome persistence.
4. Materials and Methods
4.1. Viruses and Water Matrices
Two NoV GII (GII.Pg/GII.1) inoculums used in this study are described in Table 3. Inoculums were extracted from the human stools stored at −20 °C by making 10–20% (w/v) suspension in nuclease free water. The suspension was centrifuged at 10,000× g for 2 min and the supernatant was used immediately or stored at −75 °C.
Tests were carried out in drinking water and wastewater matrices. The general physical-chemical properties of the drinking water and wastewater used in this study are presented in Table 4. Drinking water was the tap water of the city of Kuopio, Finland, where the chlorine was quenched with sodium thiosulfate prior to the experiments. Wastewater was settled influent taken from the distribution box after a three-tank septic system of a private onsite wastewater treatment system serving five people (two adults and three children).
4.2. Experimental Design and Sampling
Tests were carried out in 15 mL polypropylene tubes coated with aluminum foil to obtain dark conditions. Tubes were incubated at three different temperatures; in a refrigerated room at 3 °C, in a laboratory at 21 °C (RT) and in a heat-controlled room at 36 °C. Temperature was monitored every 5 min with the automated monitoring system (Labo Line). In drinking water, the average temperatures and standard deviations were 3.2 ± 0.8, 21.0 ± 0.8, and 35.9 ± 0.1, and in wastewater was 3.0 ± 0.8, 20.9 ± 0.3, and 35.8 ± 0.1.
In drinking water experiment, 600 µL of NoV inoculum was spiked in 30 mL of Kuopio tap water, separately for GII_A and GII_B, and the mixtures were divided into three temperature tests. The initial numbers in drinking water experiment for GII_A and GII_B were 7.4 × 10⁶ genome copies (GC) mL−1 and 3.7 × 10⁶ GC mL−1, respectively. In wastewater experiment, similarly, 300 µL of the inoculum was spiked in 30 mL of wastewater, separately for GII_A and GII_B, and the mixtures, as well as non-spiked wastewater sample for the indigenous GII (GII_ind) test, were divided into three temperature tests. The initial numbers of GII_A, GII_B, and GII_ind in wastewater experiment were 5.4 × 10⁶ GC mL−1, 2.6 × 10⁶ GC mL−1, and 5.2 × 10³ GC mL−1, respectively. In wastewater test calculations, the numbers of GII_ind were subtracted from the numbers of spiked GII_A and GII_B.
Duplicate samples were taken after 0, 5, 10, 20, 40, 80, 160, 251, 320, and 365 days in drinking water experiment and after 0, 5, 10, 14 (15), 20, 40 (50), 63, 80, 101, 120, and 140 days in wastewater experiment from the beginning of the experimental work. Sample tubes were vortexed briefly prior to sampling and opened only in sterile conditions under a laminar flow hood to prevent microbial contamination. The samples were immediately subjected to RNA extraction.
4.3. Quantitative Detection of NoV
Viral RNA was extracted from a 200 µL sample using the High Pure Viral RNA Kit according to the manufacturer’s instructions (Roche Diagnostics GmbH, Mannheim, Germany) and stored at −75 °C. NoV GII was detected using the forward primer QNIF2d [36], reverse primer (COG2R), and probe (RING2-TP) [37], except for the black hole quencher (BHQ) used at the 3′ end of the probe. Amplification reaction mixtures contained 6.25 µL 4X TaqMan® Fast Virus 1-Step Master Mix (Thermo Fisher Scientific, Austin, TX, USA), 0.4 µmol L−1 primers, 0.2 µmol L−1 probe, and 5 µL of RNA sample or control in a final volume of 25 µL. The real-time RT-qPCR assays were carried out using QuantStudio 6 Flex Real-Time PCR System (Applied Biosystems, Foster City, CA, USA) by running at 50 °C for 5 min and 95 °C for 20 s, followed by 45 cycles at 95 °C for 15 s and 60 °C for 1 min. All samples were run with undiluted and 10-fold dilutions without technical replicates. Quantitation was made by comparing the Ct values of the sample to the serially-diluted standard curve included in each run. Standard curves were generated using gBlocks® Gene Fragments (Integrated DNA Technologies, Leuven, Belgium) containing the sequences for the target amplicon. Negative extraction control (nuclease free water) was included in every batch of extractions. GII_A stored in drinking water at 4 °C was used as positive extraction control in drinking water experiment, and in wastewater experiment with every batch of new reagents. Inhibition in RT-qPCR was assessed by using the 10-fold dilution results in calculations if inhibition was detected.
4.4. Sequencing
NoV inoculums (GII_A and GII_B) were sequenced at three regions; the polymerase region was sequenced with the primers MJV12 and RegA [38], the ORF1-2 junction with QNIF2d [36] and G2SKR [39] and the capsid region with CapD1, CapD3, and CapC [38]. Sequencing was performed using BigDye v. 3.1 terminator chemistry and analyzed on an ABI PRISM 310 Genetic Analyzer (Applied Biosystems, Foster City, CA, USA). The NoV sequences were assigned using the Norovirus Genotyping Tool [40].
4.5. Modelling of Decay Curves
GInaFiT (Geeraerd and Van Impe Inactivation Model Fitting Tool) [41], a freeware add-in for Microsoft Excel 2010, was used for testing different microbial survival models. Models were selected based on the root mean sum of the squared errors (RMSE). The RMSE can be considered as the simplest and most informative measure of goodness-of-fit, both for linear and non-linear models [42]. The model with the lowest RMSE with a comparable experimental precision was considered the best fit. If the same or similar RMSE values were obtained, the less complex model was considered to fit best [41].
In addition to log-linear model (Equation (1)), three non-linear models; log-linear shoulder tail (Equation (2)), Weibull (Equation (3)), and double Weibull (Equation (4)) models were applied to describe the decay patterns. Log-linear model equation is described as:
where t is the time, N represents the microbial cell density, N(0) the initial microbial cell density, and kmax the first order inactivation constant.
The log-linear shoulder tail equation [43] is described as:
where Nres is the residual population density and S1 represents shoulder length.
The Weibull model equation [44,45] is described as:
where δ is a scale parameter representing the time for achieving 1 log reduction and p is a shape parameter.
The double Weibull model equation [46] is described as:
where the subscripts 1 and 2 indicate the two different subpopulations and α is a parameter varying from negative infinity to positive infinity (Equation (5)):
where f is the fraction of subpopulation 1 in the population.
4.6. Data Analysis
Related-samples Wilcoxon signed rank test was used to assess the statistical significance of differences in log10 reductions between temperatures, matrices, and NoV strains. The statistical analyses were conducted using SPSS 24 software for Windows. In statistical calculations, the method detection limit values were used when a below limit of detection (LOD) result was obtained. Differences were considered significant if the p-value was <0.05. For the decay rate comparison, T90 and T99.99 (the time to reduce 90% and 99.99% of the initial numbers) were determined using the log-linear decay model. For non-linear decay, the time required to reduce the first log10 (TFL) and the time required to reduce fourth log10 (T4L) were determined. Only positive samples providing quantitative data were used in the determination of the decay rates.
Supplementary Materials
The following are available online at https://www.mdpi.com/2076-0817/6/4/48/s1; Table S1. Literature survey of decay rates of norovirus genome in liquid.
Acknowledgments
This research was partly supported by a personal research grant to Ari Kauppinen from the Doctoral School of the University of Eastern Finland. We acknowledge Marjo Tiittanen from the National Institute for Health and Welfare (Kuopio, Finland) for the laboratory assistance.
Author Contributions
A.K. designed and performed the experiments, and analyzed the data; and A.K. and I.T.M. wrote the paper.
Conflicts of Interest
The authors declare no conflict of interest.
References
- Zacheus, O.; Miettinen, I.T. Increased information on waterborne outbreaks through efficient notification system enforces actions towards safe drinking water. J. Water Health 2011, 9, 763–772. [Google Scholar] [CrossRef] [PubMed]
- Belliot, G.; Lopman, B.A.; Ambert-Balay, K.; Pothier, P. The burden of norovirus gastroenteritis: An important foodborne and healthcare-related infection. Clin. Microbiol. Infect. 2014, 20, 724–730. [Google Scholar] [CrossRef] [PubMed]
- Maunula, L.; Klemola, P.; Kauppinen, A.; Soderberg, K.; Ngujen, T.; Pitkänen, T.; Kaijalainen, S.; Simonen, M.L. Enteric viruses in a large waterborne outbreak of acute gastroenteritis in Finland. Food Environ. Virol. 2009, 1, 31–36. [Google Scholar] [CrossRef]
- Sinclair, R.G.; Jones, E.L.; Gerba, C.P. Viruses in recreational water-borne disease outbreaks: A review. J. Appl. Microbiol. 2009, 107, 1769–1780. [Google Scholar] [CrossRef] [PubMed]
- Kauppinen, A.; Al-Hello, H.; Zacheus, O.; Kilponen, J.; Maunula, L.; Huusko, S.; Lappalainen, M.; Miettinen, I.; Blomqvist, S.; Rimhanen-Finne, R. Increase in outbreaks of gastroenteritis linked to bathing water in Finland in summer 2014. Euro Surveill. 2017, 22, 30470. [Google Scholar] [CrossRef] [PubMed]
- Kokkinos, P.; Kozyra, I.; Lazic, S.; Söderberg, K.; Vasickova, P.; Bouwknegt, M.; Rutjes, S.; Willems, K.; Moloney, R.; de Roda Husman, A.M.; et al. Virological Quality of Irrigation Water in Leafy Green Vegetables and Berry Fruits Production Chains. Food Environ. Virol. 2017, 9, 72–78. [Google Scholar] [CrossRef] [PubMed]
- EFSA. Scientific opinion on norovirus (NoV) in oysters: Methods, limits and control options. EFSA J. 2012, 10, 2500. [Google Scholar]
- Murphy, H. Persistence of pathogens in sewage and other water types. In Global Water Pathogens Project. Part 4 Management of Risk from Excreta and Wastewater; Rose, J.B., Jiménez-Cisneros, B., Yates, M., Eds.; Michigan State University: E. Lansing, MI, USA, 2017; Available online: http://www.waterpathogens.org/book/persistence-in-sewage (accessed on 2 October 2017).
- John, D.E.; Rose, J.B. Review of factors affecting microbial survival in groundwater. Environ. Sci. Technol. 2005, 39, 7345–7356. [Google Scholar] [CrossRef] [PubMed]
- Gerba, C.P. Virus occurrence and survival in the environmental waters. In Human Viruses in Water; Bosch, A., Ed.; Elsevier: Amsterdam, The Netherlands, 2007; pp. 91–108. [Google Scholar]
- Yates, M. Persistence of pathogenic microorganisms in fecal wastes and wastewater matrices: An introduction and overview of data considerations. In Global Water Pathogens Project. Part 4 Management of Risk from Excreta and Wastewater; Rose, J.B., Jiménez-Cisneros, B., Yates, M., Eds.; Michigan State University: E. Lansing, MI, USA, 2017; Available online: http://www.waterpathogens.org/book/persistence-of-pathogens-introduction (accessed on 2 October 2017).
- Jones, M.K.; Grau, K.R.; Costantini, V.; Kolawole, A.O.; de Graaf, M.; Freiden, P.; Graves, C.L.; Koopmans, M.; Wallet, S.M.; Tibbetts, S.A.; et al. Human norovirus culture in B cells. Nat. Protoc. 2015, 10, 1939–1947. [Google Scholar] [CrossRef] [PubMed]
- Ettayebi, K.; Crawford, S.E.; Murakami, K.; Broughman, J.R.; Karandikar, U.; Tenge, V.R.; Neill, F.H.; Blutt, S.E.; Zeng, X.L.; Qu, L.; et al. Replication of human noroviruses in stem cell-derived human enteroids. Science 2016, 353, 1387–1393. [Google Scholar] [CrossRef] [PubMed]
- Knight, A.; Haines, J.; Stals, A.; Li, D.; Uyttendaele, M.; Knight, A.; Jaykus, L.A. A systematic review of human norovirus survival reveals a greater persistence of human norovirus RT-qPCR signals compared to those of cultivable surrogate viruses. Int. J. Food Microbiol. 2016, 216, 40–49. [Google Scholar] [CrossRef] [PubMed]
- Knight, A.; Li, D.; Uyttendaele, M.; Jaykus, L.A. A Critical Review of Methods for Detecting Human Noroviruses and Predicting Their Infectivity. Crit. Rev. Microbiol. 2013, 39, 295–309. [Google Scholar] [CrossRef] [PubMed]
- Bae, J.; Schwab, K.J. Evaluation of murine norovirus, feline calicivirus, poliovirus, and MS2 as surrogates for human norovirus in a model of viral persistence in surface water and groundwater. Appl. Environ. Microbiol. 2008, 74, 477–484. [Google Scholar] [CrossRef] [PubMed]
- Charles, K.J.; Shore, J.; Sellwood, J.; Laverick, M.; Hart, A.; Pedley, S. Assessment of the stability of human viruses and coliphage in groundwater by PCR and infectivity methods. J. Appl. Microbiol. 2009, 106, 1827–1837. [Google Scholar] [CrossRef] [PubMed]
- Skraber, S.; Ogorzaly, L.; Helmi, K.; Maul, A.; Hoffmann, L.; Cauchie, H.M.; Gantzer, C. Occurrence and persistence of enteroviruses, noroviruses and F-specific RNA phages in natural wastewater biofilms. Water Res. 2009, 43, 4780–4789. [Google Scholar] [CrossRef] [PubMed]
- Seitz, S.R.; Leon, J.S.; Schwab, K.J.; Lyon, G.M.; Dowd, M.; McDaniels, M.; Abdulhafid, G.; Fernandez, M.L.; Lindesmith, L.C.; Baric, R.S.; et al. Norovirus infectivity in humans and persistence in water. Appl. Environ. Microbiol. 2011, 77, 6884–6888. [Google Scholar] [CrossRef] [PubMed]
- Ngazoa, E.S.; Fliss, I.; Jean, J. Quantitative study of persistence of human norovirus genome in water using TaqMan real-time RT-PCR. J. Appl. Microbiol. 2008, 104, 707–715. [Google Scholar] [CrossRef] [PubMed]
- Liu, P.; Jaykus, L.A.; Wong, E.; Moe, C. Persistence of Norwalk virus, male-specific coliphage, and Escherichia coli on stainless steel coupons and in phosphate-buffered saline. J. Food Prot. 2012, 75, 2151–2157. [Google Scholar] [CrossRef] [PubMed]
- Bertrand, I.; Schijven, J.F.; Sánchez, G.; Wyn-Jones, P.; Ottoson, J.; Morin, T.; Muscillo, M.; Verani, M.; Nasser, A.; de Roda Husman, A.M.; et al. The impact of temperature on the inactivation of enteric viruses in food and water: A review. J. Appl. Microbiol. 2012, 112, 1059–1074. [Google Scholar] [CrossRef] [PubMed]
- Richards, G.P.; Watson, M.A.; Meade, G.K.; Hovan, G.L.; Kingsley, D.H. Resilience of Norovirus GII.4 to freezing and thawing: Implications for virus infectivity. Food Environ. Virol. 2012, 4, 192–197. [Google Scholar] [CrossRef] [PubMed]
- Teunis, P.F.; Moe, C.L.; Liu, P.; Miller, S.E.; Lindesmith, L.; Baric, R.S.; Le Pendu, J.; Calderon, R.L. Norwalk virus: How infectious is it? J. Med. Virol. 2008, 80, 1468–1476. [Google Scholar] [CrossRef] [PubMed]
- Mathijs, E.; Denayer, S.; Palmeira, L.; Botteldoorn, N.; Scipioni, A.; Vanderplasschen, A.; Thiry, E.; Dierick, K. Novel norovirus recombinants and of GII.4 sub-lineages associated with outbreaks between 2006 and 2010 in Belgium. Virol. J. 2011, 8, 310. [Google Scholar] [CrossRef] [PubMed]
- Hoffmann, D.; Mauroy, A.; Seebach, J.; Simon, V.; Wantia, N.; Protzer, U. New norovirus classified as a recombinant GII.g/GII.1 causes an extended foodborne outbreak at a university hospital in Munich. J. Clin. Virol. 2013, 58, 24–30. [Google Scholar] [CrossRef] [PubMed]
- Loury, P.; Le Guyader, F.S.; Le Saux, J.C.; Ambert-Balay, K.; Parrot, P.; Hubert, B. A norovirus oyster-related outbreak in a nursing home in France, January 2012. Epidemiol. Infect. 2015, 143, 2486–2493. [Google Scholar] [CrossRef] [PubMed]
- Bruggink, L.D.; Dunbar, N.L.; Marshall, J.A. Emergence of GII.Pg norovirus in gastroenteritis outbreaks in Victoria, Australia. J. Med. Virol. 2016, 88, 1521–1528. [Google Scholar] [CrossRef] [PubMed]
- Verhaelen, K.; Bouwknegt, M.; Lodder-Verschoor, F.; Rutjes, S.A.; de Roda Husman, A.M. Persistence of human norovirus GII.4 and GI.4, murine norovirus, and human adenovirus on soft berries as compared with PBS at commonly applied storage conditions. Int. J. Food Microbiol. 2012, 160, 137–144. [Google Scholar] [CrossRef] [PubMed]
- Bozkurt, H.; D’Souza, D.H.; Davidson, P.M. A comparison of the thermal inactivation kinetics of human norovirus surrogates and hepatitis A virus in buffered cell culture medium. Food Microbiol. 2014, 42, 212–217. [Google Scholar] [CrossRef] [PubMed]
- Kim, D.K.; Kim, S.J.; Kang, D.H. Inactivation modeling of human enteric virus surrogates, MS2, Qβ, and ΦX174, in water using UVC-LEDs, a novel disinfecting system. Food Res. Int. 2017, 91, 115–123. [Google Scholar] [CrossRef] [PubMed]
- Kauppinen, A.; Pitkänen, T.; Miettinen, I.T. Persistent norovirus contamination of groundwater supplies in two waterborne outbreaks. Food Environ. Virol. 2017. [Google Scholar] [CrossRef]
- Lopman, B.; Gastañaduy, P.; Park, G.W.; Hall, A.J.; Parashar, U.D.; Vinjé, J. Environmental transmission of norovirus gastroenteritis. Curr. Opin. Virol. 2012, 2, 96–102. [Google Scholar] [CrossRef] [PubMed]
- The Finnish Meteorological Institute’s Open Data. Available online: http://suja.kapsi.fi/fmi-tilastot.php (accessed on 10 August 2017).
- Drinking Water Quality in Kuopio in the Year 2016. Available online: http://www.kuopionvesi.fi/c/document_library/get_file?uuid=e825c3bf-f87a-4012-b4f3-65e3c6453c03&groupId=518539 (accessed on 7 September 2017).
- Loisy, F.; Atmar, R.L.; Guillon, P.; Le Cann, P.; Pommepuy, M.; Le Guyader, F.S. Real-time RT-PCR for norovirus screening in shellfish. J. Virol. Methods 2005, 123, 1–7. [Google Scholar] [CrossRef] [PubMed]
- Kageyama, T.; Kojima, S.; Shinohara, M.; Uchida, K.; Fukushi, S.; Hoshino, F.B.; Takeda, N.; Katayama, K. Broadly reactive and highly sensitive assay for Norwalk-like viruses based on real-time quantitative reverse transcription-PCR. J. Clin. Microbiol. 2003, 41, 1548–1557. [Google Scholar] [CrossRef] [PubMed]
- Vinjé, J.; Hamidjaja, R.A.; Sobsey, M.D. Development and application of a capsid VP1 (region D) based reverse transcription PCR assay for genotyping of genogroup I and II noroviruses. J. Virol. Methods 2004, 116, 109–117. [Google Scholar] [CrossRef] [PubMed]
- Kojima, S.; Kageyama, T.; Fukushi, S.; Hoshino, F.B.; Shinohara, M.; Uchida, K.; Natori, K.; Takeda, N.; Katayama, K. Genogroup-specific PCR primers for detection of Norwalk-like viruses. J. Virol. Methods 2002, 100, 107–114. [Google Scholar] [CrossRef]
- Kroneman, A.; Vennema, H.; Deforche, K.; Avoort, H.V.; Peñaranda, S.; Oberste, M.S.; Vinjé, J.; Koopmans, M. An automated genotyping tool for enteroviruses and noroviruses. J. Clin. Virol. 2011, 51, 121–125. [Google Scholar] [CrossRef] [PubMed]
- Geeraerd, A.H.; Valdramidis, V.P.; Van Impe, J.F. GInaFiT, a freeware tool to assess non-log-linear microbial survivor curves. Int. J. Food. Microbiol. 2005, 102, 95–105. [Google Scholar] [CrossRef] [PubMed]
- Ratkowsky, D.A. Model Fitting and Uncertainty. In Modeling Microbial Responses in Food; McKellar, R.C., Lu, X., Eds.; CRC Press: Boca Raton, FL, USA, 2003; pp. 151–196. [Google Scholar]
- Geeraerd, A.H.; Herremans, C.H.; Van Impe, J.F. Structural model requirements to describe microbial inactivation during a mild heat treatment. Int. J. Food Microbiol. 2000, 59, 185–209. [Google Scholar] [CrossRef]
- Mafart, P.; Couvert, O.; Gaillard, S.; Leguerinel, I. On calculating sterility in thermal preservation methods: Application of the Weibull frequency distribution model. Int. J. Food Microbiol. 2002, 72, 107–113. [Google Scholar] [CrossRef]
- Van Boekel, M.A. On the use of the Weibull model to describe thermal inactivation of microbial vegetative cells. Int. J. Food Microbiol. 2002, 74, 139–159. [Google Scholar] [CrossRef]
- Coroller, L.; Leguerinel, I.; Mettler, E.; Savy, N.; Mafart, P. General model, based on two mixed weibull distributions of bacterial resistance, for describing various shapes of inactivation curves. Appl. Environ. Microbiol. 2006, 72, 6493–6502. [Google Scholar] [CrossRef] [PubMed]
Figure 1.
Persistence of the NoV genome in drinking water at different temperatures. (A) NoV GII_A and (B) NoV GII_B. Identified curves represent the modelled decay of best fit. At 3 °C and 36 °C, log-linear modelled curves are presented, and at 21 °C Weibull and double Weibull modelled curves for GII_A and GII_B are shown, respectively. Error bars show the standard deviation for duplicate extractions. Below limit of quantitation (LOQ) results are shown with an asterisk (*), but not fitted in curves.

Figure 2.
Persistence of the NoV genome in wastewater at different temperatures. (A) NoV GII_A, (B) NoV GII_B, and (C) NoV GII_ind. Identified curves represent the modelled decay of best fit. At 3 °C double Weibull modelled curves for GII_A and GII_B, and log-linear shoulder tail modelled curve for GII_ind are shown. At 21 °C, log-linear shoulder tail and at 36 °C, log-linear modelled curves are presented. Error bars show the standard deviation for duplicate extractions. Below LOQ results are shown with an asterisk (*), but not fitted in curves.


Table 1.
Summary of the persistence results using the first-order log-linear and/or non-linear decay models. RMSE = root mean sum of squared error. DW = drinking water. WW = wastewater.
Table 1.
Summary of the persistence results using the first-order log-linear and/or non-linear decay models. RMSE = root mean sum of squared error. DW = drinking water. WW = wastewater.
| Log-Linear Model | Non-Linear Model | ||||||||||
|---|---|---|---|---|---|---|---|---|---|---|---|
| T | Water | Virus | kmax | R2 | RMSE | R2 | RMSE | ||||
| 3 °C | DW | GII_A | N/A 1 | N/A | |||||||
| GII_B | N/A | N/A | |||||||||
| Double Weibull | |||||||||||
| α | δ1 | p | δ2 | ||||||||
| WW | GII_A | 0.06 ± 0.001 | 0.957 | 0.30 | 2.46 ± 0.20 | 57.06 ± 2.68 | 2.80 ± 0.44 | 158.5 ± 21.9 | 0.996 | 0.11 | |
| GII_B | 0.05 ± 0.002 | 0.986 | 0.14 | 2.63 ± 0.56 | 50.06 ± 1.94 | 1.38 ± 0.11 | 453.3 ± 959.1 | 0.999 | 0.05 | ||
| Log-linear shoulder tail | |||||||||||
| S1 | kmax | Log10(Nres) | |||||||||
| GII_ind | 0.02 ± 0.003 | 0.801 | 0.20 | 58.85 ± 3.64 | 0.23 ± 0.17 | 2.82 ± 0.05 | 0.967 | 0.09 | |||
| Weibull | |||||||||||
| δ | p | ||||||||||
| 21 °C | DW | GII_A | 0.01 ± 0.001 | 0.885 | 0.22 | 298.2 ± 8.6 | 2.63 ± 0.36 | 0.983 | 0.09 | ||
| Double Weibull | |||||||||||
| α | δ1 | p | δ2 | ||||||||
| GII_B | 0.02 ± 0.002 | 0.962 | 0.28 | 2.20 ± 0.20 | 131.6 ± 10.3 | 3.84 ± 1.24 | 370.3 ± 25.7 | 0.995 | 0.11 | ||
| Log-linear shoulder tail | |||||||||||
| S1 | kmax | Log10(Nres) | |||||||||
| WW | GII_A | 0.04 ± 0.010 | 0.577 | 0.80 | 9.42 ± 0.30 | 0.54 ± 0.02 | 4.18 ± 0.01 | 0.999 | 0.03 | ||
| GII_B | 0.06 ± 0.020 | 0.544 | 1.35 | 4.71 ± 0.73 | 0.59 ± 0.03 | 2.14 ± 0.04 | 0.998 | 0.10 | |||
| GII_ind | 0.02 ± 0.005 | 0.636 | 0.31 | 8.40 ± 2.25 | 0.30 ± 0.09 | 2.48 ± 0.04 | 0.972 | 0.10 | |||
| 36 °C | DW | GII_A | 0.04 ± 0.003 | 0.967 | 0.31 | N/A | |||||
| GII_B | 0.07 ± 0.004 | 0.988 | 0.06 | N/A | |||||||
| WW | GII_A | 0.21 ± 0.010 | 0.996 | 0.11 | N/A | ||||||
| GII_B | 0.18 ± 0.010 | 0.982 | 0.19 | N/A | |||||||
| GII_ind | 0.05 ± 0.010 | 0.880 | 0.07 | N/A | |||||||
1 N/A, not applicable.
Table 2.
Decay rates of the NoV genome under different temperatures and water matrices. T90 and T99.99 values (days) for log-linear decay, and TFL and T4L (time required to achieve 1 and 4 log10 reduction, respectively) values (days) for non-linear decay are presented. DW = drinking water. WW = wastewater.
| Log-Linear | Non-Linear | ||||||
|---|---|---|---|---|---|---|---|
| T | Water | Virus | Best Fitting Model | T90 | T99.99 | TFL | T4L |
| 3 °C | DW | GII_A | N/A 1 | Na2 | Na | Na | Na |
| GII_B | N/A | Na | Na | Na | Na | ||
| WW | GII_A | Double Weibull | 38 | 154 | 57 | 185 | |
| GII_B | Double Weibull | 45 | 179 | 50 | 569 | ||
| GII_ind | Log-linear shoulder tail | 115 | 461 | Na | Na | ||
| 21 °C | DW | GII_A | Weibull | 230 | 921 | 298 | 505 |
| GII_B | Double Weibull | 115 | 461 | 132 | 431 | ||
| WW | GII_A | Log-linear shoulder tail | 58 | 230 | 14 | Na | |
| GII_B | Log-linear shoulder tail | 38 | 154 | 8 | 21 | ||
| GII_ind | Log-linear shoulder tail | 115 | 461 | 19 | Na | ||
| 36 °C | DW | GII_A | Log-linear | 58 | 230 | N/A | N/A |
| GII_B | Log-linear | 33 | 132 | N/A | N/A | ||
| WW | GII_A | Log-linear | 11 | 44 | N/A | N/A | |
| GII_B | Log-linear | 13 | 51 | N/A | N/A | ||
| GII_ind | Log-linear | 46 | 184 | N/A | N/A | ||
1 N/A, not applicable; 2 Na, not achieved.
Table 3.
Description of NoV inoculums.
| GII_A | GII_B | |
|---|---|---|
| Patient age and gender | 29 years Female | 2 years Female |
| Assumed exposure | 1 April 2011 | Not known |
| Symptoms started | 2 April 2011 | 23–24 February 2012 |
| Stool sample taken | 3 April 2011 | 25 February 2012 |
| Symptoms relieved | 4 April 2011 | 26 February 2012 |
| Storage prior to preparation of inoculum | Immediately at −20 °C (five years and 26 days) | One week outdoors at an average temperature of −4.6 °C (range −20–5.2 °C) [34], including three putative freeze thaw cycles, and then 4 March 2012 at −20 °C (four years, one month and 25 days) |
Table 4.
The physical-chemical properties of the drinking water and wastewater.
| Drinking Water [35] | Wastewater | |
|---|---|---|
| Turbidity, FTU | 0.1 | 23.15 |
| Color, mg Pt L−1 | <5 | Nd 1 |
| pH | 7.7 | 7.03 |
| Conductivity, μS cm−1 | 263 | 1026 |
| TOC 2, mg C L−1 | 2.1 | Nd |
| Free chlorine, mg Cl2 L−1 | 0.33 | Nd |
1 Nd, no data; 2 TOC, total organic carbon.
© 2017 by the authors. Licensee MDPI, Basel, Switzerland. This article is an open access article distributed under the terms and conditions of the Creative Commons Attribution (CC BY) license (http://creativecommons.org/licenses/by/4.0/).
Share and Cite
MDPI and ACS Style
Kauppinen, A.; Miettinen, I.T. Persistence of Norovirus GII Genome in Drinking Water and Wastewater at Different Temperatures. Pathogens 2017, 6, 48. https://doi.org/10.3390/pathogens6040048
AMA Style
Kauppinen A, Miettinen IT. Persistence of Norovirus GII Genome in Drinking Water and Wastewater at Different Temperatures. Pathogens. 2017; 6(4):48. https://doi.org/10.3390/pathogens6040048
Chicago/Turabian StyleKauppinen, Ari, and Ilkka T. Miettinen. 2017. "Persistence of Norovirus GII Genome in Drinking Water and Wastewater at Different Temperatures" Pathogens 6, no. 4: 48. https://doi.org/10.3390/pathogens6040048
Note that from the first issue of 2016, this journal uses article numbers instead of page numbers. See further details here.