Article

Social Determinants of Stroke Hospitalization and Mortality in United States’ Counties

1
Geisinger Neuroscience Institute, Geisinger Health System, Danville, PA 17822, USA
2
Department of Pediatrics, University of Florida College of Medicine, Jacksonville, FL 32207, USA
3
Department of Neurology, Penn State Health Milton S. Hershey Medical Center, Hershey, PA 17033, USA
4
Department of Molecular and Functional Genomics, Weis Center for Research, Geisinger Health System, Danville, PA 17822, USA
5
Departments of Clinical Neurological Sciences and Epidemiology, University of Western Ontario, London, ON N6A 3K7, Canada
6
Department of Public Health Sciences, College of Medicine, The Pennsylvania State University, Hershey, PA 17033, USA
7
Neuroscience Institute, The Pennsylvania State University, Hershey, PA 17033, USA
*
Author to whom correspondence should be addressed.
These authors contributed equally to this work.
J. Clin. Med. 2022, 11(14), 4101; https://doi.org/10.3390/jcm11144101
Submission received: 2 March 2022 / Revised: 29 May 2022 / Accepted: 28 June 2022 / Published: 15 July 2022
(This article belongs to the Section Vascular Medicine)

Abstract

:
(1) Background: Stroke incidence and outcomes are influenced by socioeconomic status. There is a paucity of reported population-level studies regarding these determinants. The goal of this ecological analysis was to determine the county-level associations of social determinants of stroke hospitalization and death rates in the United States. (2) Methods: Publicly available data as of 9 April 2021, for the socioeconomic factors and outcomes, was extracted from the Centers for Disease Control and Prevention. The outcomes of interest were “all stroke hospitalization rates per 1000 Medicare beneficiaries” (SHR) and “all stroke death rates per 100,000 population” (SDR). We used a multivariate binomial generalized linear mixed model after converting the outcomes to binary based on their median values. (3) Results: A total of 3226 counties/county-equivalents of the states and territories in the US were analyzed. Heart disease prevalence (odds ratio, OR = 2.03, p < 0.001), blood pressure medication nonadherence (OR = 2.02, p < 0.001), age-adjusted obesity (OR = 1.24, p = 0.006), presence of hospitals with neurological services (OR = 1.9, p < 0.001), and female head of household (OR = 1.32, p = 0.021) were associated with high SHR while cost of care per capita for Medicare patients with heart disease (OR = 0.5, p < 0.01) and presence of hospitals (OR = 0.69, p < 0.025) were associated with low SHR. Median household income (OR = 0.6, p < 0.001) and park access (OR = 0.84, p = 0.016) were associated with low SDR while no college degree (OR = 1.21, p = 0.049) was associated with high SDR. (4) Conclusions: Several socioeconomic factors (e.g., education, income, female head of household) were found to be associated with stroke outcomes. Additional research is needed to investigate intermediate and potentially modifiable factors that can serve as targeted interventions.

1. Introduction

The World Health Organization has broadly defined social determinants of health as “the circumstances in which people are born, grow, live, work, and age, and the systems put in place to deal with illness [1].” The American Heart Association has considered socio-economic position (SEP, incorporating wealth and income, education, employment/occupational status, and other factors), race and ethnicity, social support (including social networks), culture (including language), access to medical care, and residential environments as the determinants of cardiovascular diseases [2].
The associations of SEP with stroke incidence and outcomes, such as hospitalization, mortality, and disability in the United States (US), are evident as shown by previous studies (Table S1 in the Supplementary Materials) [3,4,5,6,7,8,9,10]. Similar associations have been noted with other determinants, such as access to care, environment, social support, ethnicity, and culture [6,11,12,13]. Various studies have reported the association of stroke incidence and outcome with one or few social determinants. However, there is a paucity of reported population-level studies on the association of stroke hospitalization and mortality with a large set of social determinants. Ecological studies are useful to study large numbers of variables from existing data sets. The goal of this ecological county-level study was to determine the association between social determinants and stroke hospitalization and mortality rates in the US. We hypothesized that social determinants have associations with stroke hospitalization and death rates and variations might exist in the strength and direction in various geographic regions.

2. Materials and Methods

We conducted an ecological analysis of social determinants of stroke hospitalization and death rates in 3226 counties/county-equivalents of the states and territories of the US. The study was conducted and reported according to the Strengthening the Reporting of Observational Studies in Epidemiology (STROBE) guidelines.

2.1. Study Population and Outcome Measures

This study comprised an analysis of sixteen predictor variables and two outcome variables across all the counties/county-equivalents of the states and territories in the US. The outcomes of interest for this study were all stroke hospitalization rate (SHR) per 1000 Medicare beneficiaries in 2015–2017, and all stroke death rate (SDR) per 100,000 population in 2016–2018. The SDR represented individuals of all ages irrespective of race/ethnicity and gender. On the other hand, SHR represented only Medicare beneficiaries (65+ years) irrespective of race/ethnicity and gender. The median value of the outcomes was used to define two groups of each outcome—those with higher and lower SHR and SDR.

2.2. Data Elements

We extracted publicly available data for the predictor and outcome variables from the “Interactive Atlas of Heart Disease and Stroke” website of the Centers for Disease Control and Prevention (CDC) [14]. The data elements available at the CDC were compiled from various sources (https://www.cdc.gov/dhdsp/maps/atlas/data-sources.html, accessed on 9 April 2021). All the data elements, their respective definitions, and data sources are included in Table S2 in the Supplementary Materials.
Data elements in this study included county-level variables associated with socioeconomic status (SES), healthcare access, and risk factors. The predictors considered for both SHR and SDR were the presence of hospitals (with and without neurological services) in the county, age-adjusted obesity, age-adjusted physical inactivity, age-adjusted diabetes, income inequality (Gini index), female head of household, no college degree, park access, and food assistance. Median household income, poverty, and unemployment data were only available for the year 2018 and thus these were only considered for SDR and not SHR. Cost of care, heart disease prevalence, and blood pressure medication nonadherence data were only available for Medicare beneficiaries and thus these were only considered for SHR.

2.3. Statistical Analysis

Descriptive statistics such as median ± inter-quartile range (IQR) were used for continuous variables and count and percentage were used for categorical variables. Further, the counties were divided into two groups with low or high rates of outcome based on their median value. For comparison between the two groups, Mann–Whitney U-test was used for continuous variables and Pearson’s chi-squared test was used for categorical variables. Pearson’s correlation coefficient was used to calculate the correlation between the variables. For both predictor and outcome variables, values outside of three IQRs were removed as outliers and the variables were scaled and centered. These removed outlier values were treated as missing values. The missingness percentage was calculated for each variable.
To examine the association between the predictors and the outcomes, first, a univariate binomial generalized linear mixed model was used and all predictor variables with p < 0.1 were included in the multivariate model. A multivariate binomial generalized linear mixed model was used in which the state of the county was included as a random effect and the median age of the county, population density, and the demographics of the county (percentage of Caucasian, African American, Hispanic/Latino, Asian population) were used as covariates. We applied a multivariate binomial generalized linear mixed model which aims to minimize the false-positive associations due to population or relatedness structure and to increase the power by applying a specific correction to such structures [15]. Variance inflation factor (VIF) was used to examine multicollinearity and variables with VIF > 5 were excluded from the multivariate model.
In addition, standardized hospitalization ratio and standardized mortality ratio were calculated using the national population as the reference (stroke hospitalization rate = 11.7 per 1000 Medicare beneficiaries; stroke death rate = 37.4 per 100,000). The log of standardized hospitalization ratio and standardized mortality ratio were modeled weighted by expected outcome counts for each county.
A p-value of less than 0.05 was considered significant for all analyses. All statistical analyses were performed using R version 4.0.3 (R Foundation for Statistical Computing, Vienna, Austria) [16].

3. Results

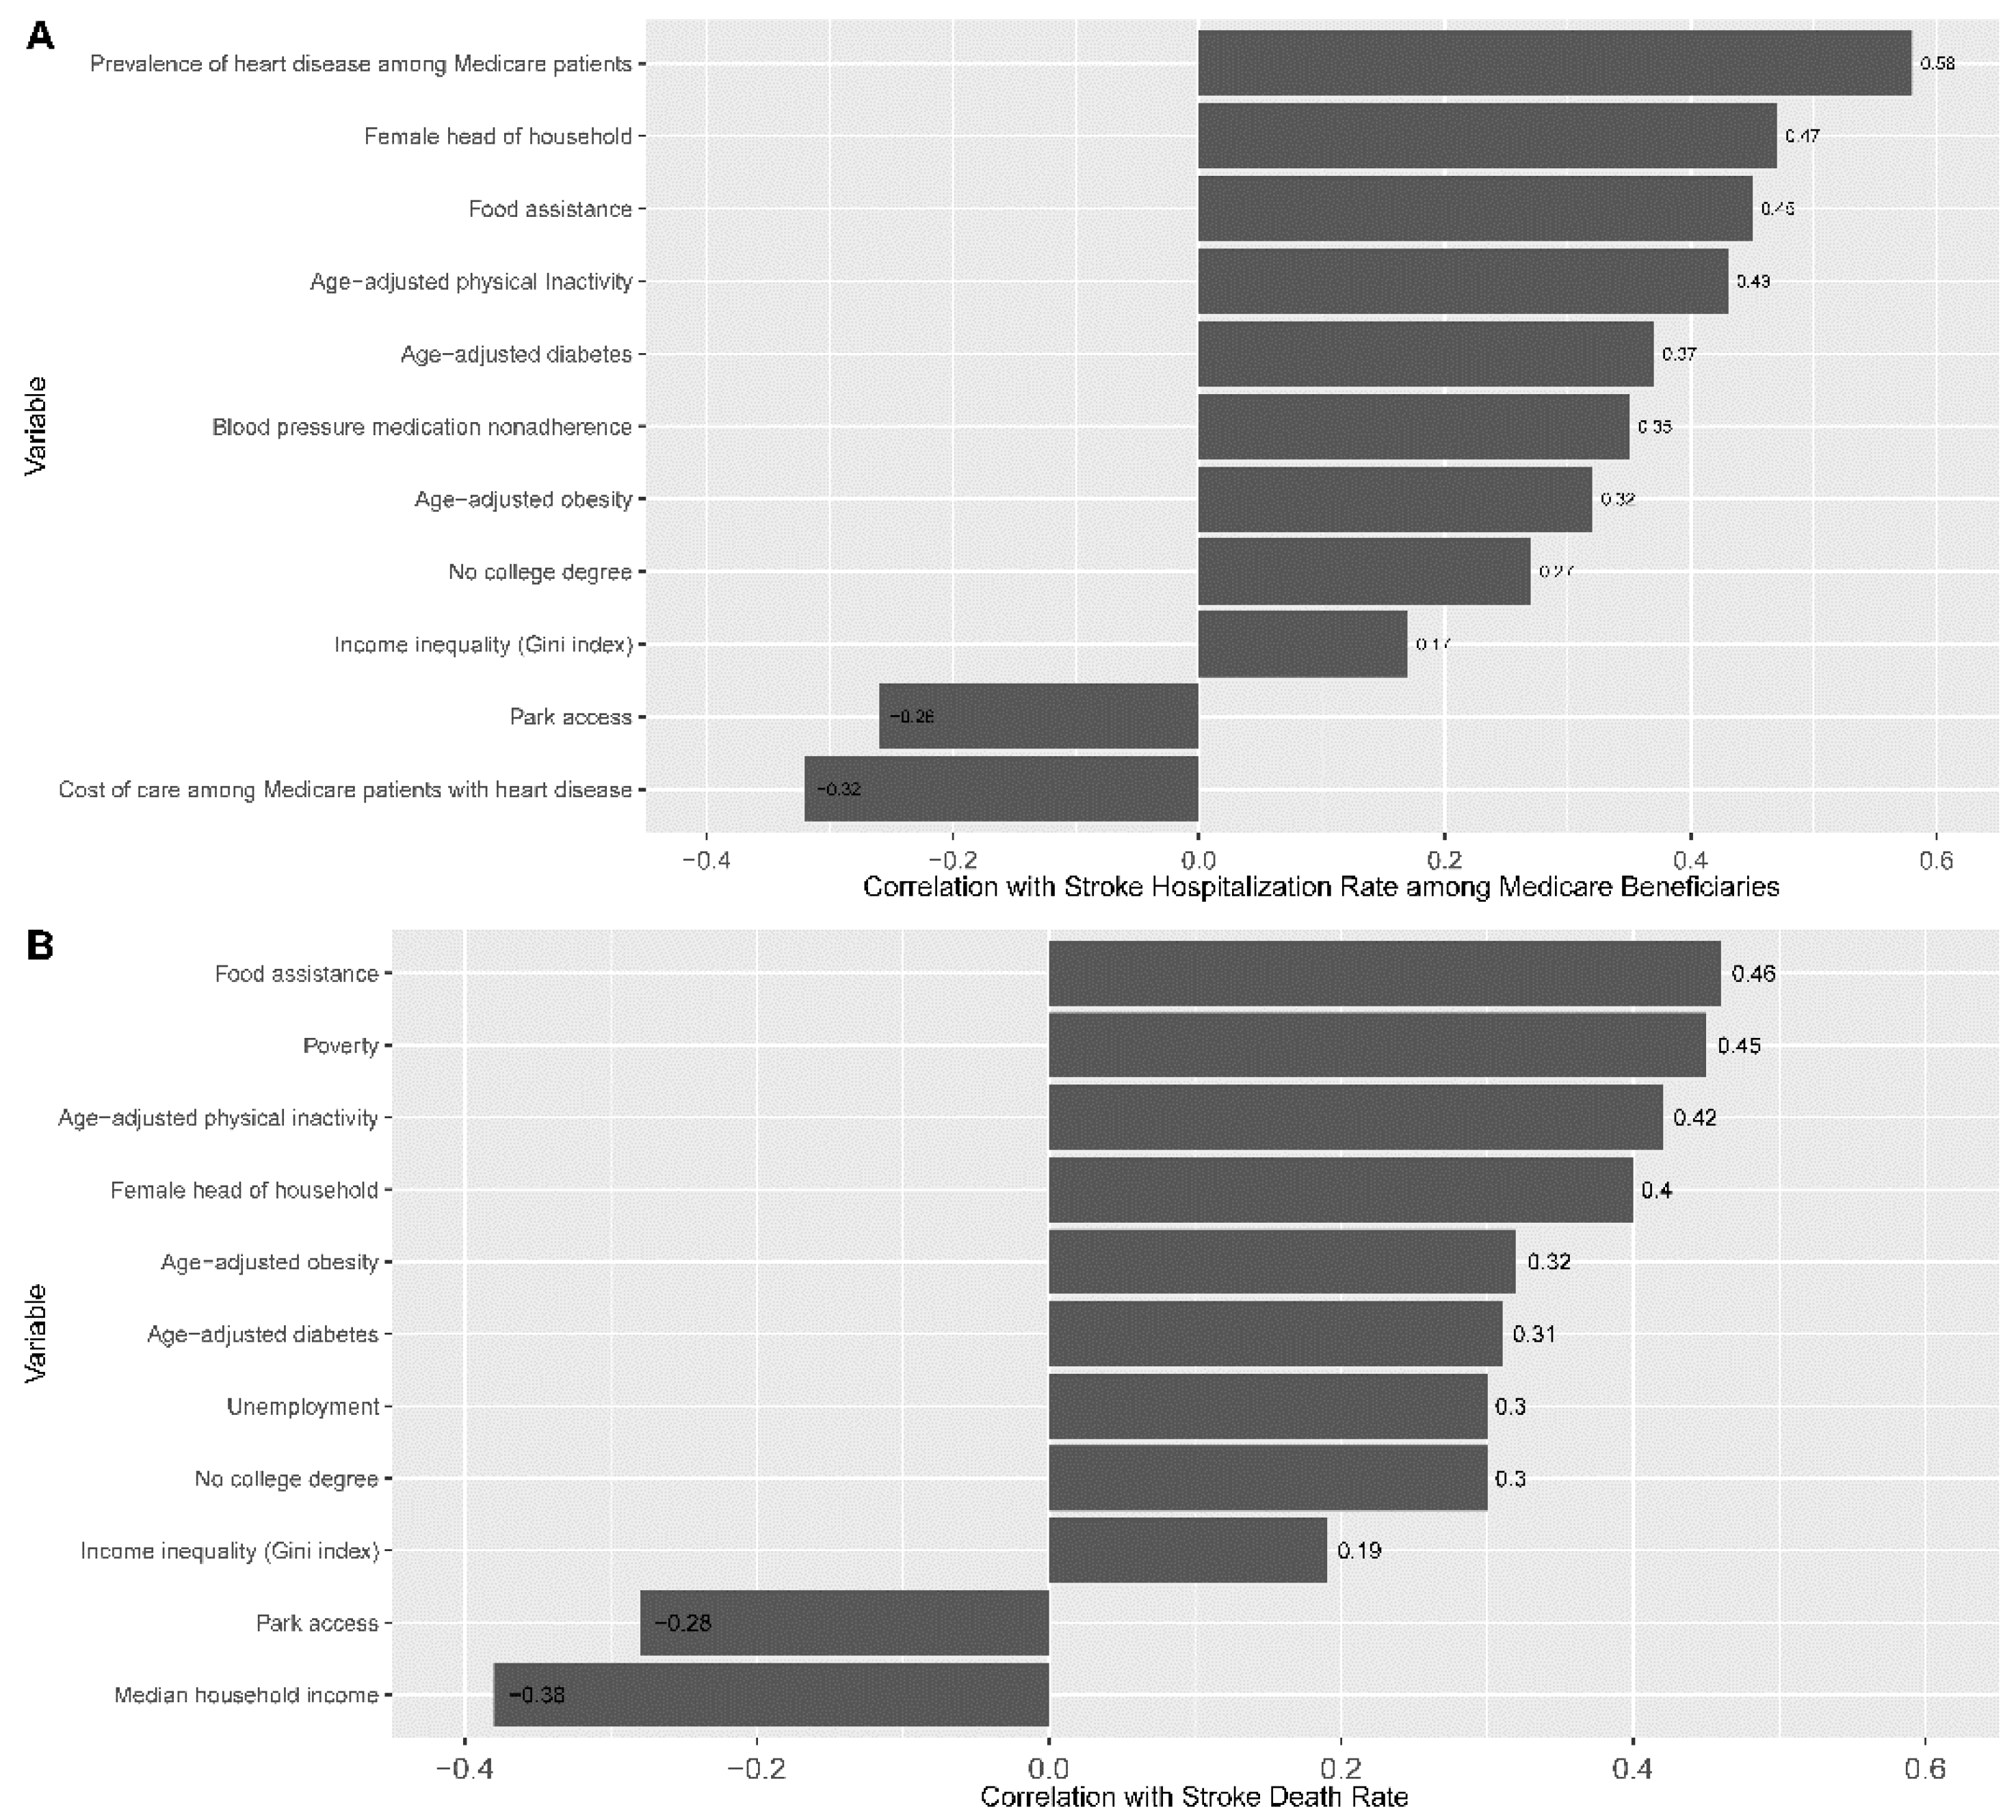
3.1. Social Determinants and Their Correlation with Outcomes

The median (IQR) SHR was 11.7 (9.5–13.3) per 1000 Medicare beneficiaries while the median SDR was 39.0 (33.8–44.2) per 100,000. The median household income was found to be USD 51,000 (IQR 44,000–59,000). People living in poverty, food assistance recipients, and the unemployment rate were found to be 14.1% (IQR 10.8–18.3%), 12.9% (IQR 8.6–17.9%), and 3.9% (IQR 3.1–4.9%), respectively. Further, the proportion of families with a female head of the household was 10.6% (IQR 8.4–13.4%). As for education, 80.7% (IQR 74.5–84.9%) did not have four years of college (Table 1).
We observed a median (IQR) rate of 25.9% (22.5–29.6%) for age-adjusted physical inactivity, 33.0% (28.9–36.6%) for obesity, and 10.0% (7.8–12.7%) for diabetes in the counties/county-equivalents of the states and territories in the US. Among the Medicare beneficiaries, the prevalence of heart disease was 35.6% (31.9–39.5), and the cost of care per capita with heart disease at outpatient was USD 3972 (3223–5091). Moreover, only 14.0% (4.0–30.0%) of the US population had access to a park within half a mile proximity (Table 1).
We also found variations in the access to care across the counties/county-equivalents. While 77% of counties/county-equivalents had one or more hospitals, only 28.8% were found to have a hospital with neurological services (Table 1).
Heart disease among Medicare beneficiaries (r = 0.58), female head of household (r = 0.47), and food assistance (r = 0.45) were the top three socioeconomic factors with the highest positive correlations with SHR, while the cost of care (r = −0.32) and park access (r = −0.26) were negatively correlated with SHR. For SDR, food assistance (r = 0.46), poverty (r = 0.45), and age-adjusted physical inactivity (r = 0.42) were the three factors with the highest positive correlations, while household income (r = −0.38) and park access (r = −0.28) were negatively correlated with SDR. The correlation between other predictors and outcomes is shown in Figure 1A,B. The correlation matrix and heatmap of all predictor variables are given in Figure S1 in the Supplementary Materials.

3.2. Comparison between Counties with Low vs. High Rate of Outcomes

The counties with a higher SHR and SDR had a higher proportion of patients with age-adjusted physical inactivity, age-adjusted obesity, and age-adjusted diabetes (all p < 0.001). Similarly, the counties with lower rates of SHR and SDR had a higher percentage of population with access to a park within half-a-mile proximity, and a lower percentage of population without four years of college (all p < 0.001). The presence of hospitals in the counties/county-equivalents was associated with lower SHR (p < 0.010) and SDR (p < 0.068). Further, the presence of hospital(s) with neurological services in the counties/county-equivalents was associated with higher SHR but lower SDR (all p < 0.012).
Among Medicare beneficiaries, the counties with higher SHR also had a higher percentage of the population with heart disease, and non-adherence to blood pressure medication while the higher cost of care for heart disease was seen in counties with lower SHR. In the case of death rates, counties with higher SDR had more income inequality, people living in poverty, food assistance recipients, unemployment, uninsured, and households with a female head while those counties with lower SDR had higher household income (Table 1).

3.3. Social Determinants Associated with Stroke Hospitalization Rate (SHR)

Except for income inequality, the unadjusted odd ratios (OR) of all independent variables considered for SHR were significant in the univariate analyses (Table 2). In the multivariate binomial generalized linear mixed model, heart disease prevalence (OR = 2.03, 95% CI 1.66–2.49, p < 0.001), blood pressure medication nonadherence (OR = 2.02, 95% CI 1.5–2.73, p < 0.001), age-adjusted obesity (OR = 1.24, 95% CI 1.06–1.44, p = 0.006), presence of hospitals with neurological services (OR = 1.9, 95% CI 1.41–2.57 p < 0.001), and female head of household (OR = 1.32, 95% CI 1.04–1.67, p = 0.021) were associated with high SHR while cost of care per capita for Medicare patients with heart disease (OR = 0.5, 95% CI 0.42–0.6, p < 0.01) and presence of hospital (OR = 0.69, 95% CI 0.5–0.95, p < 0.025) were associated with low SHR (Table 2).
All variables which were significant to the multivariate binomial mixed model were also significant in the model for log standardized hospitalization ratio except for age-adjusted obesity and presence of hospital (Table S3 in Supplementary Materials).

3.4. Social Determinants Associated with Stroke Death Rate (SDR)

In the univariate analyses, all variables except presence of hospital were shown to have significant unadjusted OR (Table 3). In the multivariate binomial generalized linear mixed model, median household income (OR = 0.69, 95% CI 0.57–0.83, p < 0.01) and park access (OR = 0.85, 95% CI 0.74–0.98, p = 0.023) were associated with low SDR while no college degree (OR = 1.24, 95% CI 1.03–1.5, p = 0.024) was associated with high SDR (Table 3).
All variables which were significant in the multivariate binomial mixed model were also significant in the model for log standardized mortality ratio. In addition, female head of household was also found to be significantly associated with outcome in the model for log standardized mortality ratio (Table S4 in Supplementary Materials).

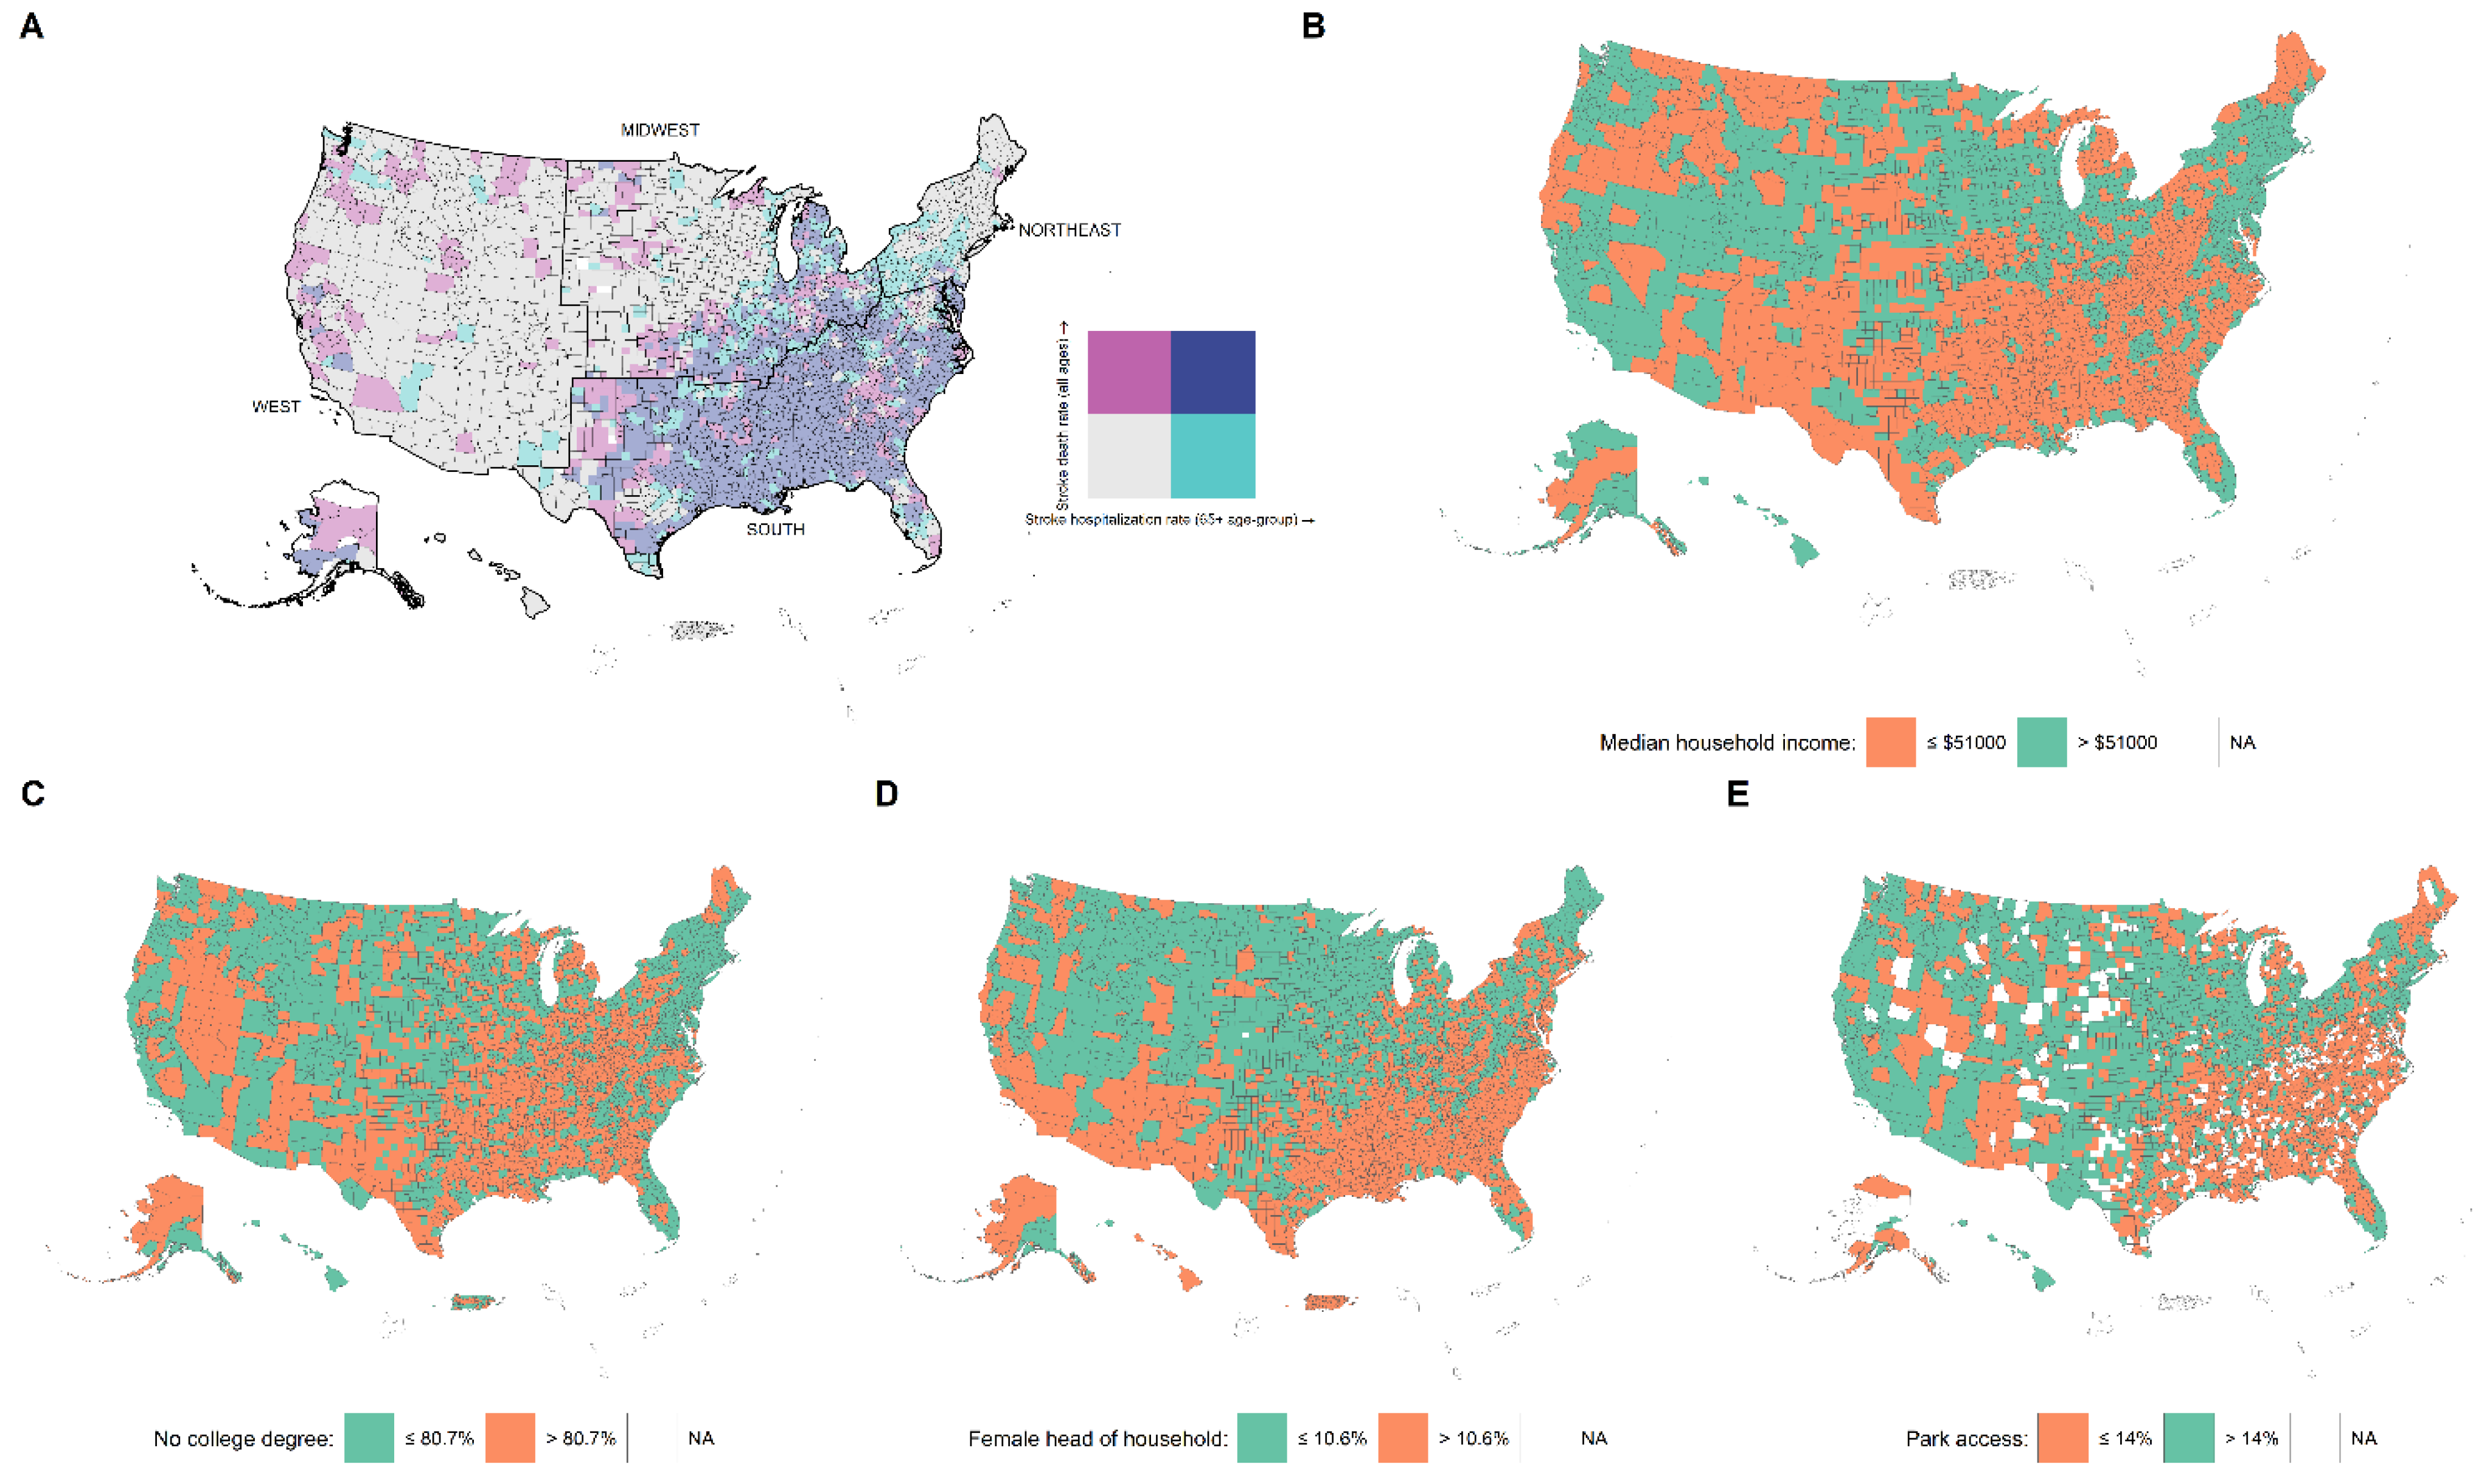
3.5. Variations in Stroke Outcomes and Social Determinants by the US Census Regions

High SHR and SDR were mostly seen in the South census region followed by the eastern part of the Midwest region (Figure 2A). Socioeconomic determinants which were significant in the multivariate models, such as income, education, female head of household, and even park access, show a similar pattern to the stroke outcomes (Figure 2B–E). A map of US counties showing the pattern of the other significant predictors is given in Figure S2 in the Supplementary Materials.

4. Discussion

Our findings have shown that socioeconomic determinants, such as income, education, female head of household, and park access, are significantly associated with stroke outcomes in multivariate analyses. Other significant predictors were prevalence of heart disease, blood pressure medication nonadherence, cost of care, age-adjusted obesity, and presence/absence of hospitals with neurological services.
Prior studies have identified socioeconomic disparities in ischemic and hemorrhagic stroke [10,17,18,19,20]. SES has been noted to have an inverse association with stroke incidence and mortality in the US (Table S1 in the Supplementary Materials) while low income was observed to be independently associated with stroke [21]. Similar to the US, the associations of socioeconomic disparities with stroke have been found across other nations showing that socioeconomic disparities increased stroke mortality risk [22,23], stroke mortality [23,24,25], both short-term and long-term stroke outcomes [22,26,27,28], and disability [5,23,29,30]. Findings support the hypothesis of double suffering, i.e., population with lower SES have more long-term illness and experience it with greater intensity and frequency [31]. The observed differences in illness severity can be partly explained by socioeconomic factors such as income [31]. Moreover, the interplay between SES, the actual risk of stroke, stroke risk factors, health access, and health insurance is complex, resulting in different patterns of associations [32].
Lower SEP is highly associated with modifiable risk factors while almost half of the stroke mortalities are due to its poor management. Thus, it is important to consider the high-risk population of lower SEP for targeted stroke prevention efforts [25,28]. Physical activity is a modifiable factor which can be promoted for primary prevention. The number of parks in urban cities is positively associated with physical activity [33], better psychological health, and a cleaner environment while park-based physical activity is negatively associated with park distance [34].
Studies have shown associations of stroke targeted care with better stroke outcomes. At stroke centers, a 2.5% absolute reduction in 30-day mortality was noted [35] while the number needed to treat (NNT) to prevent stroke was found to be 29 versus 40 at general hospitals [36]. In the same manner, stroke units were found to be associated with a lower rate of mortality and decreased length of stay [37,38,39,40]. This study showed that counties/county-equivalents with the presence of hospitals with neurological services had a higher than median SHR but lower than median SDR. Neurological and technical advances in diagnostic modalities, stroke treatment, care, and preventive strategies have a great impact on stroke mortality [41]. Counties/county-equivalents in the US with neurological facilities might have higher SHR due to referral from nearby regions while better diagnosis and treatment could have subsequently reduced the mortality.
There has been a significant geographical variation in the burden of stroke in the US that has persisted over decades [42,43]. In this regard, the Southeastern region of the US is known as the stroke belt owing to its higher stroke mortality rate [42,44,45]. Similarly, stroke incidence [46,47,48] and stroke case-fatality have also shown regional variations [49]. Such findings were consistent with our study. Stroke incidence only partly explains the disparities in stroke mortality, which is further associated with other factors such as racial and geographical disparities [46]. In Canada, the incidence and mortality rate of cardiovascular diseases declined at the national level [50] and province-based level [51,52]; however, these trends were heterogeneous across specific vascular conditions, in terms of magnitude [53] and unexpected peaks, such as a higher rate of stroke admissions for younger Canadians [54]. Some variations can even be seen locally. In Ontario, for example, vascular death varied from 3.2 to 5.7 events per 1000 person-years across Local Health Integration Networks, which may be due to differences in patient characteristics and the health system [55]. Likewise, disparities in health access [56], obesity, physical activity [57], diabetes, and cardiovascular diseases [58] have been reported based on the level of urbanization.
Structural inequities deeply embedded in the fabric of society produce systemic disadvantages faced by one social group and ultimately shape health outcomes [59]. Previous evidence has shown structural racism steadily leads to health inequalities [60]. A recent study has shown an association of structural racism with racial disparities in stroke readmissions [61]. Further, social determinants impact health indirectly through intermediate structural factors such as quality of health care, its access, support service, housing, and transportation facilities [62]. It has been shown that the education level of the head of the household is negatively related to stroke mortality [63]. Female-headed households face the challenges of lower education, poverty, economic insecurity, and health problems [64]. Female-headed households are twice as likely to be poor (27.9 vs. 12.3%), more likely to be food-insecure (30.3 vs. 11.8%), and the median income of female-headed households was significantly lower than the general population according to the 2013 estimates from the U.S. Department of Commerce, U.S. Census Bureau [65,66]. These challenges faced by female-headed households can partially explain the association with stroke.
Strength and limitations: This study considered data of 3226 US counties/county-equivalents of the states and territories in the US and explored a comprehensive number of publicly available socio-determinants for stroke death and hospitalization. The difference in the age range considered for stroke deaths (all ages) and hospitalization (65+ years) was the main limitation of this study. The latter limited our ability to adequately compare findings between death and hospitalization rates. Missingness was also seen in all the variables. It was noted that the overseas US territories had higher rates of missingness while missingness patterns for the mainland counties were deemed to be randomly missing. It should be noted that rates extracted from the source were estimated rates and their precision depends on the number of counts and population size of each county. The dichotomization of the outcomes in this study could distort the association of the variables with the outcomes. The estimated effects when modeling the log standardized hospitalization/mortality ratio were not strong compared to modeling the dichotomized outcomes. The differences in the significance and strength of association of the variables with the outcomes in the two models can be explained partially by the difference in the threshold used in the two models. Various studies have shown social support, residential environment, neighborhood, culture, and language as determinants of stroke which were not evaluated in this study. There were some variations in the study design as well as outcomes and predictors considered by other studies with which our findings were compared. Different variables in this paper represented data recorded over different points/periods from 2015 to 2018. Furthermore, there may be spatial variations in the study variables within the counties. Finally, as with all ecological studies, our study may be prone to “ecological fallacy” which refers to the potential biases that occur when associations that are seen between variables at the aggregate level do not represent the associations between the variables at the individual level [1,67].

5. Conclusions

Several socioeconomic factors (e.g., income, education, female head of household, and park access) were found to be associated with stroke outcomes. Additional research is needed to investigate intermediate and potentially modifiable factors that can serve as targeted interventions.

Supplementary Materials

The following supporting information can be downloaded at: https://www.mdpi.com/article/10.3390/jcm11144101/s1, Table S1: Studies showing associations of socioeconomic variables with stroke incidence and outcomes in the United States [3,4,5,6,7,8,9,10]; Table S2: Name, definitions, and data sources of variables used in the study; Table S3: Modeling log standardized hospitalization ratio weighted by expected counts for each county; Table S4: Modeling log standardized mortality ratio weighted by expected counts for each county; Figure S1: Correlation matrix and heatmap of predictor variables used in the study; Figure S2: Map of US counties and county-equivalents showing (A) prevalence of heart disease among Medicare beneficiaries, (B) blood pressure medication non-adherence, (C) cost of care among Medicare beneficiaries with heart disease, (D) age-adjusted obesity, (E) presence of hospital with neurological services, (F) presence of hospital.

Author Contributions

Formal analysis, R.S.Y., D.C., V.A. (Venkatesh Avula) and J.L.; Investigation, V.A. (Vida Abedi) and R.Z.; Methodology, D.C., V.A. (Vida Abedi), J.L. and R.Z.; Supervision, V.A. (Vida Abedi) and R.Z.; Visualization, D.C. and V.A. (Venkatesh Avula); Writing – original draft, R.S.Y., and D.C.; Writing – review & editing, D.C., V.A. (Venkatesh Avula), S.S., M.R.A., V.A. (Vida Abedi), J.L. and R.Z. All authors have read and agreed to the published version of the manuscript.

Funding

This research received no external funding.

Institutional Review Board Statement

Ethical review and approval were waived for this study as the study used publicly available aggregate data and did not use patient-level data.

Informed Consent Statement

Not applicable.

Data Availability Statement

The data used in this study is available at the “Interactive atlas of heart disease and stroke” website of the Centers for Disease Control and Prevention (http://nccd.cdc.gov/DHDSPAtlas, accessed on 9 April 2021).

Conflicts of Interest

The authors declare no conflict of interest.

References

  1. Marmot, M.; Friel, S.; Bell, R.; Houweling, T.A.; Taylor, S.; Commission on Social Determinants of Health. Closing the gap in a generation: Health equity through action on the social determinants of health. Lancet 2008, 372, 1661–1669. [Google Scholar] [CrossRef]
  2. Havranek, E.P.; Mujahid, M.S.; Barr, D.A.; Blair, I.V.; Cohen, M.S.; Cruz-Flores, S.; Davey-Smith, G.; Dennison-Himmelfarb, C.R.; Lauer, M.S.; Lockwood, D.W.; et al. Social Determinants of Risk and Outcomes for Cardiovascular Disease: A Scientific Statement From the American Heart Association. Circulation 2015, 132, 873–898. [Google Scholar] [CrossRef] [PubMed] [Green Version]
  3. Avendano, M.; Kawachi, I.; Van Lenthe, F.; Boshuizen, H.C.; Mackenbach, J.P.; Van den Bos, G.A.; Fay, M.E.; Berkman, L.F. Socioeconomic status and stroke incidence in the US elderly: The role of risk factors in the EPESE study. Stroke 2006, 37, 1368–1373. [Google Scholar] [CrossRef] [PubMed] [Green Version]
  4. Avendano, M.; Glymour, M.M. Stroke disparities in older Americans: Is wealth a more powerful indicator of risk than income and education? Stroke 2008, 39, 1533–1540. [Google Scholar] [CrossRef] [Green Version]
  5. Bettger, J.P.; Zhao, X.; Bushnell, C.; Zimmer, L.; Pan, W.; Williams, L.S.; Peterson, E.D. The association between socioeconomic status and disability after stroke: Findings from the Adherence eValuation After Ischemic stroke Longitudinal (AVAIL) registry. BMC Public Health 2014, 14, 281. [Google Scholar] [CrossRef] [Green Version]
  6. Hanchate, A.D.; Schwamm, L.H.; Huang, W.; Hylek, E.M. Comparison of ischemic stroke outcomes and patient and hospital characteristics by race/ethnicity and socioeconomic status. Stroke 2013, 44, 469–476. [Google Scholar] [CrossRef] [Green Version]
  7. Howard, V.J.; McClure, L.A.; Kleindorfer, D.O.; Cunningham, S.A.; Thrift, A.G.; Diez Roux, A.V.; Howard, G. Neighborhood socioeconomic index and stroke incidence in a national cohort of blacks and whites. Neurology 2016, 87, 2340–2347. [Google Scholar] [CrossRef] [Green Version]
  8. Pedigo, A.; Aldrich, T.; Odoi, A. Neighborhood disparities in stroke and myocardial infarction mortality: A GIS and spatial scan statistics approach. BMC Public Health 2011, 11, 644. [Google Scholar] [CrossRef] [Green Version]
  9. Brown, A.F.; Liang, L.J.; Vassar, S.D.; Stein-Merkin, S.; Longstreth, W.T., Jr.; Ovbiagele, B.; Yan, T.; Escarce, J.J. Neighborhood disadvantage and ischemic stroke: The Cardiovascular Health Study (CHS). Stroke 2011, 42, 3363–3368. [Google Scholar] [CrossRef] [Green Version]
  10. Schieb, L.; Mobley, L.; George, M.; Casper, M. Tracking stroke hospitalization clusters over time and associations with county-level socioeconomic and healthcare characteristics. Stroke 2013, 44, 146–152. [Google Scholar] [CrossRef] [Green Version]
  11. Kulick, E.R.; Wellenius, G.A.; Boehme, A.K.; Sacco, R.L.; Elkind, M.S. Residential Proximity to Major Roadways and Risk of Incident Ischemic Stroke in NOMAS (The Northern Manhattan Study). Stroke 2018, 49, 835–841. [Google Scholar] [CrossRef]
  12. Sergeev, A.V. Racial and rural-urban disparities in stroke mortality outside the Stroke Belt. Ethn. Dis. 2011, 21, 307–313. [Google Scholar] [CrossRef]
  13. Clark, C.J.; Guo, H.; Lunos, S.; Aggarwal, N.T.; Beck, T.; Evans, D.A.; Mendes de Leon, C.; Everson-Rose, S.A. Neighborhood cohesion is associated with reduced risk of stroke mortality. Stroke 2011, 42, 1212–1217. [Google Scholar] [CrossRef]
  14. Center for Disease Control and Prevention. Interactive Atlas of Heart Disease and Stroke. Available online: http://nccd.cdc.gov/DHDSPAtlas (accessed on 9 April 2021).
  15. Yang, J.; Zaitlen, N.A.; Goddard, M.E.; Visscher, P.M.; Price, A.L. Advantages and pitfalls in the application of mixed-model association methods. Nat. Genet. 2014, 46, 100–106. [Google Scholar] [CrossRef] [Green Version]
  16. R Core Team. R: A Language and Environment for Statistical Computing; R Foundation for Statistical Computing: Vienna, Austria, 2021; Available online: https://www.R-project.org/ (accessed on 7 July 2021).
  17. Li, C.; Hedblad, B.; Rosvall, M.; Buchwald, F.; Khan, F.A.; Engstrom, G. Stroke incidence, recurrence, and case-fatality in relation to socioeconomic position: A population-based study of middle-aged Swedish men and women. Stroke 2008, 39, 2191–2196. [Google Scholar] [CrossRef]
  18. Gezmu, T.; Gizzi, M.; Kirmani, J.; Schneider, D.; Moussavi, M. Disparities in acute stroke severity, outcomes, and care relative to health insurance status. J. Stroke Cerebrovasc. Dis. 2014, 23, e93–e98. [Google Scholar] [CrossRef]
  19. James, M.L.; Grau-Sepulveda, M.V.; Olson, D.M.; Smith, E.E.; Hernandez, A.F.; Peterson, E.D.; Schwamm, L.H.; Bhatt, D.L.; Fonarow, G.C. Insurance status and outcome after intracerebral hemorrhage: Findings from Get With The Guidelines-stroke. J. Stroke Cerebrovasc. Dis. 2014, 23, 283–292. [Google Scholar] [CrossRef]
  20. Shen, J.; Washington, E. Disparities in outcomes among patients with stroke associated with insurance status. Stroke 2007, 38, 1010–1016. [Google Scholar] [CrossRef]
  21. Bravata, D.M.; Wells, C.K.; Gulanski, B.; Kernan, W.N.; Brass, L.M.; Long, J.; Concato, J. Racial disparities in stroke risk factors: The impact of socioeconomic status. Stroke 2005, 36, 1507–1511. [Google Scholar] [CrossRef] [Green Version]
  22. Vivanco-Hidalgo, R.M.; Ribera, A.; Abilleira, S. Association of Socioeconomic Status With Ischemic Stroke Survival. Stroke 2019, 50, 3400–3407. [Google Scholar] [CrossRef]
  23. Morovatdar, N.; Thrift, A.G.; Stranges, S.; Kapral, M.; Behrouz, R.; Amiri, A.; Heshmati, A.; Ghahremani, A.; Farzadfard, M.T.; Mokhber, N.; et al. Socioeconomic Status and Long-Term Stroke Mortality, Recurrence and Disability in Iran: The Mashhad Stroke Incidence Study. Neuroepidemiology 2019, 53, 27–31. [Google Scholar] [CrossRef]
  24. Saposnik, G.; Jeerakathil, T.; Selchen, D.; Baibergenova, A.; Hachinski, V.; Kapral, M.K.; Stroke Outcome Research Canada Working Group. Socioeconomic status, hospital volume, and stroke fatality in Canada. Stroke 2008, 39, 3360–3366. [Google Scholar] [CrossRef]
  25. Avan, A.; Digaleh, H.; Di Napoli, M.; Stranges, S.; Behrouz, R.; Shojaeianbabaei, G.; Amiri, A.; Tabrizi, R.; Mokhber, N.; Spence, J.D.; et al. Socioeconomic status and stroke incidence, prevalence, mortality, and worldwide burden: An ecological analysis from the Global Burden of Disease Study 2017. BMC Med. 2019, 17, 191. [Google Scholar] [CrossRef]
  26. Marshall, I.J.; Wang, Y.; Crichton, S.; McKevitt, C.; Rudd, A.G.; Wolfe, C.D. The effects of socioeconomic status on stroke risk and outcomes. Lancet Neurol. 2015, 14, 1206–1218. [Google Scholar] [CrossRef] [Green Version]
  27. Chen, R.; Crichton, S.; McKevitt, C.; Rudd, A.G.; Sheldenkar, A.; Wolfe, C.D. Association between socioeconomic deprivation and functional impairment after stroke: The South London Stroke Register. Stroke 2015, 46, 800–805. [Google Scholar] [CrossRef] [Green Version]
  28. Addo, J.; Ayerbe, L.; Mohan, K.M.; Crichton, S.; Sheldenkar, A.; Chen, R.; Wolfe, C.D.; McKevitt, C. Socioeconomic status and stroke: An updated review. Stroke 2012, 43, 1186–1191. [Google Scholar] [CrossRef]
  29. Sturm, J.W.; Donnan, G.A.; Dewey, H.M.; Macdonell, R.A.; Gilligan, A.K.; Thrift, A.G. Determinants of handicap after stroke: The North East Melbourne Stroke Incidence Study (NEMESIS). Stroke 2004, 35, 715–720. [Google Scholar] [CrossRef]
  30. Grube, M.M.; Koennecke, H.C.; Walter, G.; Thummler, J.; Meisel, A.; Wellwood, I.; Heuschmann, P.U.; Berlin Stroke Register. Association between socioeconomic status and functional impairment 3 months after ischemic stroke: The Berlin Stroke Register. Stroke 2012, 43, 3325–3330. [Google Scholar] [CrossRef] [Green Version]
  31. Blank, N.; Diderichsen, F. Social inequalities in the experience of illness in Sweden: A “double suffering”. Scand. J. Soc. Med. 1996, 24, 81–89. [Google Scholar] [CrossRef]
  32. Claxton, J.S.; Lutsey, P.L.; MacLehose, R.F.; Chen, L.Y.; Lewis, T.T.; Alonso, A. Geographic Disparities in the Incidence of Stroke among Patients with Atrial Fibrillation in the United States. J. Stroke Cerebrovasc. Dis. 2019, 28, 890–899. [Google Scholar] [CrossRef]
  33. Sallis, J.F.; Cervero, R.B.; Ascher, W.; Henderson, K.A.; Kraft, M.K.; Kerr, J. An ecological approach to creating active living communities. Annu. Rev. Public Health 2006, 27, 297–322. [Google Scholar] [CrossRef] [PubMed] [Green Version]
  34. Wagner, P.; Duan, Y.P.; Zhang, R.; Wulff, H.; Brehm, W. Association of psychosocial and perceived environmental factors with park-based physical activity among elderly in two cities in China and Germany. BMC Public Health 2020, 20, 55. [Google Scholar] [CrossRef] [PubMed] [Green Version]
  35. Xian, Y.; Holloway, R.G.; Chan, P.S.; Noyes, K.; Shah, M.N.; Ting, H.H.; Chappel, A.R.; Peterson, E.D.; Friedman, B. Association between stroke center hospitalization for acute ischemic stroke and mortality. JAMA 2011, 305, 373–380. [Google Scholar] [CrossRef] [PubMed]
  36. Meretoja, A.; Roine, R.O.; Kaste, M.; Linna, M.; Roine, S.; Juntunen, M.; Erila, T.; Hillbom, M.; Marttila, R.; Rissanen, A.; et al. Effectiveness of primary and comprehensive stroke centers: PERFECT stroke: A nationwide observational study from Finland. Stroke 2010, 41, 1102–1107. [Google Scholar] [CrossRef] [PubMed]
  37. Chan, D.K.; Cordato, D.; O’Rourke, F.; Chan, D.L.; Pollack, M.; Middleton, S.; Levi, C. Comprehensive stroke units: A review of comparative evidence and experience. Int. J. Stroke 2013, 8, 260–264. [Google Scholar] [CrossRef] [PubMed]
  38. Zhu, H.F.; Newcommon, N.N.; Cooper, M.E.; Green, T.L.; Seal, B.; Klein, G.; Weir, N.U.; Coutts, S.B.; Watson, T.; Barber, P.A.; et al. Impact of a stroke unit on length of hospital stay and in-hospital case fatality. Stroke 2009, 40, 18–23. [Google Scholar] [CrossRef] [Green Version]
  39. Foley, N.; Salter, K.; Teasell, R. Specialized stroke services: A meta-analysis comparing three models of care. Cerebrovasc. Dis. 2007, 23, 194–202. [Google Scholar] [CrossRef]
  40. Stroke Unit Trialists Collaboration. Organised inpatient (stroke unit) care for stroke. Cochrane Database Syst. Rev. 2007, CD000197. [Google Scholar] [CrossRef]
  41. Lackland, D.T.; Roccella, E.J.; Deutsch, A.F.; Fornage, M.; George, M.G.; Howard, G.; Kissela, B.M.; Kittner, S.J.; Lichtman, J.H.; Lisabeth, L.D.; et al. Factors influencing the decline in stroke mortality: A statement from the American Heart Association/American Stroke Association. Stroke 2014, 45, 315–353. [Google Scholar] [CrossRef] [Green Version]
  42. El-Saed, A.; Kuller, L.H.; Newman, A.B.; Lopez, O.; Costantino, J.; McTigue, K.; Cushman, M.; Kronmal, R. Geographic variations in stroke incidence and mortality among older populations in four US communities. Stroke 2006, 37, 1975–1979. [Google Scholar] [CrossRef] [Green Version]
  43. Liao, Y.; Greenlund, K.J.; Croft, J.B.; Keenan, N.L.; Giles, W.H. Factors explaining excess stroke prevalence in the US Stroke Belt. Stroke 2009, 40, 3336–3341. [Google Scholar] [CrossRef] [Green Version]
  44. Lanska, D.J. Geographic distribution of stroke mortality in the United States: 1939–1941 to 1979–1981. Neurology 1993, 43, 1839–1851. [Google Scholar] [CrossRef]
  45. Lanska, D.J.; Kuller, L.H. The geography of stroke mortality in the United States and the concept of a stroke belt. Stroke 1995, 26, 1145–1149. [Google Scholar] [CrossRef]
  46. Howard, V.J.; Kleindorfer, D.O.; Judd, S.E.; McClure, L.A.; Safford, M.M.; Rhodes, J.D.; Cushman, M.; Moy, C.S.; Soliman, E.Z.; Kissela, B.M.; et al. Disparities in stroke incidence contributing to disparities in stroke mortality. Ann. Neurol. 2011, 69, 619–627. [Google Scholar] [CrossRef]
  47. Nguyen-Huynh, M.N.; Johnston, S.C. Regional variation in hospitalization for stroke among Asians/Pacific Islanders in the United States: A nationwide retrospective cohort study. BMC Neurol. 2005, 5, 21. [Google Scholar] [CrossRef] [Green Version]
  48. Lackland, D.T.; Bachman, D.L.; Carter, T.D.; Barker, D.L.; Timms, S.; Kohli, H. The geographic variation in stroke incidence in two areas of the southeastern stroke belt: The Anderson and Pee Dee Stroke Study. Stroke 1998, 29, 2061–2068. [Google Scholar] [CrossRef]
  49. Labarthe, D.R.; Howard, G.; Safford, M.M.; Howard, V.J.; Judd, S.E.; Cushman, M.; Kissela, B.M.; Reasons for Geographic and Racial Differences in Stroke Investigators. Incidence and Case Fatality at the County Level as Contributors to Geographic Disparities in Stroke Mortality. Neuroepidemiology 2016, 47, 96–102. [Google Scholar] [CrossRef]
  50. Morovatdar, N.; Avan, A.; Azarpazhooh, M.R.; Di Napoli, M.; Stranges, S.; Kapral, M.K.; Rezayat, A.A.; Shariatzadeh, A.; Abootalebi, S.; Mokhber, N.; et al. Secular trends of ischaemic heart disease, stroke, and dementia in high-income countries from 1990 to 2017: The Global Burden of Disease Study 2017. Neurol. Sci. 2021, 43, 255–264. [Google Scholar] [CrossRef]
  51. Blais, C.; Rochette, L. Trends in prevalence, incidence and mortality of diagnosed and silent coronary heart disease in Quebec. Health Promot. Chronic Dis. Prev. Can. Res. Policy Pract. 2015, 35, 184–193. [Google Scholar] [CrossRef]
  52. Sposato, L.A.; Kapral, M.K.; Fang, J.; Gill, S.S.; Hackam, D.G.; Cipriano, L.E.; Hachinski, V. Declining Incidence of Stroke and Dementia: Coincidence or Prevention Opportunity? JAMA Neurol. 2015, 72, 1529–1531. [Google Scholar] [CrossRef] [Green Version]
  53. Tu, J.V.; Nardi, L.; Fang, J.; Liu, J.; Khalid, L.; Johansen, H. National trends in rates of death and hospital admissions related to acute myocardial infarction, heart failure and stroke, 1994–2004. CMAJ Can. Med. Assoc. J. 2009, 180, E118–E125. [Google Scholar] [CrossRef] [Green Version]
  54. Kamal, N.; Lindsay, M.P.; Côté, R.; Fang, J.; Kapral, M.K.; Hill, M.D. Ten-year trends in stroke admissions and outcomes in Canada. Can. J. Neurol. Sci. 2015, 42, 168–175. [Google Scholar] [CrossRef] [Green Version]
  55. Tu, J.V.; Chu, A.; Maclagan, L.; Austin, P.C.; Johnston, S.; Ko, D.T.; Cheung, I.; Atzema, C.L.; Booth, G.L.; Bhatia, R.S.; et al. Regional variations in ambulatory care and incidence of cardiovascular events. CMAJ Can. Med. Assoc. J. 2017, 189, E494–E501. [Google Scholar] [CrossRef] [Green Version]
  56. Douthit, N.; Kiv, S.; Dwolatzky, T.; Biswas, S. Exposing some important barriers to health care access in the rural USA. Public Health 2015, 129, 611–620. [Google Scholar] [CrossRef]
  57. Trivedi, T.; Liu, J.; Probst, J.; Merchant, A.; Jhones, S.; Martin, A.B. Obesity and obesity-related behaviors among rural and urban adults in the USA. Rural Remote Health 2015, 15, 3267. [Google Scholar] [CrossRef]
  58. O’Connor, A.; Wellenius, G. Rural-urban disparities in the prevalence of diabetes and coronary heart disease. Public Health 2012, 126, 813–820. [Google Scholar] [CrossRef]
  59. Baciu, A.; Negussie, Y.; Geller, A. The Root Causes of Health Inequity. In Communities in Action: Pathways to Health Equity; National Academies Press: Washington, DC, USA, 2017. Available online: https://www.ncbi.nlm.nih.gov/books/NBK425845/ (accessed on 11 July 2021).
  60. Krieger, N. Structural Racism, Health Inequities, and the Two-Edged Sword of Data: Structural Problems Require Structural Solutions. Front. Public Health 2021, 9, 655447. [Google Scholar] [CrossRef]
  61. Carthon, J.M.B.; Brom, H.; McHugh, M.; Daus, M.; French, R.; Sloane, D.M.; Berg, R.; Merchant, R.; Aiken, L.H. Racial Disparities in Stroke Readmissions Reduced in Hospitals with Better Nurse Staffing. Nurs. Res. 2021, 71, 33–42. [Google Scholar] [CrossRef]
  62. Skolarus, L.E.; Sharrief, A.; Gardener, H.; Jenkins, C.; Boden-Albala, B. Considerations in Addressing Social Determinants of Health to Reduce Racial/Ethnic Disparities in Stroke Outcomes in the United States. Stroke 2020, 51, 3433–3439. [Google Scholar] [CrossRef]
  63. Khaw, K.T.; Barrett-Connor, E.; Suarez, L.; Criqui, M.H. Predictors of stroke-associated mortality in the elderly. Stroke 1984, 15, 244–248. [Google Scholar] [CrossRef] [Green Version]
  64. Lafta, R.K.; Hayawi, A.H.; Khudhairi, J.M. Medical and social problems among women headed families in Baghdad. Qatar Med. J. 2013, 2012, 51–58. [Google Scholar] [CrossRef] [PubMed] [Green Version]
  65. Hunger and Poverty in Female-Headed Households. Available online: https://www.bread.org/sites/default/files/downloads/hunger-poverty-female-headed-households-may-2019.pdf (accessed on 10 May 2022).
  66. 2013–2017 ACS 5-year Estimates. Available online: https://www.census.gov/programs-surveys/acs/technical-documentation/table-and-geography-changes/2017/5-year.html (accessed on 10 May 2022).
  67. Tu, J.V.; Ko, D.T. Ecological Studies and Cardiovascular Outcomes Research. Circulation 2008, 118, 2588–2593. [Google Scholar] [CrossRef] [PubMed] [Green Version]
Figure 1. Correlation of continuous variables with outcome variables. (A) Correlation of continuous variables with stroke hospitalization rate (SHR) per 1000 Medicare beneficiaries, 65+, all races/ethnicities, both genders; (B) correlation of continuous variables with stroke death rate (SDR) per 100,000, all ages, all races/ethnicities, both genders.
Jcm 11 04101 g001
Figure 2. Map of US counties and county-equivalents showing (A) stroke hospitalization rate (SHR) among Medicare beneficiaries and stroke death rate (SDR), (B) median household income, (C) no college degree, (D) female head of household, (E) park access.
Jcm 11 04101 g002
Table 1. Comparison between counties/county-equivalents of the states and territories in the US with lower and higher stroke hospitalization rate (SHR) and stroke death rate (SDR).
Data ElementsUnitMissing %OverallLow
Hospitalization Rate (≤11.7)
High
Hospitalization Rate (>11.7)
p-ValueLow Death Rate (≤ 39.0)High Death Rate (>39.0)p-Value
Median (IQR) Median (IQR)Median (IQR) Median (IQR)Median (IQR)
Heart disease among Medicare beneficiaries%0.135.6 (31.9, 39.5)32.7 (29.7, 36.0)38.5 (35.5, 41.6)<0.001---
Blood pressure medication non-adherence (Medicare Part D beneficiaries)%1.823.1 (19.8, 26.2)21.3 (18.2, 24.5)24.6 (21.5, 27.2)<0.001---
Cost of care (per capita for Medicare beneficiaries diagnosed with heart disease)USD0.33972.0 (3222.5, 5091.2)4510.0 (3402.5, 6013.8)3665.0 (3151.8, 4366.8)<0.001---
Poverty%2.614.1 (10.8, 18.3)---12.2 (9.6, 15.1)16.5 (13.1, 20.8)<0.001
Unemployment%0.23.9 (3.1, 4.9)---3.6 (2.9, 4.7)4.1 (3.5, 5.1)<0.001
Household incomeUSD2.651,000.0 (44,000.0, 59,000.0)---55,000.0 (48,000.0, 63,000.0)46,000.0 (41,000.0, 53,000.0)<0.001
Income inequality
(Gini index)
%0.20.4 (0.4, 0.5)0.4 (0.4, 0.5)0.4 (0.4, 0.5)<0.0010.4 (0.4, 0.5)0.5 (0.4, 0.5)<0.001
Food assistance%2.612.9 (8.6, 17.9)9.8 (6.6, 14.1)15.7 (12.2, 20.3)<0.00110.2 (6.9, 14.6)15.5 (11.6, 20.4)<0.001
Female head of household%0.210.6 (8.4, 13.4)9.1 (7.1, 11.5)12.0 (10.0, 14.7)<0.0019.4 (7.5, 11.7)12.0 (9.6, 14.9)<0.001
No college degree%0.280.7 (74.5, 84.9)78.6 (71.6, 82.5)83.3 (77.7, 86.6)<0.00178.3 (70.7, 82.6)83.1 (78.2, 86.5)<0.001
Park access%2.714.0 (4.0, 30.0)22.0 (8.0, 38.0)9.0 (2.0, 21.0)<0.00122.0 (8.0, 38.0)9.0 (2.0, 21.0)<0.001
Age-adjusted physical inactivity%2.625.9 (22.5, 29.6)24.0 (20.6, 27.0)28.1 (24.8, 31.9)<0.00124.0 (20.7, 27.0)28.1 (24.8, 31.8)<0.001
Age-adjusted obesity%2.633.0 (28.9, 36.6)31.0 (27.0, 34.8)34.6 (31.3, 37.9)<0.00131.5 (27.5, 35.0)34.4 (30.7, 38.0)<0.001
Age-adjusted diabetes%0.210.0 (7.8, 12.7)8.6 (6.9, 10.8)11.5 (9.4, 13.9)<0.0018.8 (7.1, 11.0)11.3 (9.0, 13.9)<0.001
n (%)n (%)n (%) n (%)n (%)
Hospitals with Neurological services%0.1927 (28.8)441 (27.0)486 (31.1)0.012521 (32.0)406 (25.6)<0.001
Hospital present%0.12482 (77.0)1296 (79.2)1179 (75.3)0.0101278 (78.5)1202 (75.8)0.068
Table 2. Univariate and multivariate binomial generalized linear mixed model analyses for stroke hospitalization rate (SHR) per 1000 Medicare beneficiaries, 65+, all races/ethnicities, and both genders.
Unadjusted ORAdjusted OR
VariableOR with 95% CIp-ValueOR with 95% CIp-Value
Prevalence of heart disease among Medicare patients2.55 (2.18–2.99)<0.0012.03 (1.66–2.49)<0.001
Blood pressure medication nonadherence2.88 (2.34–3.54)<0.0012.02 (1.5–2.73)<0.001
Cost of care among Medicare patients with heart disease0.6 (0.52–0.68)<0.0010.5 (0.42–0.6)<0.001
Hospital with neurological services1.22 (0.99–1.5)0.0621.9 (1.41–2.57)<0.001
Age-adjusted obesity1.83 (1.64–2.04)<0.0011.24 (1.06–1.44)0.006
Female head of household2.01 (1.76–2.29)<0.0011.32 (1.04–1.67)0.021
Hospital present0.7 (0.56–0.89)0.0030.69 (0.5–0.95)0.025
No college degree1.39 (1.25–1.54)<0.0011.13 (0.94–1.36)0.189
Park access0.85 (0.76–0.95)0.0040.91 (0.78–1.06)0.224
Age-adjusted physical inactivity1.86 (1.64–2.11)<0.0011.08 (0.9–1.3)0.426
Food assistance2.02 (1.78–2.3)<0.0011.09 (0.87–1.37)0.453
Age-adjusted diabetes1.47 (1.31–1.64)<0.0011 (0.86–1.15)0.977
Income inequality (Gini index)1.04 (0.94–1.16)0.47
Table 3. Univariate and multivariate binomial generalized linear mixed model analyses for stroke death rate (SDR) per 100,000, all ages, all races/ethnicities, and both genders.
Unadjusted ORAdjusted OR
VariableOR with 95% CIp-ValueOR with 95% CIp-Value
Median household income0.62 (0.56–0.69)<0.0010.69 (0.57–0.83)<0.001
Park access0.81 (0.73–0.9)<0.0010.85 (0.74–0.98)0.023
No college degree1.44 (1.3–1.59)<0.0011.24 (1.03–1.5)0.024
Poverty1.83 (1.63–2.04)<0.001--
Age-adjusted diabetes1.25 (1.13–1.39)<0.0010.9 (0.79–1.03)0.121
Food assistance1.94 (1.71–2.19)<0.001--
Age-adjusted physical inactivity1.71 (1.52–1.92)<0.0011.13 (0.95–1.33)0.174
Unemployment1.63 (1.44–1.84)<0.0011.05 (0.89–1.25)0.554
Female head of household1.49 (1.32–1.68)<0.0010.98 (0.8–1.19)0.821
Income inequality (Gini index)1.17 (1.05–1.29)0.0031.04 (0.9–1.2)0.620
Age-adjusted obesity1.46 (1.32–1.62)<0.0011.03 (0.89–1.19)0.713
Hospital with neurological services0.71 (0.58–0.86)0.0011.00 (0.76–1.31)0.985
Hospital present0.92 (0.74–1.15)0.471
Publisher’s Note: MDPI stays neutral with regard to jurisdictional claims in published maps and institutional affiliations.

