Potential Years of Life Lost Due to COVID-19 in the United States, Italy, and Germany: An Old Formula with Newer Ideas

 ,
, 
Abstract
:1. Introduction
2. Materials and Methods
2.1. Data Acquisition and Validation
2.2. Selection of Population
2.3. Calculation of Age-Specific Mortality and PYLL
2.4. PYLL Rates and Standardization
3. Results
4. Discussion
Methodological Issues in Using the Upper Age Limit
5. Conclusions
Author Contributions
Funding
Acknowledgments
Conflicts of Interest
References
- Worldometer. COVID-19 Coronavirus Pandemic. Available online: https://www.worldometers.info/coronavirus/ (accessed on 30 May 2020).
- The Novel Coronavirus Pneumonia Emergency Response Epidemiology Team. The Epidemiological Characteristics of an Outbreak of 2019 Novel Coronavirus Diseases (COVID-19)—China, 2020. China CDC Wkly. 2020, 2, 113–122. [Google Scholar]
- Peer, N.C.; Shrestha, N.; Rahman, M.S.; Zaki, R.; Tan, Z.; Bibi, S.; Baghbanzadeh, M.; Aghamohammadi, N.; Zhang, W.; Haque, U. The SARS, MERS and novel coronavirus (COVID-19) epidemics, the newest and biggest global health threats: What lessons have we learned? Int. J. Epidemiol. 2020, 1–10. [Google Scholar] [CrossRef] [PubMed] [Green Version]
- Onder, G.; Rezza, G.; Brusaferro, S. Case-fatality rate and characteristics of patients dying in relation to COVID-19 in Italy. JAMA 2020, 323, 1775–1776. [Google Scholar] [CrossRef] [PubMed]
- Yang, X.; Yu, Y.; Xu, J.; Shu, H.; Xia, J.; Liu, H.; Wu, Y.; Zhang, L.; Yu, Z.; Fang, M.; et al. Clinical course and outcomes of critically ill patients with SARS-CoV-2 pneumonia in Wuhan, China: A single-centered, retrospective, observational study. Lancet Respir. Med. 2020, 8, 475–481. [Google Scholar] [CrossRef] [Green Version]
- World Health Organization. Metrics: Disability-Adjusted Life Year (DALY). Available online: https://www.who.int/healthinfo/global_burden_disease/metrics_daly/en/ (accessed on 30 May 2020).
- Grandjean, P.; Bellanger, M. Calculation of the disease burden associated with environmental chemical exposures: Application of toxicological information in health economic estimation. Environ. Health 2017, 16, 123. [Google Scholar] [CrossRef] [PubMed] [Green Version]
- Egunsola, O.; Raubenheimer, J.; Buckley, N. Variability in the burden of disease estimates with or without age weighting and discounting: A methodological study. BMJ Open 2019, 9, e027825. [Google Scholar] [CrossRef] [PubMed] [Green Version]
- Vienonen, M.A.; Jousilahti, P.J.; Mackiewicz, K.; Oganov, R.G.; Pisaryk, V.M.; Denissov, G.R.; Nurm, U.; Pudule, I.; Gurevicius, R.J.; Zabocki, B.M.; et al. Preventable premature deaths (PYLL) in northern dimension partnership countries 2003-13. Eur. J. Public Health 2019, 29, 626–630. [Google Scholar] [CrossRef] [PubMed]
- Canadian Institute for Health Information. Potential Years of Life Lost: International Comparisons. Examining Canada’s Health System Performance. Available online: https://www.cihi.ca/en/health-system-performance/performance-reporting/international/pyll (accessed on 2 May 2020).
- Maximova, K.; Rozen, S.; Springett, J.; Stachenko, S. The use of potential years of life lost for monitoring premature mortality from chronic diseases: Canadian perspectives. Can. J. Public Health 2016, 107, e202–e204. [Google Scholar] [CrossRef] [PubMed] [Green Version]
- Romeder, J.M.; McWhinnie, J.R. Potential years of life lost between ages 1 and 70: An indicator of premature mortality for health planning. Int. J. Epidemiol. 1977, 6, 143–151. [Google Scholar] [CrossRef] [PubMed]
- Wu, Z.; McGoogan, J.M. Characteristics of and important lessons from the coronavirus disease 2019 (COVID-19) outbreak in China. Summary of a report of 72,314 cases from the Chinese Center for Disease Control and Prevention. JAMA 2020, 323, 1239–1242. [Google Scholar] [CrossRef] [PubMed]
- Remuzzi, A.; Remuzzi, G. COVID-19 and Italy: What next? Lancet 2020, 395, 1225–1228. [Google Scholar] [CrossRef]
- Porcheddu, R.; Serra, C.; Kelvin, D.; Kelvin, N.; Rubino, S. Similarity in case fatality rates (CFR) of COVID-19/SARS-COV-2 in Italy and China. J. Infect. DEV Ctries 2020, 14, 125–128. [Google Scholar] [CrossRef] [PubMed]
- Organization for Economic Co-Operation and Development (OECD). OECD Health Statistics 2019: Definitions, Sources, and Methods. Potential Years of Life LOST by ICD categories. Available online: http://www.oecd.org/health/health-data.htm (accessed on 12 April 2020).
- Association of Public Health Epidemiologists in Ontario. Calculating Potential Years of Life Lost (PYLL). Available online: http://core.apheo.ca/index.php?pid=190 (accessed on 10 April 2020).
- World Bank. Life Expectancy at Birth. Available online: https://data.worldbank.org/indicator/SP.DYN.LE00.IN?view=chart (accessed on 2 May 2020).
- World Health Organization. Rolling Updates on Coronavirus Disease (COVID-19). Available online: https://www.who.int/emergencies/diseases/novel-coronavirus-2019/events-as-they-happen (accessed on 30 May 2020).
- Johns Hopkins University. Coronavirus Resource Center. Available online: https://coronavirus.jhu.edu/map.html (accessed on 30 May 2020).
- Centers for Disease Control and Prevention. National Vital Statistics System. Provisional Death Counts for Coronavirus Disease (COVID-19). Available online: https://www.cdc.gov/nchs/nvss/vsrr/covid_weekly/index.htm#AgeAndSex (accessed on 30 May 2020).
- Statista Research Department. Available online: https://www.statista.com/statistics/1105061/coronavirus-deaths-by-region-in-italy/ (accessed on 30 May 2020).
- New York State Department of Health. Fatalities by Age Group. Available online: https://covid19tracker.health.ny.gov/views/NYS-COVID19-Tracker/NYSDOHCOVID-19Tracker-Fatalities?%3Aembed=yes&%3Atoolbar=no&%3Atabs=n (accessed on 30 May 2020).
- United Nations Population Division Estimates. Countries in the World by Population. 2020. Available online: https://www.worldometers.info/world-population/population-by-country/ (accessed on 2 May 2020).
- World Population Review. New York Population 2020 (Demographics, Maps, Graphs). Available online: https://worldpopulationreview.com/states/new-york-population/ (accessed on 14 May 2020).
- Kirigia, J.M.; Muthuri, R.N.D.K. The fiscal value of human lives lost from coronavirus disease (COVID-19) in China. BMC Res. Notes 2020, 13, 198. [Google Scholar] [CrossRef] [PubMed] [Green Version]


| Country | Cases | Deaths | CFR (%) |
|---|---|---|---|
| United States | 1,811,102 | 105,337 | 5.82 |
| Spain | 286,308 | 27,125 | 9.47 |
| Italy | 232,664 | 33,340 | 14.33 |
| France | 188,625 | 28,771 | 15.25 |
| Germany | 183,149 | 8598 | 4.69 |
| World | 6,111,187 | 369,376 | 6.04 |
| Age Group (year) | Mid-Point of Class Interval (i) | COVID-19 Deaths (d) * | PYLL at Age Limit | ||
|---|---|---|---|---|---|
| 70 Years | 75 Years | 80 Years | |||
| 0–9 | 4.5 | 4 (0.01) | 260 | 280 | 300 |
| 10–19 | 14.5 | 0 | 0 | 0 | 0 |
| 20–29 | 24.5 | 12 (0.04) | 540 | 600 | 660 |
| 30–39 | 34.5 | 62 (0.20) | 2170 | 2480 | 2790 |
| 40–49 | 44.5 | 272 (0.86) | 6800 | 8160 | 9520 |
| 50–59 | 54.5 | 1103 (3.50) | 16,545 | 22,060 | 27,575 |
| 60–69 | 64.5 | 3249 (10.30) | 16,245 | 32,490 | 48,735 |
| 70–79 | 74.5 | 8536 (27.06) | 0 | 0 | 42,680 |
| 80–89 | 84.5 | 12,926 (40.98) | 0 | 0 | 0 |
| 90+ | 5382 (17.06) | 0 | 0 | 0 | |
| Total | 31,546 (100.0) | 42,560 | 66,070 | 132,260 | |
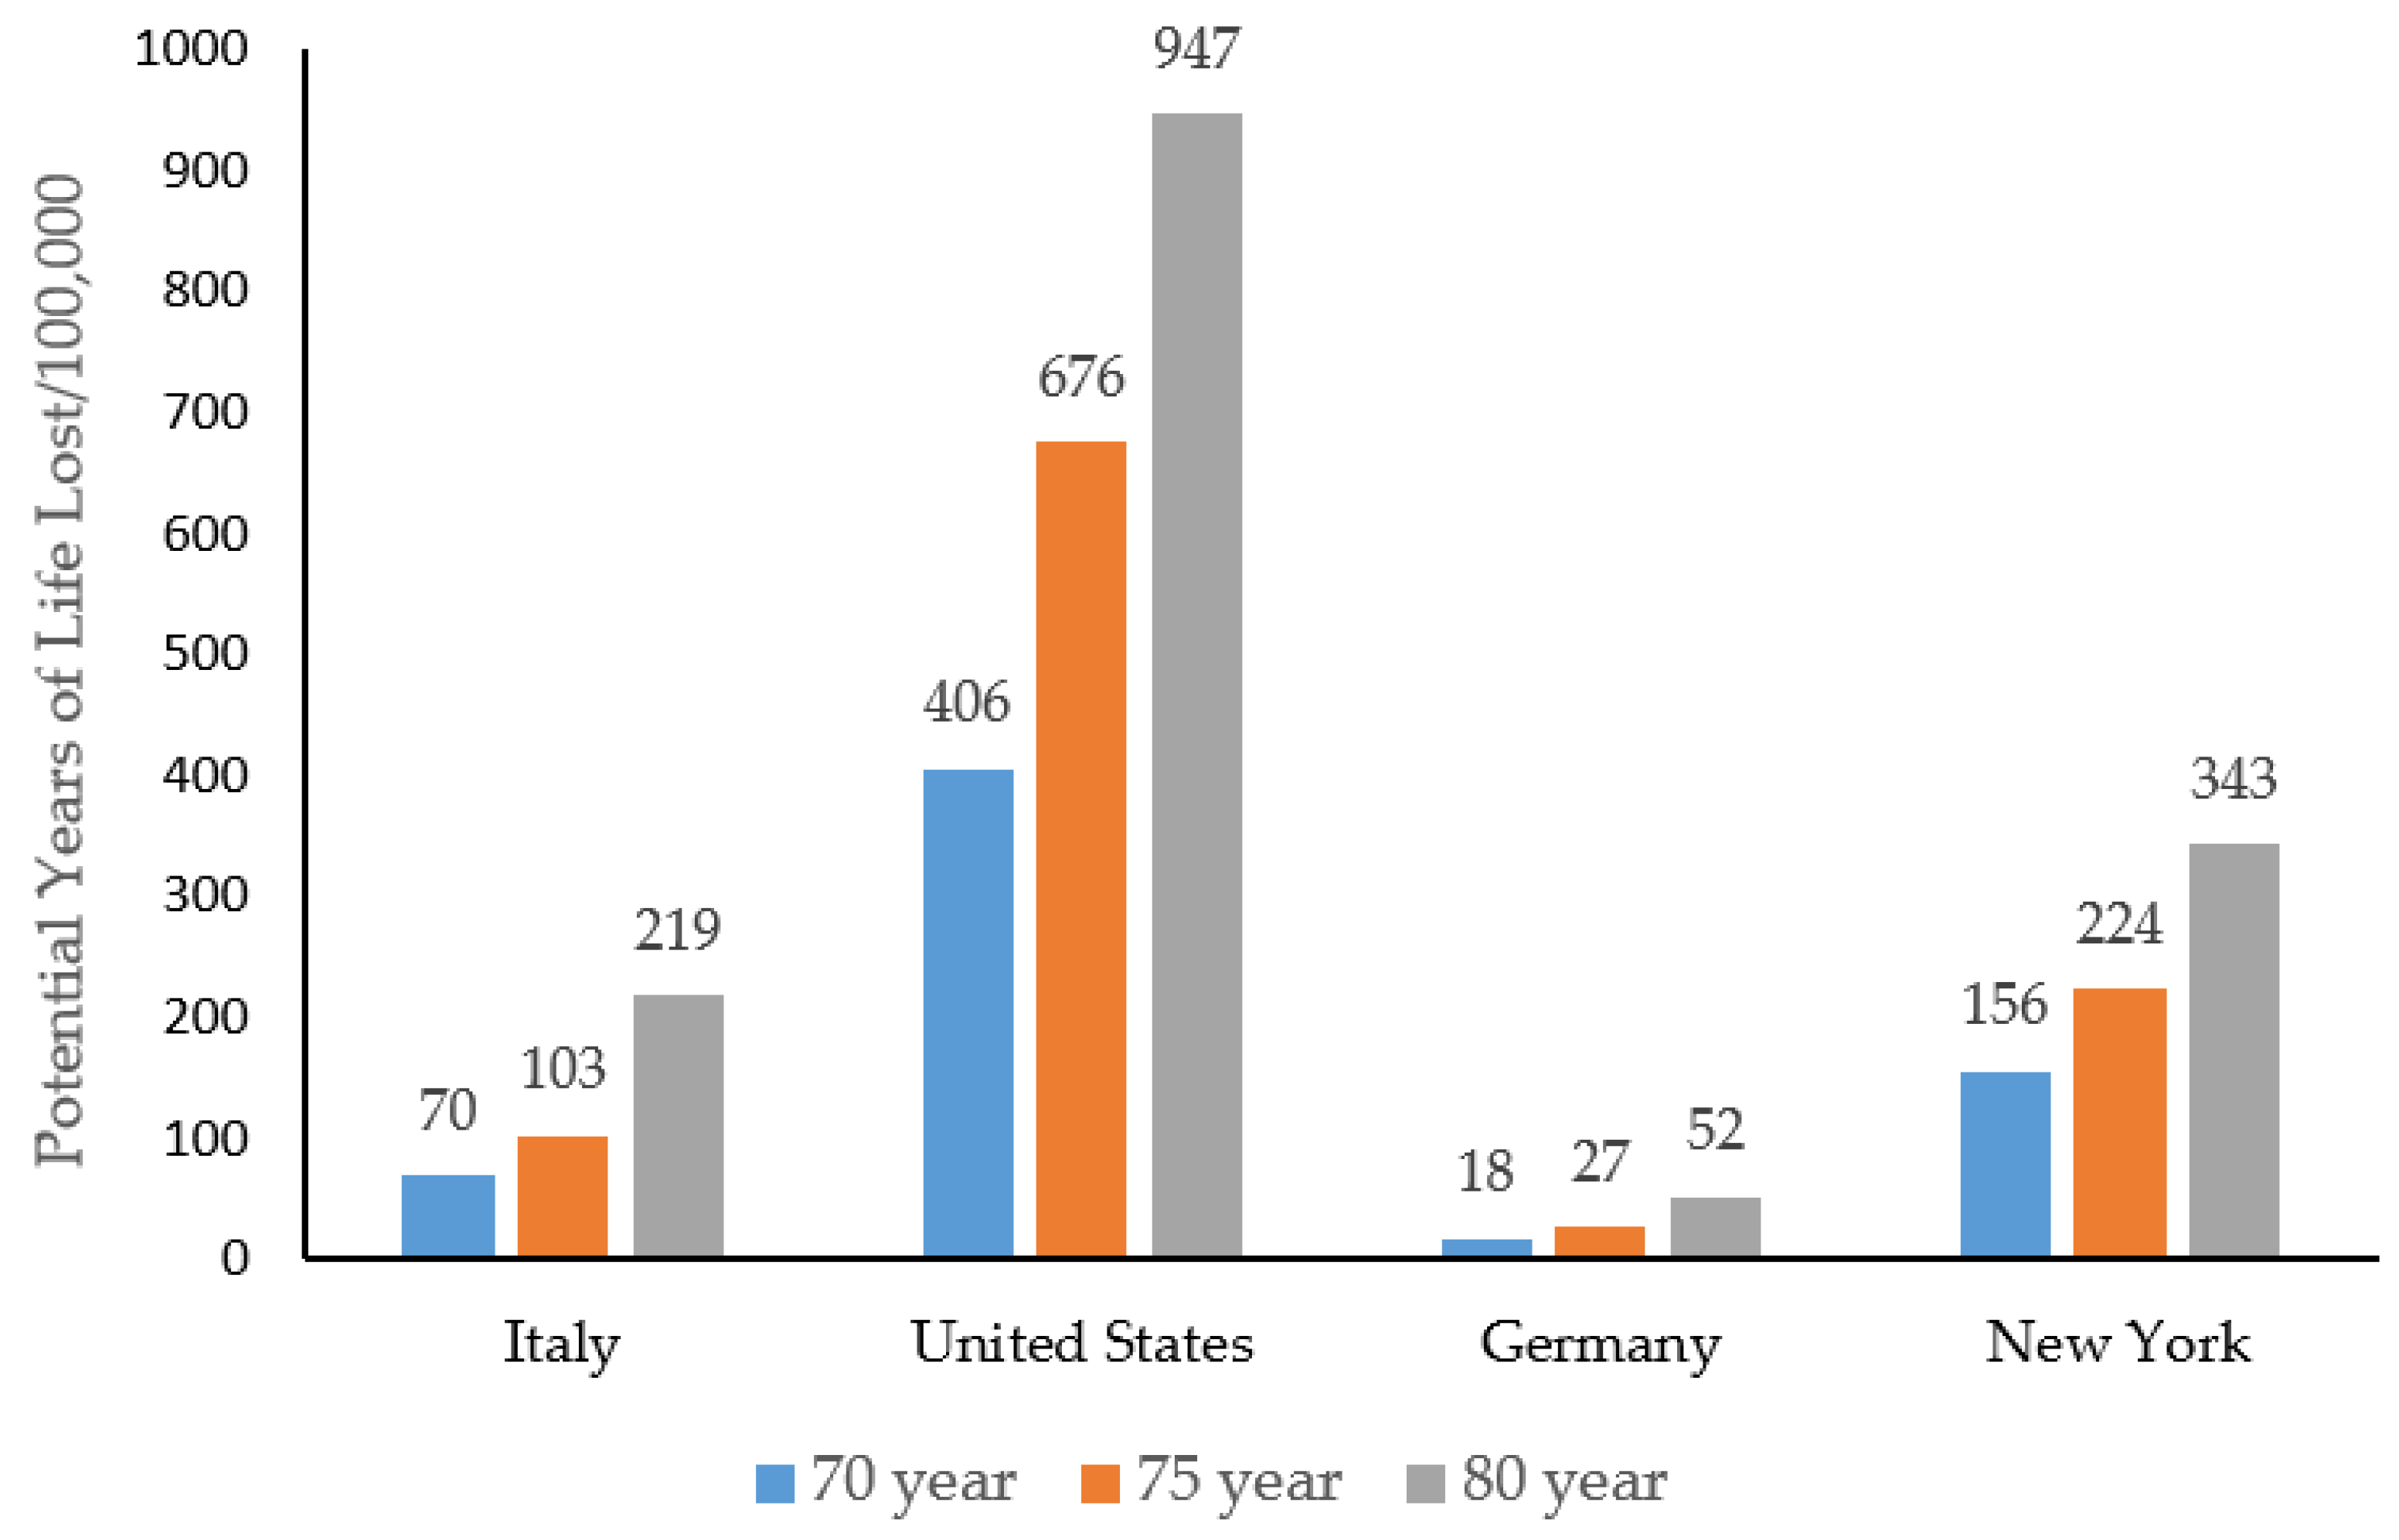
| PYLL/100,000 † | 70.39 | 109.28 | 218.75 | ||
| Age Group (Year) | Mid-Point of Class Interval (i) | COVID-19 Deaths (d) * | PYLL at Age Limit | ||
|---|---|---|---|---|---|
| 70 Years | 75 Years | 80 Years | |||
| <1 | 0.5 | 5 (0.006) | 345 | 370 | 395 |
| 1–4 | 2.5 | 3 (0.004) | 201 | 216 | 231 |
| 5–14 | 9.5 | 11 (0.01) | 660 | 715 | 770 |
| 15–24 | 19.5 | 93 (0.11) | 4650 | 5115 | 5580 |
| 25–34 | 29.5 | 542 (0.67) | 21,680 | 24,390 | 27,100 |
| 35–44 | 39.5 | 1403 (1.72) | 42,090 | 49,105 | 56,120 |
| 45–54 | 49.5 | 3893 (4.78) | 77,860 | 97,325 | 116,790 |
| 55–64 | 59.5 | 9776 (12.01) | 97,760 | 146,640 | 195,520 |
| 65–74 | 69.5 | 16,981 (20.87) | 0 | 84,905 | 169,810 |
| 75–84 | 79.5 | 21,822 (26.82) | 0 | 0 | 0 |
| 85+ | 89.5 | 26,843 (32.99) | 0 | 0 | 0 |
| Total deaths | 81,372 (100.0) | ||||
| Total PYLL | 245,246 | 408,781 | 572,316 | ||
| PYLL/100,000 † | 74.09 | 123.50 | 172.90 | ||
| PYLL/100,000, standardized ‡ | 405.62 | 676.10 | 946.57 | ||
| Age Group (Year) | Mid-Point of Class Interval (i) | COVID-19 Deaths (d) * | PYLL at Age Limit | ||
|---|---|---|---|---|---|
| 70 Years | 75 Years | 80 Years | |||
| 0–9 | 4.5 | 1 (0.01) | 65 | 70 | 75 |
| 10–19 | 14.5 | 2 (0.02) | 110 | 120 | 130 |
| 20–29 | 24.5 | 8 (0.10) | 360 | 400 | 440 |
| 30–39 | 34.5 | 20 (0.24) | 700 | 800 | 900 |
| 40–49 | 44.5 | 62 (0.75) | 1550 | 1860 | 2170 |
| 50–59 | 54.5 | 283 (3.43) | 4245 | 5660 | 7075 |
| 60–69 | 64.5 | 767 (9.29) | 3835 | 7670 | 11,505 |
| 70–79 | 74.5 | 1851 (22.43) | 0 | 0 | 9255 |
| 80–89 | 84.5 | 3704 (44.89) | 0 | 0 | 0 |
| 90–99 | 94.5 | 1504 (18.23) | 0 | 0 | 0 |
| 100+ | 50 (0.61) | 0 | 0 | 0 | |
| Total | 8252 (100) | 10,865 | 16,580 | 31,550 | |
| PYLL/100,000 † | 12.97 | 19.79 | 37.66 | ||
| PYLL/100,000, standardized ‡ | 17.97 | 27.42 | 52.18 | ||
| Age Group (Year) | Mid-Point of Class Interval (i) | COVID-19 Deaths (d) * | PYLL at Age Limit | ||
|---|---|---|---|---|---|
| 70 Years | 75 Years | 80 Years | |||
| 0–9 | 4.5 | 4 (0.02) | 260 | 280 | 300 |
| 10–19 | 14.5 | 10 (0.04) | 550 | 600 | 650 |
| 20–29 | 24.5 | 88 (0.37) | 3960 | 4400 | 4840 |
| 30–39 | 34.5 | 316 (1.33) | 11,060 | 12,640 | 14,220 |
| 40–49 | 44.5 | 836 (3.51) | 20,900 | 25,080 | 29,260 |
| 50–59 | 54.5 | 2279 (9.56) | 34,185 | 45,580 | 56,975 |
| 60–69 | 64.5 | 4670 (19.58) | 23,350 | 46,700 | 70,050 |
| 70–79 | 74.5 | 6204 (26.01) | 0 | 0 | 31,020 |
| 80–89 | 84.5 | 6131 (25.71) | 0 | 0 | 0 |
| 90+ | 3301 (13.84) | 0 | 0 | 0 | |
| Unknown | 9 (0.04) | 0 | 0 | 0 | |
| Total | 23,848 (100) | 94,265 | 135,280 | 207,315 | |
| PYLL/100,000 † | 484.89 | 695.87 | 1066.41 | ||
| PYLL/100,000, standardized ‡ | 155.91 | 223.74 | 342.89 | ||
© 2020 by the authors. Licensee MDPI, Basel, Switzerland. This article is an open access article distributed under the terms and conditions of the Creative Commons Attribution (CC BY) license (http://creativecommons.org/licenses/by/4.0/).
Share and Cite
Mitra, A.K.; Payton, M.; Kabir, N.; Whitehead, A.; Ragland, K.N.; Brown, A. Potential Years of Life Lost Due to COVID-19 in the United States, Italy, and Germany: An Old Formula with Newer Ideas. Int. J. Environ. Res. Public Health 2020, 17, 4392. https://doi.org/10.3390/ijerph17124392
Mitra AK, Payton M, Kabir N, Whitehead A, Ragland KN, Brown A. Potential Years of Life Lost Due to COVID-19 in the United States, Italy, and Germany: An Old Formula with Newer Ideas. International Journal of Environmental Research and Public Health. 2020; 17(12):4392. https://doi.org/10.3390/ijerph17124392
Chicago/Turabian StyleMitra, Amal K., Marinelle Payton, Nusrat Kabir, April Whitehead, Kimberly N. Ragland, and Alexis Brown. 2020. "Potential Years of Life Lost Due to COVID-19 in the United States, Italy, and Germany: An Old Formula with Newer Ideas" International Journal of Environmental Research and Public Health 17, no. 12: 4392. https://doi.org/10.3390/ijerph17124392