Relationship Between Early Childhood Non-Parental Childcare and Diet, Physical Activity, Sedentary Behaviour, and Sleep: A Systematic Review of Longitudinal Studies

 , , and
Abstract
:1. Introduction
2. Methods
2.1. Search Strategy
2.2. Study Selection and Eligibility Criteria
2.3. Data Extraction and Management
2.4. Data Synthesis
2.5. Quality Assessment
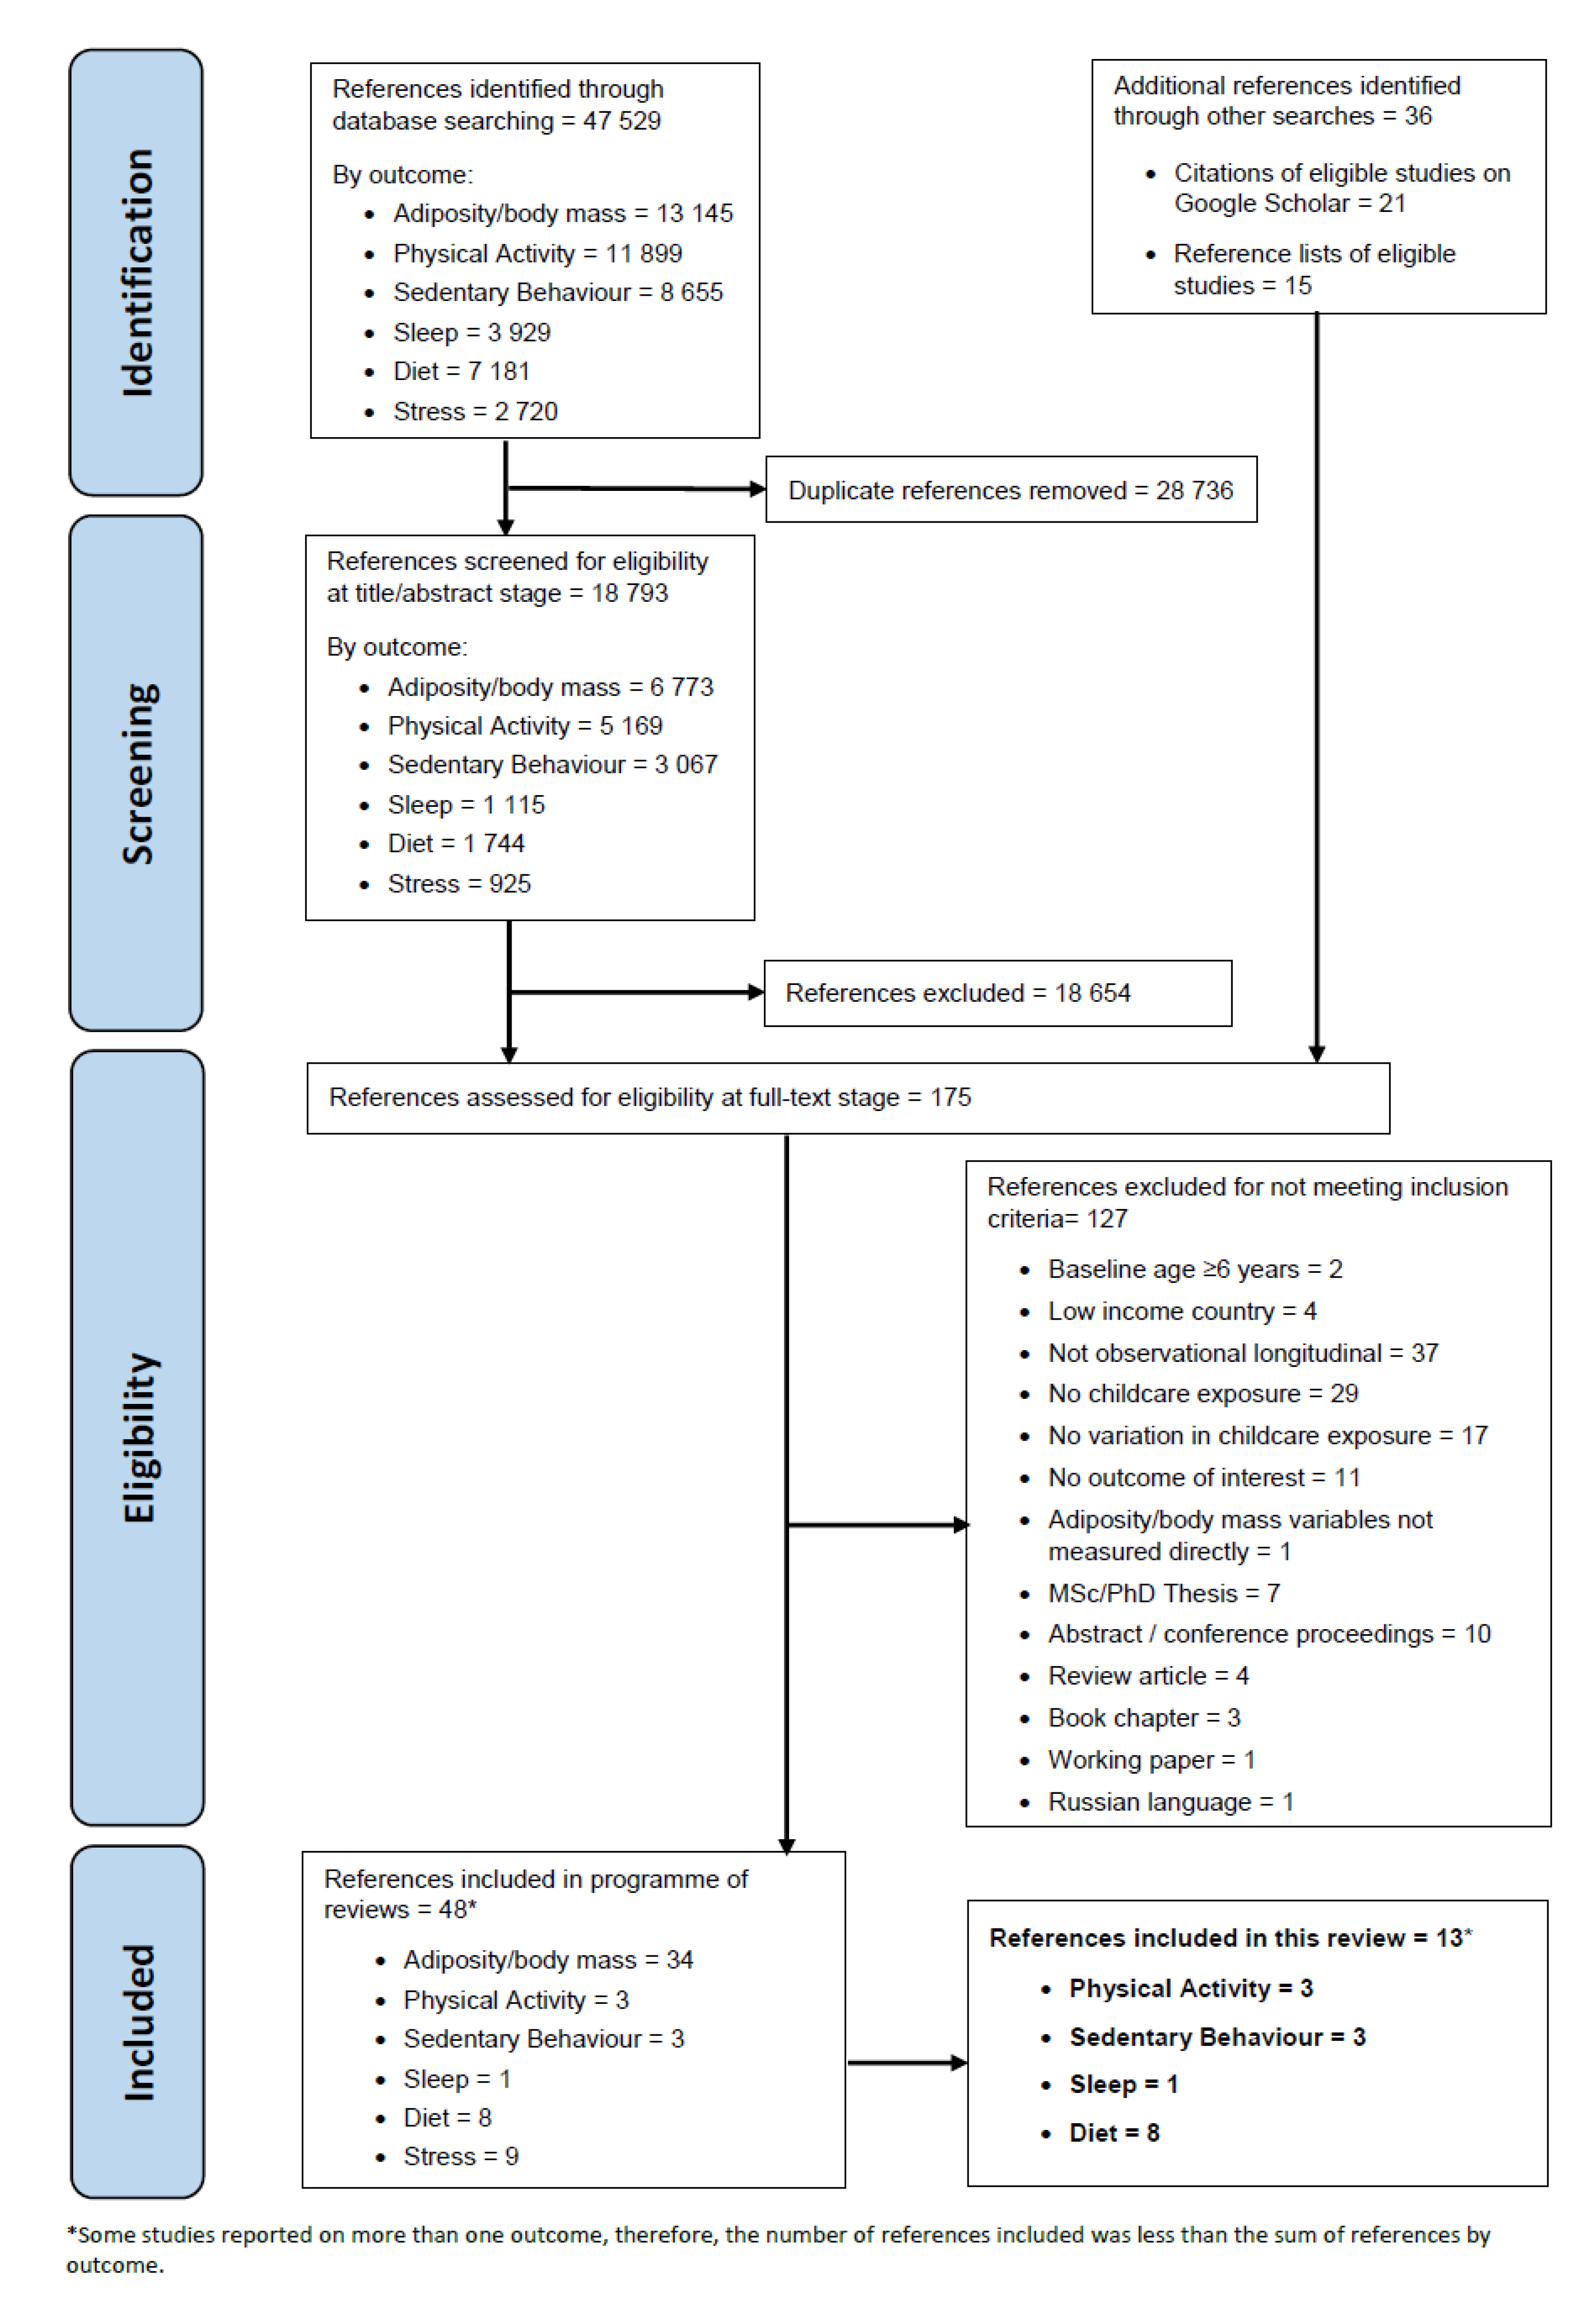
3. Results
3.1. Summary of Included Studies
3.2. Synthesis of Findings
3.3. Diet
3.4. Physical Activity
3.5. Sedentary Behaviour
3.6. Sleep
3.7. Quality Evaluation
4. Discussion
4.1. Summary of Findings
4.2. Strengths and Limitations of Studies Included in the Review
4.3. Strengths and Limitations of the Review
4.4. Interpretation of Findings
4.5. Implications for Policy, Practice, and Research
5. Conclusions
Supplementary Materials
Author Contributions
Funding
Acknowledgments
Conflicts of Interest
References
- United Nations Children’s Fund; World Health Organization; World Bank Group. Key Findings of the Joint Child Malnutrition Estimates (2019 Edition); 2019; Available online: https://www.who.int/nutgrowthdb/jme-2019-key-findings.pdf?ua=1 (accessed on 20 November 2019).
- Reilly, J.J.; Methven, E.; McDowell, Z.C.; Hacking, B.; Alexander, D.; Stewart, L.; Kelnar, C.J. Health consequences of obesity. Arch. Dis. Child. 2003, 88, 748–752. [Google Scholar] [CrossRef] [PubMed]
- Lakshman, R.; Elks, C.E.; Ong, K.K. Childhood obesity. Circulation 2012, 126, 1770–1779. [Google Scholar] [CrossRef] [PubMed]
- Lawlor, D.A.; Leon, D.A. Association of body mass index and obesity measured in early childhood with risk of coronary heart disease and stroke in middle age: Findings from the aberdeen children of the 1950s prospective cohort study. Circulation 2005, 111, 1891–1896. [Google Scholar] [CrossRef] [PubMed]
- Cameron, N.; Demerath, E.W. Critical periods in human growth and their relationship to diseases of aging. Am. J. Phys. Anthropol. 2002, 119, 159–184. [Google Scholar] [CrossRef] [PubMed]
- Dietz, W.H. Critical periods in childhood for the development of obesity. Am. J. Clin. Nutr. 1994, 59, 955–959. [Google Scholar] [CrossRef] [PubMed]
- Gaffney, K.F.; Kitsantas, P.; Brito, A.; Kastello, J. Baby Steps in the Prevention of Childhood Obesity: IOM Guidelines for Pediatric Practice. J. Pediatr. Nurs. 2014, 29, 108–113. [Google Scholar] [CrossRef]
- Jones, R.A.; Hinkley, T.; Okely, A.D.; Salmon, J. Tracking physical activity and sedentary behavior in childhood: A systematic review. Am. J. Prev. Med. 2013, 44, 651–658. [Google Scholar] [CrossRef]
- Davison, K.K.; Birch, L.L. Childhood overweight: A contextual model and recommendations for future research. Obes. Rev. 2001, 2, 159–171. [Google Scholar] [CrossRef]
- Leal, C.; Chaix, B. The influence of geographic life environments on cardiometabolic risk factors: A systematic review, a methodological assessment and a research agenda. Obes. Rev. 2011, 12, 217–230. [Google Scholar] [CrossRef]
- Larson, N.; Ward, D.S.; Neelon, S.B.; Story, M. What role can child-care settings play in obesity prevention? A review of the evidence and call for research efforts. J. Am. Diet. Assoc. 2011, 111, 1343–1362. [Google Scholar] [CrossRef]
- Department of Health. Nutrition Guidelines for Early Childhood Development Centres; Department of Health, Republic of South Africa: Pretoria, South Africa, 2016.
- Department of Health & Human Services. Childcare and Healthy Eating; Department of Health & Human Services, State Government of Victoria: Melbourne, Australia, 2011. Available online: https://www.betterhealth.vic.gov.au/health/healthyliving/childcare-and-healthy-eating (accessed on 17 October 2019).
- Lucas, P.J.; Patterson, E.; Sacks, G.; Billich, N.; Evans, C.E.L. Preschool and School Meal Policies: An Overview of What We Know about Regulation, Implementation, and Impact on Diet in the UK, Sweden, and Australia. Nutrients 2017, 9, 736. [Google Scholar] [CrossRef] [PubMed]
- Laughlin, L. Who’s Minding the Kids? Child Care Arrangements: Spring 2011; U.S. Department of Commerce: Washington, DC, USA, 2011; pp. 70–135.
- United Nations Children’s Fund. The Child Care Transition, Innocenti Report Card 8; Innocenti Research Centre: Florence, Italy, 2008. [Google Scholar]
- Black, L.; Matvienko-Sikar, K.; Kearney, P.M. The association between childcare arrangements and risk of overweight and obesity in childhood: A systematic review. Obes. Rev. 2017, 18, 1170–1190. [Google Scholar] [CrossRef] [PubMed]
- Alberdi, G.; McNamara, A.E.; Lindsay, K.L.; Scully, H.A.; Horan, M.H.; Gibney, E.R.; McAuliffe, F.M. The association between childcare and risk of childhood overweight and obesity in children aged 5 years and under: A systematic review. Eur. J. Pediatr. 2016, 175, 1277–1294. [Google Scholar] [CrossRef] [PubMed]
- Swyden, K.; Sisson, S.B.; Lora, K.; Castle, S.; Copeland, K.A. Association of childcare arrangement with overweight and obesity in preschool-aged children: A narrative review of literature. Int. J. Obes. 2017, 41, 1–12. [Google Scholar] [CrossRef]
- Costa, S.; Adams, J.; Gonzalez-Nahm, S.; Benjamin Neelon, S.E. Childcare in Infancy and Later Obesity: A Narrative Review of Longitudinal Studies. Curr. Pediatr. Rep. 2017, 5, 118–131. [Google Scholar] [CrossRef]
- Lumeng, J.C.; Taveras, E.M.; Birch, L.; Yanovski, S.Z. Prevention of Obesity in Infancy and Early Childhood: A National Institutes of Health Workshop. JAMA Pediatr. 2015, 169, 484–490. [Google Scholar] [CrossRef]
- Monasta, L.; Batty, G.D.; Cattaneo, A.; Lutje, V.; Ronfani, L.; Van Lenthe, F.J.; Brug, J. Early-life determinants of overweight and obesity: A review of systematic reviews. Obes. Rev. 2010, 11, 695–708. [Google Scholar] [CrossRef]
- Iwata, S.; Iwata, O.; Iemura, A.; Iwasaki, M.; Matsuishi, T. Determinants of sleep patterns in healthy Japanese 5-year-old children. Int. J. Dev. Neurosci. 2011, 29, 57–62. [Google Scholar] [CrossRef]
- Vanderloo, L.M. Screen-viewing among preschoolers in childcare: A systematic review. BMC Pediatr. 2014, 14, 205. [Google Scholar] [CrossRef]
- Ward, S.; Belanger, M.; Donovan, D.; Carrier, N. Systematic review of the relationship between childcare educators’ practices and preschoolers’ physical activity and eating behaviours. Obes. Rev. 2015, 16, 1055–1070. [Google Scholar] [CrossRef]
- Fukuda, K.; Sakashita, Y. Sleeping pattern of kindergartners and nursery school children: Function of daytime nap. Percept. Mot. Ski. 2002, 94, 219–228. [Google Scholar] [CrossRef] [PubMed]
- Kim, J.; Peterson, K.E. Association of infant child care with infant feeding practices and weight gain among US infants. Arch. Pediatr. Adolesc. Med. 2008, 162, 627–633. [Google Scholar] [CrossRef] [PubMed]
- Tandon, P.S.; Saelens, B.E.; Christakis, D.A. Active play opportunities at child care. Pediatrics 2015, 135, e1425–e1431. [Google Scholar] [CrossRef] [PubMed]
- Bingham, D.D.; Costa, S.; Hinkley, T.; Shire, K.A.; Clemes, S.A.; Barber, S.E. Physical Activity During the Early Years: A Systematic Review of Correlates and Determinants. Am. J. Prev. Med. 2016, 51, 384–402. [Google Scholar] [CrossRef] [PubMed]
- Vanderloo, L.M.; Tucker, P.; Johnson, A.M.; Burke, S.M.; Irwin, J.D. Environmental influences on preschoolers’ physical activity levels in various early-learning facilities. Res. Q. Exerc. Sport 2015, 86, 360–370. [Google Scholar] [CrossRef] [PubMed]
- Cerin, E.; Baranowski, T.; Barnett, A.; Butte, N.; Hughes, S.; Lee, R.E.; Mendoza, J.A.; Thompson, D.; O’Connor, T.M. Places where preschoolers are (in)active: An observational study on Latino preschoolers and their parents using objective measures. Int. J. Behav. Nutr. Phys. Act. 2016, 13, 29. [Google Scholar] [CrossRef] [PubMed]
- Peden, M.E.; Jones, R.; Costa, S.; Ellis, Y.; Okely, A.D. Relationship between children’s physical activity, sedentary behavior, and childcare environments: A cross sectional study. Prev. Med. Rep. 2017, 6, 171–176. [Google Scholar] [CrossRef]
- Plancoulaine, S.; Lioret, S.; Regnault, N.; Heude, B.; Charles, M.A. Gender-specific factors associated with shorter sleep duration at age 3 years. J. Sleep Res. 2015, 24, 610–620. [Google Scholar] [CrossRef]
- Costa, S.; Adams, J.; Benjamin Neelon, S.E. The Relationship between Childcare and Adiposity, Body Mass, and Obesity-Related Risk Factors: A Systematic Review of Longitudinal Studies; CRD42015027233; PROSPERO: York, UK, 2015. [Google Scholar]
- Shamseer, L.; Moher, D.; Clarke, M.; Ghersi, D.; Liberati, A.; Petticrew, M.; Shekelle, P.; Stewart, L.A. Preferred reporting items for systematic review and meta-analysis protocols (PRISMA-P) 2015: Elaboration and explanation. BMJ 2015, 349. [Google Scholar] [CrossRef]
- Costa, S.; Adams, J.; Phillips, V.; Benjamin Neelon, S.E. The relationship between childcare and adiposity, body mass and obesity-related risk factors: Protocol for a systematic review of longitudinal studies. Syst. Rev. 2016, 5, 141. [Google Scholar] [CrossRef]
- Lakshman, R.; Mazarello Paes, V.; Hesketh, K.; O’Malley, C.; Moore, H.; Ong, K.; Griffin, S.; Sluijs, E.; Summerbell, C. Protocol for systematic reviews of determinants/correlates of obesity-related dietary and physical activity behaviors in young children (preschool 0 to 6 years): Evidence mapping and syntheses. Syst. Rev. 2013, 2, 28. [Google Scholar] [CrossRef] [PubMed] [Green Version]
- The World Bank. World Bank Country and Lending Groups—World Bank Data Help Desk. Available online: https://datahelpdesk.worldbank.org/knowledgebase/articles/906519-world-bank-country-and-lending-groups (accessed on 18 January 2017).
- Obbagy, J.E.; Lyon, J.M.G.; Spahn, J.M. USDA Nutrition Evidence Library Systematic Reviews: Using food and nutrition research to inform nutrition programs and policies. Digest 2014, 49, 1–7. [Google Scholar]
- Belfield, C.R.; Kelly, I.R. Early education and health outcomes of a 2001 U.S. Birth Cohort. Econ. Hum. Biol. 2013, 11, 310–325. [Google Scholar] [CrossRef] [PubMed]
- Cairns, A.; Harsh, J. Changes in Sleep Duration, Timing, and Quality as Children Transition to Kindergarten. Behav. Sleep Med. 2014, 12, 507–516. [Google Scholar] [CrossRef] [Green Version]
- D’Onise, K.; Lynch, J.W.; McDermott, R.A.; Esterman, A. The beneficial effects of preschool attendance on adult cardiovascular disease risk. Aust. N. Z. J. Public Health 2011, 35, 278–283. [Google Scholar] [CrossRef]
- Lumeng, J.C.; Gannon, K.; Appugliese, D.; Cabral, H.J.; Zuckerman, B. Preschool child care and risk of overweight in 6- to 12-year-old children. Int. J. Obes. 2005, 29, 60–66. [Google Scholar] [CrossRef] [Green Version]
- Lumeng, J.C.; Rahnama, S.; Appugliese, D.; Kaciroti, N.; Bradley, R.H. Television exposure and overweight risk in preschoolers. Arch. Pediatr. Adolesc. Med. 2006, 160, 417–422. [Google Scholar] [CrossRef] [Green Version]
- Taylor, R.W.; Murdoch, L.; Carter, P.; Gerrard, D.F.; Williams, S.M.; Taylor, B.J. Longitudinal study of physical activity and inactivity in preschoolers: The FLAME study. Med. Sci. Sports Exerc. 2009, 41, 96–102. [Google Scholar] [CrossRef]
- Camara, S.; de Lauzon-Guillain, B.; Heude, B.; Charles, M.A.; Botton, J.; Plancoulaine, S.; Forhan, A.; Saurel-Cubizolles, M.J.; Dargent-Molina, P.; Lioret, S. Multidimensionality of the relationship between social status and dietary patterns in early childhood: Longitudinal results from the French EDEN mother-child cohort. Int. J. Behav. Nutr. Phys. Act. 2015, 12, 122. [Google Scholar] [CrossRef] [Green Version]
- Lee, R.; Zhai, F.; Han, W.J.; Brooks-Gunn, J.; Waldfogel, J. Head Start and Children’s Nutrition, Weight, and Health Care Receipt. Early Child. Res. Q. 2013, 28, 723–733. [Google Scholar] [CrossRef] [Green Version]
- Levy, S.M.; Slager, S.L.; Warren, J.J.; Levy, B.T.; Nowak, A.J. Associations of pacifier use, digit sucking, and child care attendance with cessation of breastfeeding. J. Fam. Pract. 2002, 51, 465. [Google Scholar] [PubMed]
- Pearce, A.; Li, L.; Abbas, J.; Ferguson, B.; Graham, H.; Law, C. Childcare use and inequalities in breastfeeding: Findings from the UK Millennium Cohort Study. Arch. Dis. Child. 2012, 97, 39–42. [Google Scholar] [CrossRef] [PubMed]
- Sata, M.; Yamagishi, K.; Sairenchi, T.; Ikeda, A.; Irie, F.; Watanabe, H.; Iso, H.; Ota, H. Impact of Caregiver Type for 3-Year-Old Children on Subsequent Between-Meal Eating Habits and Being Overweight from Childhood to Adulthood: A 20-Year Follow-up of the Ibaraki Children’s Cohort (IBACHIL) Study. J. Epidemiol. 2015, 25, 600–607. [Google Scholar] [CrossRef] [PubMed] [Green Version]
- Wasser, H.M.; Thompson, A.L.; Siega-Riz, A.M.; Adair, L.S.; Hodges, E.A.; Bentley, M.E. Who’s feeding baby? Non-maternal involvement in feeding and its association with dietary intakes among infants and toddlers. Appetite 2013, 71, 7–15. [Google Scholar] [CrossRef] [Green Version]
- Weile, B.; Rubin, D.H.; Krasilnikoff, P.A.; Kuo, H.S.; Jekel, J.F. Infant feeding patterns during the first year of life in Denmark: Factors associated with the discontinuation of breast-feeding. J. Clin. Epidemiol. 1990, 43, 1305–1311. [Google Scholar] [CrossRef]
- Rajulton, F. The fundamentals of longitudinal research: An overview. Can. Stud. Popul. 2001, 28, 169–185. [Google Scholar] [CrossRef] [Green Version]
- Kagamimori, S.; Yamagami, T.; Sokejima, S.; Numata, N.; Handa, K.; Nanri, S.; Saito, T.; Tokui, N.; Yoshimura, T.; Yoshida, K. The relationship between lifestyle, social characteristics and obesity in 3-year-old Japanese children. Child Care Health Dev. 2008, 25, 235–248. [Google Scholar] [CrossRef]
- Nevarez, M.D.; Rifas-Shiman, S.L.; Kleinman, K.P.; Gillman, M.W.; Taveras, E.M. Associations of Early Life Risk Factors with Infant Sleep Duration. Acad. Pediatr. 2010, 10, 187–193. [Google Scholar] [CrossRef] [Green Version]
- Rutter, H.; Savona, N.; Glonti, K.; Bibby, J.; Cummins, S.; Finegood, D.T.; Greaves, F.; Harper, L.; Hawe, P.; Moore, L.; et al. The need for a complex systems model of evidence for public health. Lancet 2017, 390, 2602–2604. [Google Scholar] [CrossRef] [Green Version]


| Study (Date) | Location | Sample Size | Study Design | Sex | Ethnicity/Country of Birth | Outcome |
|---|---|---|---|---|---|---|
| Belfield & Kelly (2013) [40] | USA | 6550 | Prospective longitudinal cohort study (Early Childhood Longitudinal Survey—Birth Cohort) | Preschool: 4124 (50.6%) girls, 4026 (49.4%) boys * Kindergarten: 3301 (50.4%) girls, 3249 (49.6%) boys* | Preschool: 1231 (15.1%) Black, 1157 (14.2%) Hispanic, 864 (10.6%) Asian, 1410 (17.3%) Other non-White, 3488 (42.8%) White Kindergarten: 1009 (15.4%) Black, 943 (14.4%) Hispanic, 766 (11.7%) Asian, 1212 (18.5%) Other non-White, 2620 (40.0%) White | Physical activity, diet |
| Cairns & Harsh (2014) [41] | USA | 34 | Prospective longitudinal study | 15 (44.1%) girls, 19 (55.9%) boys | 62% White, 32% Black, 6% Other | Sleep |
| D’Onise et al. (2011) [42] | Australia | 1063 | Prospective longitudinal cohort study (North West Adelaide Health Study) | 580 (54.6%) girls, 483 (45.4%) boys | Not reported | Physical activity, sedentary behaviour |
| Lumeng et al. (2005) [43] | USA | 1244 | Longitudinal panel survey study | 630 (50.6%) girls, 614 (49.4%) boys | 488 (39.2%) Black, 69 (5.5%) Hispanic, 623 (50.1%) White, 64 (5.1%) Other | Sedentary behaviour |
| Lumeng et al. (2006) [44] | USA | 1016 | Prospective longitudinal study | 498 (49.0%) girls, 518 (51.0%) boys | 841 (82.8%) White, 175 (17.2%) non-White | Sedentary behaviour |
| Taylor et al. (2009) [45] | New Zealand | 3 years: 238 4 years: 216 5 years: 204 | Prospective longitudinal cohort study (The Family Lifestyle, Activity, Movement, and Eating study) | 3 years: 107 (43.9%) girls, 137 (56.1%) boys 4 years: 104 (43.9%) girls, 133 (56.1%) boys 5 years: 99 (44%) girls, 126 (56%) boys | Baseline: 87% Caucasian, 10.8% Maori, 3.7% Pacific Islanders | Physical activity |
| Camara et al. (2015) [46] | France | 974 | Prospective longitudinal cohort study (EDEN—Etude des Déterminants pré et post natals du développement et de la santé de l’ENfant) | 454 (46.6%) girls, 520 (53.4%) boys | France birth (ethnic composition not presented) | Diet |
| Lee et al. (2013) [47] | USA | 2150 | Prospective longitudinal cohort study (Early Childhood Longitudinal Study-Birth Cohort (ECLS-B)) | 49% girls, 51% boys (at birth) | USA birth (ethnic composition not presented) | Diet |
| Levy et al. (2002) [48] | USA | 1387 | Prospective longitudinal cohort study (Iowa Fluoride Study) | Not reported | 95% White, 5% Other | Diet |
| Pearce et al. (2012) [49] | UK | 18,050 | Prospective longitudinal cohort study (Millennium Cohort Study) | Not reported | UK birth (ethnic composition not presented) | Diet |
| Sata et al. (2015) [50] | Japan | 4281 | Prospective longitudinal cohort study (Ibaraki Children’s Cohort (IBACHIL) Study) | 2042 (47.7%) girls, 2239 (52.3%) boys | Japan birth (ethnic composition not presented) | Diet |
| Wasser et al. (2013) [51] | USA | 210 | Prospective longitudinal study | 116 (53.5%) girls, 101 (46.5%) boys | African-American | Diet |
| Weile et al. (1990) [52] | Denmark | 500 | Prospective longitudinal study | Not reported | Denmark birth (ethnic composition not presented) | Diet |
| Study | Exposure | Age at Childcare Exposure | Outcome | Age at Outcome | Analysis | Adjustment | Results (Most Adjusted Model) |
|---|---|---|---|---|---|---|---|
| Belfield & Kelly (2013) | Centre-based preschool | 4 y | Low activity level | 5–6 y | Multivariable probit regression models | Child’s race/ethnicity, gender, age, and number of siblings, twin (yes/no), maternal employment, education, and marital status, health insurance status, father non-resident, household income, geographic region, and prior health at 24 mo (general health status, and indicators of asthma, gastroenteritis, respiratory condition, and ear infection) | AME = 0.124 (SE: 0.120), p > 0.05 |
| Centre-based preschool | 4 y | Screened low activity | 5–6 y | Multivariable probit regression models | AME = 0.056 (SE: 0.084), p > 0.05 | ||
| Centre-based preschool | 4 y | Regular fast food consumption (vs. not) | 5–6 y | Multivariable probit regression models | AME = −0.15 (SE: 0.055), p > 0.05 | ||
| Centre-based preschool | 4 y | Regular soda consumption (vs. not) | 5–6 y | Multivariable probit regression models | AME = −0.117 (SE: 0.056), p < 0.05 | ||
| Centre-based preschool | 4 y | Regular candy consumption (vs. not) | 5–6 y | Multivariable probit regression models | AME = 0.031 (SE: 0.053), p > 0.05 | ||
| Centre-based preschool | 4 y | Regular chips consumption (vs. not) | 5–6 y | Multivariable probit regression models | AME = 0.113 (SE: 0.054), p < 0.05 | ||
| Centre-based preschool | 4 y | Infrequent vegetable consumption (vs. frequent) | 5–6 y | Multivariable probit regression models | AME = 0.049 (SE: 0.058), p > 0.05 | ||
| Centre-based preschool | 4 y | Infrequent fruit consumption (vs. frequent) | 5–6 y | Multivariable probit regression models | AME = −0.120 (SE: 0.060), p < 0.05 | ||
| Centre-based preschool for 2 y | 4 y | Low activity level | 5–6 y | Multivariable probit regression models | AME = 0.007 (SE: 0.173), p > 0.05 | ||
| Centre-based preschool for 2 y | 4 y | Screened low activity | 5–6 y | Multivariable probit regression models | AME = 0.058 (SE: 0.126), p > 0.05 | ||
| Centre-based preschool for 2 y | 4 y | Regular fast food consumption (vs. not) | 5–6 y | Multivariable probit regression models | AME = 0.022 (SE: 0.085), p > 0.05 | ||
| Centre-based preschool for 2 y | 4 y | Regular soda consumption (vs. not) | 5–6 y | Multivariable probit regression models | AME = −0.260 (SE: 0.083), p < 0.01 | ||
| Centre-based preschool for 2 y | 4 y | Regular candy consumption (vs. not) | 5–6 y | Multivariable probit regression models | AME = −0.031 (SE: 0.080), p > 0.05 | ||
| Centre-based preschool for 2 y | 4 y | Regular chips consumption (vs. not) | 5–6 y | Multivariable probit regression models | AME = 0.024 (SE: 0.081), p > 0.05 | ||
| Centre-based preschool for 2 y | 4 y | Infrequent vegetable consumption (vs. frequent) | 5–6 y | Multivariable probit regression models | AME = −0.113 (SE: 0.090), p > 0.05 | ||
| Centre-based preschool for 2 y | 4 y | Infrequent fruit consumption (vs. frequent) | 5–6 y | Multivariable probit regression models | AME = −0.231 (SE: 0.093), p < 0.01 | ||
| Head Start | 4 y | Low activity level | 5–6 y | Multivariable probit regression models | AME = 0.313 (SE: 0.142), p < 0.05 | ||
| Head Start | 4 y | Screened low activity | 5–6 y | Multivariable probit regression models | AME = 0.128 (SE: 0.112), p > 0.05 | ||
| Head Start | 4 y | Regular fast food consumption (vs. not) | 5–6 y | Multivariable probit regression models | AME = 0.050 (SE: 0.077), p > 0.05 | ||
| Head Start | 4 y | Regular soda consumption (vs. not) | 5–6 y | Multivariable probit regression models | AME = −0.065 (SE: 0.081), p > 0.05 | ||
| Head Start | 4 y | Regular candy consumption (vs. not) | 5–6 y | Multivariable probit regression models | AME = −0.108 (SE: 0.073), p > 0.05 | ||
| Head Start | 4 y | Regular chips consumption (vs. not) | 5–6 y | Multivariable probit regression models | AME = 0.040 (SE: 0.074), p > 0.05 | ||
| Head Start | 4 y | Infrequent vegetable consumption (vs. frequent) | 5–6 y | Multivariable probit regression models | AME = −0.067 (SE: 0.083), p > 0.05 | ||
| Head Start | 4 y | Infrequent fruit consumption (vs. frequent) | 5–6 y | Multivariable probit regression models | AME = −0.266 (SE: 0.085), p < 0.01 | ||
| Cairns & Harsh (2014) | All day preschool/daycare (vs. primary/secondary caregiver) | 5 y a | Total sleep duration weekday | 5 y b | Group by assessment mixed model ANOVA | None reported | Group: Not significant Time: F(2,64) = 5.2, p = 0.008, η2 = 0.14 Group by time: Not significant |
| All day preschool/daycare (vs. primary/secondary caregiver) | 5 y a | Nocturnal sleep duration weekday | 5 y b | Group by assessment mixed model ANOVA | Group: Not significant Time: Not significant Group by time: Not significant | ||
| All day preschool/daycare (vs. primary/secondary caregiver) | 5 y a | Sleep onset weekday | 5 y b | Group by assessment mixed model ANOVA | Group: F(1,32) = 5.8, p = 0.022, η2 = 0.15 Time: F(2,64) = 40.9, p < 0.001, η2 = 0.56 Group by time: F(2,64) = 6.1, p = 0.004, η2 = 0.16 | ||
| All day preschool/daycare (vs. primary/secondary caregiver) | 5 y a | Sleep onset time weekend | 5 y b | Group by assessment mixed model ANOVA | Group: Not reported Time: F(2,64) = 6.9, p < 0.01, η2 = 0.18 Group by time: Not reported | ||
| All day preschool/daycare (vs. primary/secondary caregiver) | 5 y a | Wake up time weekday | 5 y b | Group by assessment mixed model ANOVA | Group: F(1,32) = 14.9, p = 0.001, η2 = 0.32 Time: F(2,64) = 81.6, p < 0.001, η2 = 0.72 Group by time: F(2,64) = 17.5, p < 0.001, η2 = 0.35 | ||
| All day preschool/daycare (vs. primary/secondary caregiver) | 5 y a | Wake up time weekend | 5 y b | Group by assessment mixed model ANOVA | Group: Not reported Time: F(2,64) = 4.4, p < 0.05, η2 = 0.12 Group by time: Not reported | ||
| All day preschool/daycare (vs. primary/secondary caregiver) | 5 y a | Sleep efficiency weekday | 5 y b | Group by assessment mixed model ANOVA | Group: Not significant Time: F(2,64) = 3.5, p < 0.05, η2 = 0.10 Group by time: Not significant | ||
| All day preschool/daycare (vs. primary/secondary caregiver) | 5 y a | Nap duration weekday | 5 y b | Group by assessment mixed model ANOVA | Group: Not reported Time: F(2,55) = 20.46, p < 0.001, η2 = 0.436 Group by time: Not reported | ||
| All day preschool/daycare (vs. primary/secondary caregiver) | 5 y a | Nap duration weekend | 5 y b | Group by assessment mixed model ANOVA | Group: Not reported Time: Not significant Group by time: Not reported | ||
| All day preschool/daycare (vs. primary/secondary caregiver) | 5 y a | Number of weekdays with a nap | 5 y b | T-test (Summer vs. 2 weeks after start of kindergarten) | Group: Not reported Time: T(13) = 3.4, p = 0.005 Group by time: Not reported | ||
| All day preschool/daycare (vs. primary/secondary caregiver) | 5 y a | Number of weekday naps | 5 y b | Group by assessment mixed model ANOVA | Group: Not significant Time: Not significant Group by time: Not reported | ||
| All day preschool/daycare (vs. primary/secondary caregiver) | 5 y a | Number of weekend naps | 5 y b | Group by assessment mixed model ANOVA | Group: Not significant Time: Not significant Group by time: Not reported | ||
| All day preschool/daycare (vs. primary/secondary caregiver) | 5 y a | Caregivers rating children as having less difficulty in going to bed | 5 y b | Group by assessment mixed model ANOVA | Group: Not reported Time: F(2,55) = 20.46, p < 0.001, η2 = 0.436 Group by time: Not reported | ||
| All day preschool/daycare (vs. primary/secondary caregiver) | 5 y a | Caregivers rating children as having less difficulty falling asleep | 5 y b | Group by assessment mixed model ANOVA | Group: Not reported Time: F(2,42) = 3.9, p = 0.03, η2 = 0.16 Group by time: Not reported | ||
| All day preschool/daycare (vs. primary/secondary caregiver) | 5 y a | Caregivers ratings of returning to wakefulness in the morning | 5 y b | Group by assessment mixed model ANOVA | Group: Not reported Time: Not reported Group by time: F(2,42) = 6.3, p = 0.004, η2 = 0.23 | ||
| Camara et al. (2015) | Childcare arrangement | 2–3 y | Processed, fast-foods at 2, 3, and 5 y dietary pattern | 2, 3, 5 y | Multivariable linear regression | Child’s age, gender, recruitment centre, season when the food frequency questionnaire was completed household disadvantage composite index, older sibling at home (2 y), maternal age at delivery, education level, and current/ past occupation, working time, and unemployed/student when child aged 2 y | At home, cared for by mother: Reference At home, not cared for by mother: B = 0.70 (SE: 0.14), p < 0.001 Crèche/pre-school: B = −0.03 (SE: 0.13), p > 0.05 At nanny’s home: B = 0.13 (SE: 0.13), p > 0.05 |
| Childcare arrangement | 2–3 y | Guidelines at 2, 3 and 5 y dietary pattern | 2, 3, 5 y | Multivariable linear regression | At home, cared for by mother: Reference At home, not cared for by mother: B = 0.01 (SE:0.15), p > 0.05 Crèche/pre-school: B = 0.08 (SE: 0.13), p > 0.05 At nanny’s home: B = 0.10 (SE: 0.13), p > 0.05 | ||
| D’Onise et al. (2011) | Attended Kindergarten Union preschool (vs. not attended) | 2–5 y | PA level | Preschool mean: 45.3 y No Preschool mean: 51.1 y | Multinomial logistic regression | Age, gender, child socioeconomic position, adult height, educational attainment, and adult income | Sedentary: Reference Low PA: RRR = 1.24 (95%CI: 0.89-1.74) Moderate PA: RRR = 1.26 (95%CI: 0.87–1.81) High PA: RRR = 1.99 (95%CI: 1.19–3.35) |
| Lee et al. (2013) | Type of childcare arrangement on a regular basis—Head Start vs. not Head Start | 4 y | Frequency of having healthy eating patterns (times/week) | 5–6 y | Propensity score-weighted regressions | Child’s variables: (e.g., gender, ethnicity, multiple birth, prematurity, breastfeeding and number of siblings at 9 mo, pre-treatment outcomes at 2 y); Maternal variables: (e.g., married at birth (yes/no), pre-pregnancy age and body mass index, depression at 9 mo, health status and employment at 2 y, foreign born); parenting behaviours/ home environments (e.g., KIDI at 9 mo, having sleep routine, weekday watching TV, and indoor and outdoor activities at 2 y); Family variables: (e.g., parent’s education at birth, parental occupation and family income at 9 mo, living in urban area, region of country, and number of times receiving Special Supplemental Nutrition Program for Women, Infants, and Children, food stamps, and Temporary Assistance for Needy Families by 2 y) | M = 2.21 (SE: 0.74), p < 0.01 |
| Type of childcare arrangement on a regular basis—Head Start vs. not Head Start | 4 y | Frequency of having unhealthy eating patterns (times/week) | 5–6 y | Propensity score-weighted regressions | M = 0.63 (SE: 0.57), p < 0.05 | ||
| Type of childcare arrangement on a regular basis—Head Start vs. Pre-Kindergarten | 4 y | Frequency of having healthy eating patterns (times/week) | 5–6 y | Propensity score-weighted regressions | M = 1.26 (SE: 1.33), p > 0.05 | ||
| Type of childcare arrangement on a regular basis—Head Start vs. Pre-Kindergarten | 4 y | Frequency of having unhealthy eating patterns (times/week) | 5–6 y | Propensity score-weighted regressions | M = 0.36 (SE: 0.97), p < 0.05 | ||
| Type of childcare arrangement on a regular basis—Head Start vs. Other centre-based | 4 y | Frequency of having healthy eating patterns (times/week) | 5–6 y | Propensity score-weighted regressions | M = 2.35 (SE: 1.14), p < 0.05 | ||
| Type of childcare arrangement on a regular basis—Head Start vs. Other centre-based | 4 y | Frequency of having unhealthy eating patterns (times/week) | 5–6 y | Propensity score-weighted regressions | M = 0.80 (SE: 0.78), p < 0.05 | ||
| Type of childcare arrangement on a regular basis—Head Start vs. Other non-parental | 4 y | Frequency of having healthy eating patterns (times/week) | 5–6 y | Propensity score-weighted regressions | M = 2.74 (SE: 1.32), p < 0.05 | ||
| Type of childcare arrangement on a regular basis—Head Start vs. Other non-parental | 4 y | Frequency of having unhealthy eating patterns (times/week) | 5–6 y | Propensity score-weighted regressions | M = 0.77 (SE:0.98), p < 0.05 | ||
| Type of childcare arrangement on a regular basis—Head Start vs. parental | 4 y | Frequency of having healthy eating patterns (times/week) | 5–6 y | Propensity score-weighted regressions | M = 2.07 (SE: 1.01), p < 0.05 | ||
| Type of childcare arrangement on a regular basis—Head Start vs. parental | 4 y | Frequency of having unhealthy eating patterns (times/week) | 5–6 y | Propensity score-weighted regressions | M = 0.47 (SE: 0.77), p < 0.05 | ||
| Levy et al. (2002) | Number of days in childcare between 0–6 mo of age | 6 weeks, 3 months, 6 months (referring to preceding time period) | Time until cessation of breastfeeding | 6 weeks, 3 months, 6 months | Cox proportional hazard regression | Pacifier use, digit sucking, maternal and paternal age and education, family income, breastfeeding plans, maternal smoking, infant’s gender, and infant antibiotic use. | No pacifier use, or digit sucking, or childcare: Reference No pacifier use, does digit sucking, no childcare days: p ≥ 0.05 No pacifier use, does digit sucking, 15 childcare days: HR = 1.41 (95%CI: 1.02–1.96), p < 0. No pacifier use, does digit sucking, 30 childcare days: p ≥ 0.05 No pacifier use, does digit sucking, 60 childcare days: p ≥ 0.05 Pacifier use, no digit sucking, no childcare: HR = 1.67 (95%CI: Not reported #), p < 0.05 Pacifier use, no digit sucking, 15 days childcare: p ≥ 0.05 Pacifier use, no digit sucking, 30 days childcare: Significant # Pacifier use, no digit sucking, 60 days childcare: Borderline significant # Pacifier use and digit sucking, no childcare: HR = 1.88 (95%CI: 1.36–2.62), p < 0.05 Pacifier use and digit sucking, 15 childcare days: HR = 1.52 (95%CI: 1.03–2.25), p < 0.05 Pacifier use and digit sucking, 30 childcare days: p ≥ 0.05 Pacifier use and digit sucking, 60 childcare days: Not significant |
| Lumeng et al. (2005) | Centre-based childcare attendance intensity (none vs. 15 h/week vs. ≥15 h/week) | 3–5 y | >4 h/day of TV viewing (yes vs. no) | 6–12 y | Turkey’s test | None | Not significant, p = 0.27 |
| Lumeng et al. (2006) | Average number of hours in non-parental childcare | 24–36 months | TV viewing (<2 h/day vs. ≥2 h/day) | 36 months | t-test | None | Not significant, p = 0.58 |
| Pearce et al. (2012) | Overall childcare type | <4 to 9 months | Breastfeeding for ≥4 months | 9 months | Poisson regression | Mother’s ethnicity, parity, age at first live birth, and whether the mother returned to work before the infant was age 4 mo | Parent: Reference Informal: RR = 0.51 (95%CI: 0.43–0.59), p < 0.05 Formal: RR = 0.84 (95%CI: 0.72–0.99), p < 0.05 |
| Childcare type by intensity | <4 to 9 months | Breastfeeding for ≥4 months | 9 months | Poisson regression | Parent: Reference Informal part-time: RR = 0.54 (95%CI: 0.45–0.63), p < 0.05 Informal full-time: RR = 0.42 (95%CI: 0.28–0.64), p < 0.05 Formal part-time: RR = 1.01 (95%CI: 0.82–1.24), p≥0.05 Formal full-time: RR = 0.68 (95%CI: 0.51–0.92), p < 0.05 | ||
| Childcare type by National Statistics Socio-economic Classification | <4 to 9 months | Breastfeeding for ≥4 months | 9 months | Poisson regression | Routine and Manual: Parent: Reference Informal: RR = 0.47 (95%CI: 0.34–0.66), p < 0.05 Formal: RR = 0.54 (95%CI: 0.21–1.36), p ≥ 0.05 Intermediate: Parent: Reference Informal: RR = 0.50 (95%CI: 0.37–0.67), p < 0.05 Formal: RR = 0.84 (95%CI: 0.57–1.23), p ≥ 0.05 Managerial and Professional: Parent: Reference Informal: RR = 0.50 (95%CI: 0.39–0.65), p < 0.05 Formal: RR = 0.76 (95%CI: 0.62–0.94), p < 0.05 | ||
| Childcare type by Maternal Education | <4 to 9 months | Breastfeeding for ≥4 months | 9 months | Poisson regression | None–GCSE D–G: Parent: Reference Informal: RR = 0.44 (95%CI: 0.27–0.71), p < 0.05 Formal: RR = 1.00 (95%CI: 0.44–2.28), p ≥ 0.05 GCSE A–C, A Levels, Diploma: Parent: Reference Informal: RR = 0.47 (95% CI: 0.37–0.59), p ≥ 0.05 Formal: RR = 0.83 (95%CI: 0.64–1.08), p ≥ 0.05 Degree: Parent: Reference Informal: RR = 0.82 (95%CI: 0.64–1.06), p ≥ 0.05 Formal: RR = 0.71 (95%CI: 0.58–0.86), p < 0.05 | ||
| Childcare type by Lone Parenthood | <4 to 9 months | Breastfeeding for ≥4 months | 9 months | Poisson regression | Lone parent: Parent: Reference Informal: RR = 0.40 (95%CI: 0.25–0.65), p < 0.05 Formal: RR = 1.65 (95%CI: 1.04–2.63), p < 0.05 Couple family: Parent: Reference Informal: RR = 0.53 (95%CI: 0.44–0.63), p < 0.05 Formal: RR = 0.79 (95%CI: 0.66–0.94), p < 0.05 | ||
| Childcare type by Area Deprivation | <4 to 9 months | Breastfeeding for ≥4 months | 9 months | Poisson regression | 5 (Most deprived): Parent: Reference Informal: RR = 0.72 (95%CI: 0.53–0.97), p < 0.05 Formal: RR = 0.63 (95% CI: 0.28–1.39), p ≥ 0.05 4: Parent: Reference Informal: RR = 0.54 (95%CI: 0.36–0.81), p < 0.05 Formal: RR = 1.12 (95% CI: 0.73–1.72), p ≥ 0.05 3: Parent: Reference Informal: RR = 0.51 (95%CI: 0.33–0.80), p < 0.05 Formal: RR = 1.27 (95% CI: 0.86–1.85), p ≥ 0.05 2: Parent: Reference Informal: RR = 0.37 (95%CI: 0.21–0.65), p < 0.05 Formal: RR = 0.71 (95% CI: 0.47–1.06), p ≥ 0.05 1 (Least deprived) Parent: Reference Informal: RR = 0.48 (95%CI: 0.26–0.88), p < 0.05 Formal: RR = 0.64 (95% CI: 0.42–1.00), p ≥ 0.05 | ||
| Sata et al. (2015) | Main daytime caregiver | 3 y | Between-meal eating before dinner | 6 y | Logistic regression models, stratified by gender | Baseline types of feeding, wake-up time, time of sleep, physical activity, playing outside, living with brothers or sisters, picky eating, and father’s employment. | Boys: Mothers: Reference Grandparents: OR = 2.1 (95%CI: 1.4–3.1), p < 0.001 Nursery school/kindergarten staff: OR = 1.6 (95%CI: 1.1–2.4), p < 0.05 Girls: Mothers: Reference Grandparents: OR = 2.5 (95%CI: 1.7–3.8), p < 0.001 Nursery school/kindergarten staff: OR = 1.6 (95%CI: 1.1–2.4), p < 0.05 |
| Main daytime caregiver | 3 y | Between-meal eating ≥3 times/day | 6 y | Logistic regression models, stratified by gender | Boys: Mothers: Reference Grandparents: OR = 3.2 (95%CI: 1.3–7.7), p < 0.05 Nursery school/kindergarten staff: OR = 1.9 (95%CI: 0.7–5.4), p ≥ 0.05 Girls: Mothers: Reference Grandparents: OR = 2.7 (95%CI: 1.1–6.7), p < 0.05 Nursery school/kindergarten staff: OR = 2.3 (95%CI: 0.9–6.3), p ≥ 0.05 | ||
| Main daytime caregiver | 3 y | Between-meal eating before bedtime ≥3 times/week | 6 y | Logistic regression models, stratified by gender | Boys: Mothers: Reference Grandparents: OR = 1.5 (95%CI: 0.8–2.7), p ≥ 0.05 Nursery school/kindergarten staff: OR = 1.1 (95% CI: 0.6–2.0), p ≥ 0.05 Girls: Mothers: Reference Grandparents: OR = 1.4 (95%CI: 0.7–2.5), p ≥ 0.05 Nursery school/kindergarten staff: OR = 1.6 (95% CI: 0.8–3.0), p ≥ 0.05 | ||
| Main daytime caregiver | 3 y | Between-meal eating before dinner | 12 y | Logistic regression models, stratified by gender | Boys: Mothers: Reference Grandparents: OR = 1.3 (95%CI: 0.9–1.8), p ≥ 0.05 Nursery school/kindergarten staff: OR = 1.0 (95%CI: 0.7–1.5), p ≥ 0.05 Girls: Mothers: Reference Grandparents: OR = 1.9 (95%CI: 1.3–2.8), p < 0.01 Nursery school/kindergarten staff: OR = 1.7 (95%CI: 1.1–2.5), p < 0.05 | ||
| Main daytime caregiver | 3 y | Between-meal eating ≥5 times/week | 12 y | Logistic regression models, stratified by gender | Boys: Mothers: Reference Grandparents: OR = 1.0 (95%CI: 0.7–1.4), p ≥ 0.05 Nursery school/kindergarten staff: OR = 1.2 (95%CI: 0.8–1.7), p ≥ 0.05 Girls: Mothers: Reference Grandparents: OR = 0.9 (95%CI: 0.6–1.3), p ≥ 0.05 Nursery school/kindergarten staff: OR = 0.9 (95%CI: 0.6–1.3), p ≥ 0.05 | ||
| Main daytime caregiver | 3 y | Between-meal eating before bedtime ≥3 times/week | 12 y | Logistic regression models, stratified by gender | Boys: Mothers: Reference Grandparents: OR = 1.5 (95%CI: 0.9–2.5), p ≥ 0.05 Nursery school/kindergarten staff: OR = 0.7 (95%CI: 0.4–1.3), p ≥ 0.05 Girls: Mothers: Reference Grandparents: OR = 1.1 (95%CI: 0.6–2.2), p ≥ 0.05 Nursery school/kindergarten staff: OR = 1.2 (95%CI: 0.6–2.5), p ≥ 0.05 | ||
| Main daytime caregiver | 3 y | Between-meal eating before dinner | 22 y | Logistic regression models, stratified by gender | Boys: Mothers: Reference Grandparents: OR = 0.9 (95%CI: 0.6–1.5), p ≥ 0.05 Nursery school/kindergarten staff: OR = 1.2 (95%CI: 0.8–1.9), p ≥ 0.05 Girls: Mothers: Reference Grandparents: OR = 1.2 (95%CI: 0.7–2.0), p ≥ 0.05 Nursery school/kindergarten staff: OR = 0.9 (95%CI: 0.5–1.5), p ≥ 0.05 | ||
| Main daytime caregiver | 3 y | Between-meal eating ≥5 times/week | 22 y | Logistic regression models, stratified by gender | Boys: Mothers: Reference Grandparents: OR = 0.9 (95%CI: 0.5–1.5) Nursery school/kindergarten staff: OR = 1.0 (95%CI: 0.6–1.6) Girls: Mothers: Reference Grandparents: OR = 0.8 (95%CI: 0.5–1.3) Nursery school/kindergarten staff: OR = 1.1 (95%CI: 0.7–1.8) | ||
| Main daytime caregiver | 3 y | Between-meal eating before bedtime ≥3 times/week | 22 y | Logistic regression models, stratified by gender | Boys: Mothers: Reference Grandparents: OR = 1.0 (95%CI: 0.6–1.7), p ≥ 0.05 Nursery school/kindergarten staff: OR = 0.6 (95%CI: 0.3–1.1), p ≥ 0.05 Girls: Mothers: Reference Grandparents: OR = 1.3 (95%CI: 0.6–2.6), p ≥ 0.05 Nursery school/kindergarten staff: OR = 1.3 (95%CI: 0.6–2.8), p ≥ 0.05 | ||
| Taylor et al. (2009) | Number of hours per week childcare attendance | 3, 4, 5 y | Total active time (minutes/day) | 3, 4, 5 y | Random coefficient regression | None reported | Not significant, p = 0.069–0.806 |
| Number of hours per week childcare attendance | 3, 4, 5 y | Average accelerometer counts (counts/minute) | 3, 4, 5 y | Random coefficient regression | None reported | Not significant, p = 0.069–0.806 | |
| Wasser et al. (2013) | Any non-maternal caregiver use | 6–18 months | Consuming any whole fruit | 6–18 months | Random-effects logistic regression | Maternal age, employment, depression, any maternal college, and marital status | None: Reference Any: OR = 1.51 (95%CI: 1.03–2.23), p < 0.05 |
| Any non-maternal caregiver use | 6–18 months | Consuming any vegetable | 6–18 months | Random-effects logistic regression | None: Reference Any: OR = 1.25 (95%CI: 0.79–1.99), p ≥ 0.05 | ||
| Any non-maternal caregiver use | 6–18 months | Consuming any juice | 6–18 months | Random-effects logistic regression | None: Reference Any: OR = 1.64 (95%CI: 1.01–2.67), p < 0.05 | ||
| Any non-maternal caregiver use | 6–18 months | Consuming any fried potatoes | 6–18 months | Random-effects logistic regression | None: Reference Any: OR = 0.82 (95%CI: 0.46–1.43), p ≥ 0.05 | ||
| Any non-maternal caregiver use | 6–18 months | Consuming any desserts and sweets | 6–18 months | Random-effects logistic regression | None: Reference Any: OR = 1.20 (95%CI: 0.77–1.86), p ≥ 0.05 | ||
| Any non-maternal caregiver use | 6–18 months | Consuming any sweetened beverages | 6–18 months | Random-effects logistic regression | None: Reference Any: OR = 1.17 (95%CI: 0.65–2.12), p ≥ 0.05 | ||
| Any non-maternal caregiver use | 6–18 months | Consuming any salty snacks | 6–18 months | Random-effects logistic regression | None: Reference Any: OR = 1.45 (95%CI: 0.67–3.12), p ≥ 0.05 | ||
| Type of non-maternal caregiver use | 6–18 months | Consuming any whole fruit | 6–18 months | Random-effects logistic regression | None: Reference Father: OR = 1.12 (95%CI: 0.64–1.97), p ≥ 0.05 Grandmother: OR = 0.92 (95%CI: 0.57–1.5), p ≥ 0.05 Licensed provider: OR = 1.55 (95%CI: 0.93–2.59), p ≥ 0.05 | ||
| Type of non-maternal caregiver use | 6–18 months | Consuming any vegetable | 6–18 months | Random-effects logistic regression | None: Reference Father: OR = 0.93 (95%CI: 0.48–1.8), p ≥ 0.05 Grandmother: OR = 0.89 (95%CI: 0.5–1.59), p ≥ 0.05 Licensed provider: OR = 0.96 (95%CI: 0.52–1.79), p ≥ 0.05 | ||
| Type of non-maternal caregiver use | 6–18 months | Consuming any juice | 6–18 months | Random-effects logistic regression | None: Reference Father: OR = 0.83 (95%CI: 0.42–1.64), p ≥ 0.05 Grandmother: OR = 1.97 (95%CI: 1.02–3.81), p < 0.05 Licensed provider: OR = 1.2 (95%CI: 0.61–2.34), p ≥ 0.05 | ||
| Type of non-maternal caregiver use | 6–18 months | Consuming any fried potatoes | 6–18 months | Random-effects logistic regression | None: Reference Father: OR = 1.13 (95%CI: 0.48–2.69), p ≥ 0.05 Grandmother: OR = 0.97 (95%CI: 0.48–1.96), p ≥ 0.05 Licensed provider: OR = 0.75 (95%CI: 0.38–1.48), p ≥ 0.05 | ||
| Type of non-maternal caregiver use | 6–18 months | Consuming any desserts and sweets | 6–18 months | Random-effects logistic regression | None: Reference Father: OR = 0.85 (95%CI: 0.44–1.67), p ≥ 0.05 Grandmother: OR = 0.74 (95%CI: 0.42–1.28), p ≥ 0.05 Licensed provider: OR = 1.30 (95%CI: 0.75–2.26), p ≥ 0.05 | ||
| Type of non-maternal caregiver use | 6–18 months | Consuming any sweetened beverages | 6–18 months | Random-effects logistic regression | None: Reference Father: OR = 1.71 (95%CI: 0.71–4.11), p ≥ 0.05 Grandmother: OR = 0.97 (95%CI: 0.46–2.05), p ≥ 0.05 Licensed provider: OR = 1.28 (95%CI: 0.63–2.62), p≥0.05 | ||
| Type of non-maternal caregiver use | 6–18 months | Consuming any salty snacks | 6–18 months | Random-effects logistic regression | None: Reference Father: OR = 2.06 (95%CI: 0.66-6.39), p ≥ 0.05 Grandmother: OR = 1.03 (95%CI: 0.40–2.69), p ≥ 0.05 Licensed provider: OR = 0.71 (95%CI: 0.28–1.79), p ≥ 0.05 | ||
| Weile et al. (1990) | Attending daycare (vs. cared for at home) | 1–12 months | Changing from feeding categories 1/2 to categories 3/4/5 * | 1–12 months | Cox proportional hazards model | Other children in family and socioeconomic status | RR = 2.08 (95%CI: 1.43–3.01), p < 0.05 |
| Attending daycare (vs. cared for at home) | 1–12 months | Changing from feeding categories 1/2/3 to categories 4/5 * | 1–12 months | Cox proportional hazards model | Other children in family and socioeconomic status | RR = 2.05 (95%CI:1.39–3.02), p < 0.05 | |
| Attending daycare (vs. cared for at home) | 1–12 months | Changing from feeding categories 1/2/3/4 to category 5 * | 1–12 months | Cox proportional hazards model | Other children in family and socioeconomic status | RR = 2.50 (95%CI: 1.66–3.78), p < 0.05 |
| NEL-BAT Question | Belfield & Kelly (2013) [40] | Cairns & Harsh (2014) [41] | D’Onise et al. (2011) [42] | Lumeng et al. (2005) [43] | Lumeng et al. (2006) [44] | Taylor et al. (2009) [45] | Camara et al. (2015) [46] | Lee et al. (2013) [47] | Levy et al. (2002) [48] | Pearce et al. (2012) [49] | Stata et al. (2015) [50] | Wasser et al. (2013) [51] | Weile et al. (1990) [52] | Total Score by Question |
|---|---|---|---|---|---|---|---|---|---|---|---|---|---|---|
| 1.Were the inclusion/exclusion criteria similar across study groups? | 0 | 0 | 0 | 0 | 0 | 0 | 0 | 0 | 0 | 0 | 0 | 0 | 0 | 0 |
| 2. Was the strategy for recruiting or allocating participants similar across study groups? | 0 | 0 | 0 | 0 | 0 | 0 | 0 | 0 | 0 | 0 | 0 | 0 | 0 | 0 |
| 5. Was there an attempt to balance the allocation between the study groups or match the study groups (e.g., through stratification, matching, propensity scores)? | 0 | 2 | 0 | 2 | 0 | 0 | 1 | 0 | 1 | 1 | 2 | 1 | 0 | 10 |
| 6. Was distribution of health status, demographics, and other critical confounding factors similar across study groups at baseline? If not, does the analysis control for baseline differences between groups? | 0 | 1 | 0 | 2 | 2 | 0 | 0 | 0 | 1 | 1 | 2 | 1 | 1 | 11 |
| 7. Did the investigators account for important variations in the execution of the study from the proposed protocol or research plan? | 0 | 0 | 0 | 1 | 0 | 1 | 0 | 0 | 0 | 0 | 0 | 0 | 0 | 2 |
| 8. Was adherence to the study protocol similar across study groups? | 0 | 0 | 0 | 0 | 0 | 0 | 1 | 1 | 1 | 1 | 1 | 1 | 1 | 7 |
| 9. Did the investigators account for the impact of unintended/unplanned concurrent interventions or exposures that were differentially experienced by study groups and might bias results? | 0 | 0 | 0 | 0 | 0 | 0 | 1 | 1 | 1 | 1 | 1 | 1 | 0 | 6 |
| 12. Were outcome assessors blinded to the intervention or exposure status of participants? | 0 | 1 | 1 | 0 | 0 | 1 | 1 | 2 | 2 | 1 | 2 | 1 | 2 | 14 |
| 13. Were valid and reliable measures used consistently across all study groups to assess inclusion/exclusion criteria, interventions/exposures, outcomes, participant health benefits and harms, and confounding? | 1 | 0 | 2 | 2 | 2 | 2 | 2 | 2 | 2 | 1 | 2 | 2 | 2 | 22 |
| 14. Was the length of follow-up similar across study groups? | 0 | 0 | 2 | 0 | 0 | 0 | 0 | 0 | 0 | 0 | 0 | 0 | 0 | 2 |
| 15. In cases of high or differential loss to follow-up, was the impact assessed (e.g., through sensitivity analysis or other adjustment method)? | 0 | 1 | 1 | 1 | 1 | 0 | 2 | 0 | 1 | 0 | 2 | 0 | 0 | 9 |
| 16. Were other sources of bias taken into account in the design and/or analysis of the study (e.g., through matching, stratification, interaction terms, multivariate analysis, or other statistical adjustment such as instrumental variables)? | 0 | 2 | 0 | 2 | 2 | 2 | 0 | 0 | 0 | 0 | 0 | 0 | 0 | 8 |
| 17.Were the statistical methods used to assess the primary outcomes adequate? | 0 | 0 | 0 | 2 | 2 | 2 | 0 | 0 | 0 | 0 | 0 | 0 | 0 | 6 |
| Total study score: | 1 | 7 | 6 | 12 | 9 | 8 | 8 | 6 | 9 | 6 | 12 | 7 | 6 |
© 2019 by the authors. Licensee MDPI, Basel, Switzerland. This article is an open access article distributed under the terms and conditions of the Creative Commons Attribution (CC BY) license (http://creativecommons.org/licenses/by/4.0/).
Share and Cite
Costa, S.; Benjamin-Neelon, S.E.; Winpenny, E.; Phillips, V.; Adams, J. Relationship Between Early Childhood Non-Parental Childcare and Diet, Physical Activity, Sedentary Behaviour, and Sleep: A Systematic Review of Longitudinal Studies. Int. J. Environ. Res. Public Health 2019, 16, 4652. https://doi.org/10.3390/ijerph16234652
Costa S, Benjamin-Neelon SE, Winpenny E, Phillips V, Adams J. Relationship Between Early Childhood Non-Parental Childcare and Diet, Physical Activity, Sedentary Behaviour, and Sleep: A Systematic Review of Longitudinal Studies. International Journal of Environmental Research and Public Health. 2019; 16(23):4652. https://doi.org/10.3390/ijerph16234652
Chicago/Turabian StyleCosta, Silvia, Sara E. Benjamin-Neelon, Eleanor Winpenny, Veronica Phillips, and Jean Adams. 2019. "Relationship Between Early Childhood Non-Parental Childcare and Diet, Physical Activity, Sedentary Behaviour, and Sleep: A Systematic Review of Longitudinal Studies" International Journal of Environmental Research and Public Health 16, no. 23: 4652. https://doi.org/10.3390/ijerph16234652